
A Novel Automated Algorithm for Computing Lumbar Flexion Test
Ratios Enhancing Athletes Objective Assessment of Low Back Pain
Francisco Carrillo-Perez
1
, Ignacio Diaz-Reyes
1
, Miguel Damas
1
, Oresti Banos
1
,
Victor Manuel Soto-Hermoso
2
and Alejandro Molina-Molina
2
1
Department of Computer Architecture and Computer Technology, E.T.S.I.I.T., Universidad de Granada,
Calle Periodista Daniel Saucedo Aranda, Granada, Spain
2
Department of Sport and Physical Education, Universidad de Granada, Granada, Spain
Keywords:
sEMG, LBP, Algorithm, FRP, Muscle Activity, LFT.
Abstract:
INTRODUCTION: Low Back Pain is a common muscular disorder that most adults would experience over
their lives. In healthy patients at the end of a lumbar flexion occur a phenomenon called the Flexion Relaxation
Phenomenon. Ratios between different phases of lumbar flexion can help diagnosing LBP patients. The aim
of this work is to create an automated algorithm to compute this ratios helping to discriminate between healthy
and LBP athletes. MATERIALS AND METHODS: 21 participants were recruited: 10 LBP and 11 healthy.
Participants were tested with Lumbar Flexion Test for evaluating LBP. sEMG were recorded in low back
muscles. RESULTS: Athletes diagnosed with LBP showed ratios lower than 1.5. For healthy participants we
observed results greater than 1.5. DISCUSSION AND CONCLUSION: Our results are contained between
rates found in literature. Our algorithm can help the diagnose of athletes with a non-intrusive method and with
little knowledge of sEMG analysis.
1 INTRODUCTION
Low Back Pain (LBP) is a common disorder invol-
ving the muscles, the bones and the nerves of the
low back. About eighty percent of adults experience
low back pain at some point in their lifetimes. It
is the most common cause of job-related disability
and a leading contributor to missed work days (NIH,
2017). A commonly used test for diagnosing LBP is
the Lumbar Flexion Test (LFT). LFT helps diagno-
sing LBP patients because of the phenomenon that
occurs toward the end of the lumbar spine flexion,
named Flexion-Relaxation Phenomenon (FRP) using
surface electromyography (sEMG) (Colloca and Hin-
richs, 2005)(Tabard et al., 2018)(Desai and Bisen,
2017). Toward the end of the lumbar spine flexion the
sEMG activity should be near to zero, producing what
is called myoelectric silence in healthy patients. Ho-
wever this not occur in LBP patients where the sEMG
activity maintains similar values as when performing
the flexion.
LBP is of prevalence in athletes whom perform
high intense sport activity, as well as other types back
abnormalities. (Kujala et al., 1992)(Schmidt et al.,
2014). An objective evaluation of LBP and an ob-
jective tool for recovery measurement is of crucial im-
portance to improve athletes muscle’s health.
The aim of the study was to develop an automa-
tic detection algorithm for computing Lumbar Flex-
ion Test ratios from sEMG and accelerometer signals
to discriminate between those who suffer from LBP
and healthy athletes.
2 MATERIALS AND METHODS
2.1 Materials
We used a sEMG and inertial sensor (Shimmer Sen-
sing, Dublin, Ireland). Data were obtained and pro-
cessed using mDurance (Banos et al., 2015), a soft-
ware for sEMG analysis (MDURANCE SOLUTI-
ONS SL, Granada, Spain).
Recording of raw EMG signals took place at a fre-
quency of 1024Hz, via two channels. IMU signals
were recorded at the same frequency. The raw EMG
signal was band-pass filtered (cutoff frequencies, 20
Hz, high pass; 400 Hz, low pass).
34
Carrillo-Perez, F., Diaz-Reyes, I., Damas, M., Banos, O., Soto-Hermoso, V. and Molina-Molina, A.
A Novel Automated Algorithm for Computing Lumbar Flexion Test Ratios Enhancing Athletes Objective Assessment of Low Back Pain.
DOI: 10.5220/0006922600340039
In Proceedings of the 6th International Congress on Sport Sciences Research and Technology Support (icSPORTS 2018), pages 34-39
ISBN: 978-989-758-325-4
Copyright © 2018 by SCITEPRESS – Science and Technology Publications, Lda. All rights reserved
2.2 Protocol
21 participants were recruited: 10 LBP and 11 he-
althy. Participants were tested with LFT for evalua-
ting LBP. Characteristics of participants can be obser-
ved in 1
Table 1: Mean and SD of athletes’ characteristics.
Height Weight
LBP Athletes 1.67 ± 0.054 64.75 ± 7.17
Healthy Athletes 1.736 ± 0.11 70.30 ± 7.16
Age IMC
LBP Athletes 37.33 ± 9.05 22.04 ± 1.92
Healthy Athletes 26.70 ± 6.59 23.436 ± 2.60
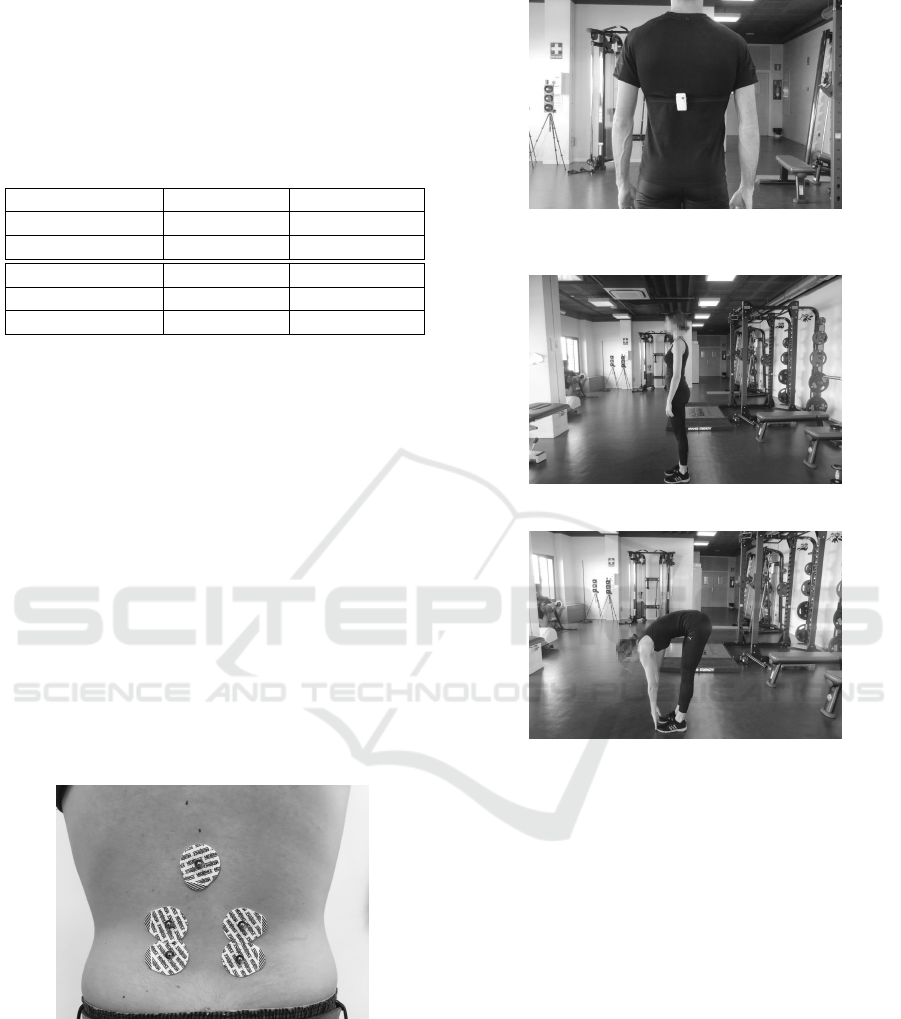
Electrodes were placed at the Erector Spinae (lon-
gissimus) both left and right, following the guidelines
for electrode placement of the Surface ElectroMyo-
Graphy for the Non-Invasive Assessment of Muscle
project (SENIAM), as presented in Figure 1.
sEMG sensor was placed on the back, as presented
in Figure 2.
Participants were asked to perform the FLT. The
FLT consists of the following phases. The participant
starts from a vertical position. This is named as Verti-
cal phase. He is asked to perform a lumbar spine flex-
ion, trying to touch his toes. This is named as Flexion
phase. He is asked to maintain this lumbar spine flex-
ion position between three and five seconds. This is
named as Maximum Voluntary Flexion (MVF) phase.
He is asked to return to a vertical position. This is
names as Extension phase. A visual representation of
FLT can be observed in Figures 3 and 4 .
Figure 1: Electrodes placement in the Erector Spinae (lon-
gissimus).
2.3 Automatic Measurement of Posture
The measurement of the posture is crucial in order
to run the algorithm. The IMU sensor combines tri-
axial accelerometer, gyroscopes and magnetometers,
enabling the measurement of the absolute attitudes or
Figure 2: sEMG sensor positioning in the back of the
athlete.
Figure 3: Vertical phase of LFT.
Figure 4: MVF phase of LFT.
inclinations of the body part to which the sensor is fas-
tened. IMU technology has been exploited during re-
cent years for body movement analysis. (Banos et al.,
2012)(Banos et al., 2013) (Banos et al., 2014) (Man-
nini et al., 2013) (Lin et al., 2015)
IMUs provide raw acceleration, magnetic field
data and angular rate that need to be fused together to
obtain a sole, optimal estimate of orientation. Diffe-
rent algorithms have been proposed in the literature to
that end, including Kalman filters (Roetenberg et al.,
2005), least squares filters (Luinge et al., 2007) or
Gaussian particle filters (Zhang et al., 2010).
In our work, we have used Madgwicks algorithm
(Madgwick et al., 2011), which outperforms most ex-
isting approaches in terms of implementation com-
plexity, sampling rate requirements and computatio-
nal needs. This technique does not suffer from the
well-known limitations of other solutions, like the
singularity problem associated with the Euler angle
representation (gimbal lock). Besides, this method
A Novel Automated Algorithm for Computing Lumbar Flexion Test Ratios Enhancing Athletes Objective Assessment of Low Back Pain
35

also omits the use of computationally expensive tri-
gonometric functions, making it more efficient and
easier to implement for real-time purposes. Madg-
wicks algorithm employs acceleration, angular rate
and magnetic field measurements to analytically de-
rive, through an optimized gradient-descent method, a
quaternion representation of motion (Harrison, 1999).
Thus, the output of the algorithm is a quaternion, a
compact vector in the form (q1,q2,q3,q4), which dy-
namically represents the orientation of the sensor.
Quaternions are frequently used in orientation es-
timation algorithms because of their numerical sta-
bility and computational efficiency. However, this
representation is difficult to interpret and visualize,
since it defines a R
4
space that cannot be represented
in a human-understandable three-dimensional view.
Accordingly, a translation into Euler angles is perfor-
med here, after all of the calculations to estimate the
quaternion are carried out. Euler angles represent the
possible rotations around the three cardinal axes, na-
mely yaw (ϕ), for the X axis, pitch (θ), for the Y axis,
and roll (φ), for the Z axis. Given the estimated qua-
ternion, the Euler angles can be simply obtained as
follows:
ϕ = arctan
2(q
1
q
4
− q
2
q
3
)
1 − 2(q
2
1
+ q
2
3
)
(1)
θ = arcsin(2(q
1
q
3
− q
4
q
1
)) (2)
φ = arctan
2(q
1
q
2
− q
3
q
4
)
1 − 2(q
2
2
+ q
2
3
)
(3)
2.4 Automatic Detection of Lumbar
Flexion Test Phases and Angle
Variation
2.4.1 Automatic Detection of Local Maximums
and Minimums
After we have obtained the measurement of posture
from the IMUs signal, a Savitzky-Golay filter (Savit-
zky and Golay, 1964) is applied to the values compu-
ted, in order to obtain a smoothed signal. In smoo-
thing, the data points of a signal are modified so that
individual points that are higher than the immedia-
tely adjacent points (presumably because of noise) are
reduced, and points that are lower than the adjacent
points are increased. This naturally leads to a smoot-
her signal (and a slower step response to signal chan-
ges). As long as the true underlying signal is actually
smooth, then the true signal will not be much distorted
by smoothing, but the high frequency noise will be re-
duced. Compared to other smooths of the same width,
the Savitzky-Golay smooth is less effective at redu-
cing noise, but more effective at retaining the shape
of the original signal.
Local maximums and minimums of signal data are
obtained using the first and second derivative. The
value of the slope at a local maximum or minimum
would be equal to 0. The value of the slope is com-
puted using the first derivate. The second derivative
is used in order to label the point as a maximum or a
minimum depending on the sign of the second deriva-
tive at the point where the slope is 0. If the value is
less than 0 it is a local maximum. If it is greater than
0 it is a local minimum.
2.4.2 Automatic Creation of Lumbar Flexion
Test Phases based on Local Maximums
and Minimums
The algorithm automatically create phases based on
the list of local maximums and minimums. It tests
if appear first a maximum or minimum in IMUs sig-
nal. Depending on the result, it would start conca-
tenating maximums and minimums points, until there
are n number of maximum and minimum pairs, repre-
senting n different phases.
Only phases where the angle variation is signifi-
cant are preferred. For making the algorithm robust
when facing little angle variations, a threshold is app-
lied in order to discard phases where this variation is
not significant. This threshold is computed using the
three greater angle variations, represented as a
i
where
a
i
> a
i+1
> a
i+2
, in the phases found as follows:
threshold =
a
1
+ a
2
+ a
3
3
(4)
This posture’s angle variation is also used to la-
bel the phases found by the algorithm. In a Flexion
phase, the posture’s angle variation is negative while
in an Extension phase it is positive. Maximum Volun-
tary Flexion (MVF) and Vertical phases are between
Flexion and Extension phases. If the phase is between
a Flexion and Extension phases then it is labeled as
MVF. On the other hand, if it is between an Extension
and Flexion phases, it is labeled as a Vertical phase.
The pseudocode for algorithm’s steps described in
subsections 2.4.1 and 2.4.2 is as follows:
obtain_smoothed_posture_signal(posture_signal)
get_indexes_local_maximums(smoothed signal)
get_indexes_local_minimums(smoothed signal)
if local_maximums[0] < local_minimums[0]:
for max_i,min_i in maximums,minimums:
create_new_phase(max_i,min_i)
compute_local_variation(new_phase)
if angle variation < 0:
label_phase_as_flexion(new_phase)
icSPORTS 2018 - 6th International Congress on Sport Sciences Research and Technology Support
36

else:
label_phase_as_extension(new_phase)
previous_phase_vector.add(new_phase)
else:
for max_i,min_i in maximums,minimums:
create_new_phase(min_i,max_i)
compute_local_variation(new_phase)
if angle variation < 0:
label_phase_as_flexion(new_phase)
else:
label_phase_as_extension(new_phase)
previous_phase_vector.add(new_phase)
compute_threshold(previous_phases_vector)
for phase in previous_phases_vector:
if phase[angle variation] > threshold:
final_phases_vector.add(phase)
add_MVF_and_vertical_phases(final_phases_vector)
2.5 Computation of Ratios between
Phases
During the execution of the LFT test, the muscles
are normally subject to an important level of activity
and stress. To monitor the electrical activity produ-
ced by the skeletal muscles a wearable electromyo-
graphy or EMG sensor is used. This sensor consists
of a set of surface electrodes, which are attached to
the skin of the body part to be monitored. The elec-
trodes measure the potential difference between them,
which is translated by the sensor into EMG signals.
There exist some well-known metrics that help cate-
gorize the level of the muscle fatigue. The root mean
square (RMS) and the maximum voluntary muscle
contraction (MVC) are generally used as indices of
muscle fatigue. (Al Zaman et al., 2007) (Kim et al.,
2007). RMS and MVC can be computed as follows:
RMS =
s
∑
N
k=1
EMG
2
(k)
N
(5)
MVC = max(EMG) (6)
RMS is computed for each phase found by the al-
gorithm and it is normalize by the maximum histo-
rical MVC of the patient. RMS is normalize by the
MVC as follows:
RMSnormalized =
RMS
MVC
∗ 100 (7)
RMS ratios between Flexion and Extension pha-
ses and MVF and Vertical phases have been proved
as good discriminators between healthy and LBP pa-
tients (Watson et al., 1997)(S
´
anchez-Zuriaga et al.,
2015)(Neblett et al., 2013). Ratios are computed bet-
ween phases. The mean and standard deviation from
all repetitions ratios is obtained.
The pseudocode for the computation of ratios be-
tween phases by the algorithm is as follows:
for phase in final_phases_vector:
get_RMS_normalized_by_MVC(phase)
compute_flexion_mvf_ratios(phases)
compute_extension_mvf_ratios(phases)
get_mean_flexion_mvf_ratios(flexion_mvf_ratios)
get_mean_extension_mvf_ratios(extension_mvf_ratios)
3 RESULTS
Flexion/MVF and Extesion/MVF are the main ratios
of interests for discriminate between healthy and LBP
athletes. In MVF phase is where the FRP occurs.
Therefore much greater ratios’ values must be obtai-
ned in healthy athletes than in LBP athletes.
Athletes diagnosed with LBP showed ratios lower
than 1.5. For healthy participants we observed results
greater than 1.5. Results are showed in Table 2.
Table 2: Mean and standard deviation of ratios between
phases in healthy and LBP athletes.
Flexion/MVF Extension/MVF
LBP Athletes 1.22 ± 0.33 1.58 ± 0.28
Healthy Athletes 3.07 ± 0.67 6.10 ± 0.96
4 DISCUSSION
Following the aim of developing a quantitative met-
hod for monitoring LBP athletes, we saw an evident
threshold to discriminate between athletes with LBP
and healthy.
Our results are enclosed in the same rates as those
found in literature, both for healthy and LBP partici-
pants. (Watson et al., 1997) , (Alschuler et al., 2009)
and (Neblett et al., 2013) showed similar results. A
comparison of our results with the one presented in
(Watson et al., 1997), (Alschuler et al., 2009) and
(Neblett et al., 2013) can be observed in Tables 3 and
4. Our results prove the validity of the algorithm com-
paring our results with those found in literature.
A Novel Automated Algorithm for Computing Lumbar Flexion Test Ratios Enhancing Athletes Objective Assessment of Low Back Pain
37

Table 3: Comparison of our results with those found in lite-
rature for Flexion/MVF ratios in healthy patients.
Flexion/MVF
Our results 3.07 ± 0.67
(Watson et al., 1997) 13.98 ± 11
(Neblett et al., 2013) 15.1 ± 7.7
Table 4: Comparison of our results with those found in lite-
rature for Flexion/MVF ratios in LBP patients.
Flexion/MVF
Our results 1.22 ± 0.33
(Watson et al., 1997) 2.72 ± 2.7
(Alschuler et al., 2009) 0.19 ± 0.47
5 CONCLUSION
Our algorithm helps automate the evaluation of the
athletes without any knowledge of sEMG nor of LFT
and our results agree with other studies. Our results
prove the validity of the algorithm for computing ra-
tios based on those presented in literature. This tool
would help sport specialists to evaluate their sports-
men and observe an objective progress over their re-
habilitation with little preprocessing that can be per-
formed with sEMG analysis software (Banos et al.,
2015).
Our algorithm could increase the objective asses-
sment during the sportsmen injury time as well as
a tool during injury free periods to evaluate if LBP
could be a plausible consequence of an overload trai-
ning. Automatically computed ratios can served as a
guide to perform changes in the recovery plan, decre-
asing injury’s time.
REFERENCES
(2017). Low Back Pain Fact Sheet. National Institute of
Neurological Disorders and Stroke.
Al Zaman, A., Sharmin, T., Khan, M. A. A., and Ferdjallah,
M. (2007). Muscle fatigue analysis in young adults
at different mvc levels using emg metrics. In Sout-
heastCon, 2007. Proceedings. IEEE, pages 390–394.
IEEE.
Alschuler, K. N., Neblett, R., Wiggert, E., Haig, A. J.,
and Geisser, M. E. (2009). Flexion-relaxation and
clinical features associated with chronic low back
pain: a comparison of different methods of quanti-
fying flexion-relaxation. The Clinical journal of pain,
25(9):760–766.
Banos, O., Damas, M., Pomares, H., Prieto, A., and Ro-
jas, I. (2012). Daily living activity recognition based
on statistical feature quality group selection. Expert
Systems with Applications, 39(9):8013–8021.
Banos, O., Damas, M., Pomares, H., Rojas, F., Delgado-
Marquez, B., and Valenzuela, O. (2013). Human acti-
vity recognition based on a sensor weighting hierar-
chical classifier. Soft Computing, 17(2):333–343.
Banos, O., Moral-Munoz, J. A., Diaz-Reyes, I., Arroyo-
Morales, M., Damas, M., Herrera-Viedma, E., Hong,
C. S., Lee, S., Pomares, H., Rojas, I., et al. (2015).
mdurance: a novel mobile health system to support
trunk endurance assessment. Sensors, 15(6):13159–
13183.
Banos, O., Toth, M. A., Damas, M., Pomares, H., and Ro-
jas, I. (2014). Dealing with the effects of sensor dis-
placement in wearable activity recognition. Sensors,
14(6):9995–10023.
Colloca, C. J. and Hinrichs, R. N. (2005). The biomechani-
cal and clinical significance of the lumbar erector spi-
nae flexion-relaxation phenomenon: a review of lite-
rature. Journal of Manipulative & Physiological Ther-
apeutics, 28(8):623–631.
Desai, H. S. and Bisen, R. S. (2017). Lumbar flexion re-
laxation phenomenon in the patients with acute and
subacute mechanical low back pain and normal sub-
jects. International Journal of Research in Medical
Sciences, 5(3):1011–1014.
Harrison, H. (1999). Quaternions and rotation sequences: a
primer with applications to orbits, aerospace and vir-
tual reality, kuipers jb, princeton university press, 41
william street, princeton, nj 08540, usa. 1999. 372pp.
illustrated.£ 35.00. isbn 0-691-05872-5. The Aeronau-
tical Journal, 103(1021):175–175.
Kim, G., Ahad, M. A., Ferdjallah, M., and Harris, G. F.
(2007). Correlation of muscle fatigue indices between
intramuscular and surface emg signals. In Southeast-
Con, 2007. Proceedings. IEEE, pages 378–382. IEEE.
Kujala, U. M., Salminen, J. J., Taimela, S., Oksanen, A.,
and Jaakkola, L. (1992). Subject characteristics and
low back pain in young athletes and nonathletes. Me-
dicine and science in sports and exercise, 24(6):627–
632.
Lin, H.-C., Chiang, S.-Y., Lee, K., and Kan, Y.-C. (2015).
An activity recognition model using inertial sensor no-
des in a wireless sensor network for frozen shoulder
rehabilitation exercises. Sensors, 15(1):2181–2204.
Luinge, H. J., Veltink, P. H., and Baten, C. T. (2007). Am-
bulatory measurement of arm orientation. Journal of
biomechanics, 40(1):78–85.
Madgwick, S. O., Harrison, A. J., and Vaidyanathan, R.
(2011). Estimation of imu and marg orientation using
a gradient descent algorithm. In Rehabilitation Ro-
botics (ICORR), 2011 IEEE International Conference
on, pages 1–7. IEEE.
Mannini, A., Intille, S. S., Rosenberger, M., Sabatini,
A. M., and Haskell, W. (2013). Activity recogni-
tion using a single accelerometer placed at the wrist
or ankle. Medicine and science in sports and exercise,
45(11):2193.
Neblett, R., Brede, E., Mayer, T. G., and Gatchel, R. J.
(2013). What is the best surface emg measure of lum-
bar flexion-relaxation for distinguishing chronic low
back pain patients from pain-free controls? The Cli-
nical journal of pain, 29(4):334.
icSPORTS 2018 - 6th International Congress on Sport Sciences Research and Technology Support
38

Roetenberg, D., Luinge, H. J., Baten, C. T., and Vel-
tink, P. H. (2005). Compensation of magnetic dis-
turbances improves inertial and magnetic sensing of
human body segment orientation. IEEE Transacti-
ons on neural systems and rehabilitation engineering,
13(3):395–405.
S
´
anchez-Zuriaga, D., L
´
opez-Pascual, J., Garrido-Ja
´
en, D.,
and Garc
´
ıa-Mas, M. A. (2015). A comparison of lum-
bopelvic motion patterns and erector spinae behavior
between asymptomatic subjects and patients with re-
current low back pain during pain-free periods. Jour-
nal of Manipulative & Physiological Therapeutics,
38(2):130–137.
Savitzky, A. and Golay, M. J. (1964). Smoothing and diffe-
rentiation of data by simplified least squares procedu-
res. Analytical chemistry, 36(8):1627–1639.
Schmidt, C., Zwingenberger, S., Walther, A., Reuter, U.,
Kasten, P., Seifert, J., G
¨
unther, K.-P., and Stiehler, M.
(2014). Prevalence of low back pain in adolescent
athletes–an epidemiological investigation. Internati-
onal journal of sports medicine, 35(08):684–689.
Tabard, A., Dayer, R. O. P., Armand, S., and Vuillerme, N.
(2018). Flexion-relaxation phenomenon in children
and adolescents with and without nonspecific chronic
low back pain: An electromyographic and kinematic
cross-sectional comparative study. Spine.
Watson, P., Booker, C., Main, C., and Chen, A. (1997). Sur-
face electromyography in the identification of chronic
low back pain patients: the development of the flexion
relaxation ratio. Clinical Biomechanics, 12(3):165–
171.
Zhang, Z., Huang, Z., and Wu, J. (2010). Ambulatory hip
angle estimation using gaussian particle filter. Journal
of Signal Processing Systems, 58(3):341–357.
A Novel Automated Algorithm for Computing Lumbar Flexion Test Ratios Enhancing Athletes Objective Assessment of Low Back Pain
39
