
Method of Acute Alertness Level Evaluation after Exposure
to Blue and Red Light (based on EEG): Technical Aspects
Agnieszka Wolska
1
, Dariusz Sawicki
2
, Kamila Nowak
1
, Mariusz Wisełka
1
and Marcin Kołodziej
2
1
Central Institute for Labour Protection, National Research Institute (CIOP-PIB), Warsaw, Poland
2
Warsaw University of Technology, Institute of Theory of Electrical Engineering,
Measurement and Information Systems, Warsaw, Poland
Keywords: EEG, Acute Alertness, Exposure to Light, Evaluation Method, Technical Aspects.
Abstract: Since maintaining a high level of alertness is a very important factor on many workstations a number of
studies on alertness level evaluation have been carrying out. The effects of light exposure on alertness level
have been the subject of many studies with EEG registration, but technical aspects of planning experiment
are not well described. The aim of the article is to present the evaluation method of acute alertness level
after exposure to blue and red light based on EEG registration with special attention to technical aspects of
used methodology. The preliminary results obtained during the pilot study confirmed that elaborated
method fulfils our expectations and gives opportunity to assess the acute alertness after exposure to light.
1 INTRODUCTION
Light is one of the most important environmental
factors both for humans and all living organisms. It
is simply needed for life. It is able to affect physical,
physiological and psychological behaviors of
humans (Bellia et al., 2011). Light stimulus both
enables the vision and affects biological non-visual
effects. The existence of intrinsically photosensitive
retinal ganglion cell (ipRGc) containing the
melanopsin makes it possible to capture the non-
visual information of light and activate the circadian
system. Daily light/dark patterns reaching the retina
play an important role in regulating the circadian
rhythms (Figueiro, 2013). The non-visual response
to light depends on the light wavelength and
intensity (irradiance level at the eye), time and
duration of exposure. Light may affect human
behaviors in indirect or direct way. The indirect way
is thorough the circadian timing system, and the
response is mainly long-term, mediated by processes
such as: melatonin suppression, core body
temperature regulation, alertness and cognition
(Łaszewska et al., 2017, Chellappa et al., 2011,
Cajochen et al, 2007, 2010). This is why this non-
visual response is often named as circadian effect of
light.
Many studies showed that the effect of blue light
exposure had been stronger than white light. It is
explained by maximum sensitivity of ipRGc on short
wavelength visible radiation between 460 and 480
nm. The direct non-visual effect of light is non-
circadian, i.e. without circadian clock changes.
These effects could be acute and short term, not
exceeding the period of 24 h (Łaszewska et al.,
2017, Cajochen et al., 2007, Chellappa et al., 2011).
Since maintaining a high level of alertness is a very
important factor on many workstations and on night
shift workstations many studies of alertness level
evaluation have been conducted. The effects of light
exposure on alertness were the subject of numerous
electrophysiological studies (Łaszewska et al., 2017,
Figueiro et al., 2010, 2016, Sahin and Figueiro,
2013, Chang et al., 2013, Sahin et al., 2014, Phipps-
Nelson et al., 2009). However, a unified and
standardized method of carrying out the studies does
not exist. The differences in methodology concerns:
duration and daytime of exposure, intensity of light
and procedure of EEG registration (during or after
exposure to light, with or without behavioural
control).
There are also different methods of EEG signal
analysis to assess the alertness level, however the
Theta and Alpha bands are usually under
consideration. Most of studies examined the
influence of blue or white light on alerting response
Wolska, A., Sawicki, D., Nowak, K., Wisełka, M. and Kołodziej, M.
Method of Acute Alertness Level Evaluation after Exposure to Blue and Red Light (based on EEG): Technical Aspects.
DOI: 10.5220/0006922500530060
In Proceedings of the 6th International Congress on Neurotechnology, Electronics and Informatics (NEUROTECHNIX 2018), pages 53-60
ISBN: 978-989-758-326-1
Copyright © 2018 by SCITEPRESS – Science and Technology Publications, Lda. All rights reserved
53

on suppressing the melatonin level, but some recent
research indicated that also red light increases level
of alertness (Figueiro et al., 2009, Figueiro and Rea,
2010, 2017, Plitnick et al., 2010, Sahin and Figueiro,
2013, Okamoto et al., 2014, Łaszewska et al., 2017).
This results proved that alerting effect could be
obtained not only by suppressing the melatonin
level.
However, it is proved that blue and red light
could increase the alertness level, both during the
night and day but the duration of elicited alertness
after exposure to particular color of light still
remains not well known.
The aim of the article is to present the method of
acute alertness level evaluation after exposure to
blue and red light based on EEG registration with
special attention to technical aspects of used
methodology. Preliminary results obtained during
the pilot study are also presented.
2 TECHNICAL ASPECTS OF
EXPERIMENT –
EXPECTATIONS
2.1 Light Exposure
Lighting conditions play a very important role,
because the effect of exposure to light as an acute
change in alertness is observed. Since it has been
proven that exposure to red or blue light could
increase the alertness level, the verification of the
elaborated method in a pilot study should show if the
obtained results are in accordance with these
findings. The main assumption of light exposure for
planned pilot experiments was the application of two
monochromatic lights: blue light (max. emission
470 nm) and red light (max. emission 630 nm),
according to previous studies. This condition could
be realized by using electroluminescent diodes
(LEDs): blue LEDs and red LEDs respectively.
The next assumption was to obtain an
appropriate level of illuminance at the participant’s
eyes during the exposure to blue and red light.
According to the previous studies (Okamoto et al.,
2014, Figueiro and Rea, 2010, Sahin and Figueiro,
2013, Łaszewska et al., 2017) the illuminance at the
eyes of 40 lx both for blue and red light should be
enough to induce alerting effect observed in EEG.
This assumption should be fulfilled by specially
designed lamp with blue and red LED modules,
equipped with current control of luminous flux and
diffusor to eliminate possible discomfort glare. The
geometry of lamp position and participant’s eye
could be different. Usually, the lamp is positioned in
front of observer’s eye (Figueiro and Rea, 2010,
Sahin and Figueiro, 2013), or over the head
(suspended on the ceiling, not directly observed)
(Sawicki et al., 2016), or two lamps on the desktop
centered at 45 angle from midline aside of sightline
(Alkozei et al, 2016). The latter of the above
mentioned solutions was chosen for our study.
The next important aspect was to create the
reference lighting conditions – dim light, which are
usually realized as white general illumination of
illuminance at the eye below 5 lx (Sahin et al., 2014,
Plitnick et al., 2010, Cajochen, 2007, Figueiro et al.,
2016). This lighting condition, as a reference
lighting used for 30 minutes washout period before
exposure, was established as the next assumption for
the experiment.
2.2 EEG Registration
The choice of equipment for EEG registration
usually depends both on the aim of the planned
study and on equipment resources or financial
possibilities to buy a new equipment. In most
medical and research applications the equipment
allows for placing gelled (or dry) electrodes on the
scalp according to the International 10-20 system.
However, this kind of professional equipment is
relatively expensive. There are also low-cost
consumer electronic devices with proven correct
registration of EEG signals (like Emotiv Epoc).
They are simple to use, wireless devices, usually
equipped with saline electrodes, however the they
contain fewer electrodes than the standard EEG i.e.
the midline electrodes are missing. Therefore, as we
planned to carry out the analyses for the alertness
assessment, we chose the system with 32-electrodes
placed according to the 10-20 system (see 3.1 for
details) that included i.a. midline electrodes (Fz, Cz,
Pz, Oz).
2.3 User’s Centered Devices
EEG registration is very sensitive to different
physiological artefacts like blinking, yawning,
moving the head or the body. To avoid motion-
related artefacts it is worth using the chin support.
During 30 minutes of exposure to light the
participants must have open eyes. To avoid
unintentional closing of the eyes, it is recommended
to use a preview camera for eyes/face observation of
the participant by the person conducting the
experiment.
NEUROTECHNIX 2018 - 6th International Congress on Neurotechnology, Electronics and Informatics
54
2.4 Management and Synchronization
Taking into account the need to monitor and manage
the experiment during the whole session the test-
stand should be separated from the monitoring and
control stand.
The assumptions for management application
(software for management of the experiment) were
as follows: at the beginning of the experiment, enter
the participant's personal code only once and call up
the appropriate version of the experiment, perform
the following tests after confirmation by the
operator, counting out the exposure time.
For security reasons the stimuli delivery and
experiment management should be carried out on
separate computers.
3 TECHNICAL ASPECTS OF
EXPERIMENT –
IMPLEMENTATION
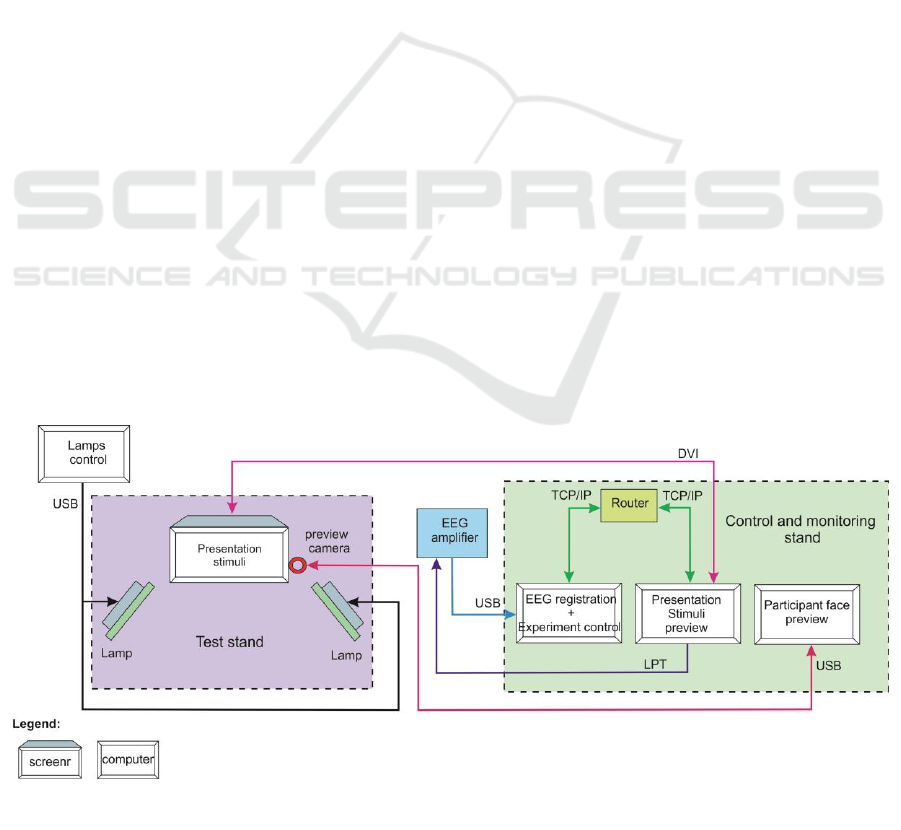
3.1 Stand for Experimental Tests
The stand for experimental tests for alertness level
assessment after exposure to different color of light
based on EEG registration was developed according
to the above mentioned assumptions. The
experimental stand consisted of two main sections:
test stand (where the participant performed
behavioral tests, and was exposed to particular
light of controlled parameters);
control and monitoring stand (where the
person conducting the test could observe the
stimuli presented on participant’s screen, EEG
signal during the recording and the
participant’s face during exposure to light).
The view of the stand for experimental test is
presented in Figure 1.
Raw EEG signal was continuously recorded from
32 Ag/AgCl active electrodes placed on a cap
according to the 10-20 International system using
256-channel g.Hlamp amplifier (Guger
Technologies, Graz, Austria). It was digitized at
sampling rate of 256 Hz. The ground electrode was
placed at Afz and the common reference electrode at
FCz. All impedances were kept below 30kΩ during
the whole recording session.
A Simulink model (running under Matlab 2014a)
was used to control the registration of the signal. It
consisted of the building block provided by the
manufacturer of the system (Guger Technologies,
Graz, Austria).
Presentation ® v.20.0 (Neurobehavioral Systems
Inc.) was installed on a separate computer for stimuli
presentation (see Figure 1). TCP/IP protocol was
used as it is a simple, stable and fast way to allow
communication and data exchange between two
computers (even with two different operational
systems). The Protocol used port 5000 to send and
acquire data (on server and client application
respectively) because it allows the application to
share data via TCP/IP protocol.
The registration of the resting state EEG (rsEEG)
was performed three times during the pilot study
experimental sessions. The delivery of fixation point
was presented on the screen in front of participant.
Another computer was dedicated to operate and
control two lamps (type MOL-02) for exposure to
red and blue light (manufactured by GL Optic
Poland). The lamps consisted of 2 red (630 nm) and
Figure 1: The experimental stand – the distributed and complex measurement and control system.
Method of Acute Alertness Level Evaluation after Exposure to Blue and Red Light (based on EEG): Technical Aspects
55

2 blue (465 nm) LED modules which were also
equipped with a diffusor (20x30 cm ) to reduce
luminance (to avoid direct glare). According to
Alkozei et al. (Alkozei et al., 2016) both lamps were
positioned at 80 cm distance measured at the
participant’s nasion, with each light cantered at a 45
degree angle from midline (see Figure 1). The
established illuminance level for exposure was 40 lx
both for red and blue light.
The computer software (management
application) was developed to control and
synchronize the experiment process in distributed
computer system. The management application was
written by the Authors in Matlab environment and
installed on the computer for EEG registration,
which played the role of server. The computer with
Presentation software, played the role of the client.
The management application “led” the experimental
session from the first to the last test, including 30
minutes of exposure time countdown. The main
programing difficulty encountered during designing
the management application was the incompatibility
of two software environments (Matlab and
Presentation). To solve this problem a third party
program was developed in C# as the application
connecting both environments. Since the control
panel of g.Tech was created in Simulink (Matlab’s
environment) it was self-explanatory to create the
optimal Matlab script to control the preview of both
the experimental trigger and the EEG signal. Matlab
is also able to work as a data server, and in this case
the data was used to trigger the next step of the
experiment, which allowed the Authors to create
optimal control environment. Main function of the
software consisted of three major parts. In the first
part the user was prompted to fill in the information
about the current experiment subject. The second
part worked as a server code that established the
communication between two computers. Third part
was the control over g.Tech Simulink model such as
starting data acquisition, saving files, controlling
proper naming and stopping Simulink. It is
important to mark that the first part was filled only
once at the beginning of the experiment. The second
and the third part were working in one loop.
3.2 Management Application for the
Experiment
This tool has two roles. The first role was to send a
data request to the server. The second role, if the
data was available (server enabled), was to send the
trigger information to the virtual COM port, where
Presentation software awaited information. The
program is written in C# and is NET 4.0-compatible,
supported by Windows XP. Windows XP was used
as the computer operating system with a
motherboard supplied with LPT port, through which
the event data was added to signal in g.Tech
amplifier.
The last part of the management application was
a script written in Presentation. Its main purpose was
to conduct, control as well as store the data about the
current experiment. This script was written as a set
of steps divided into parts.
Each subsequent part of the test was started by a
trigger that appeared on the virtual COM port
created on a computer. After being informed that the
subject agreed to the start of the next task, the test
continued.
4 PILOT STUDY PROTOCOL
The aim of pilot study was to evaluate the developed
methodology both from a technical point of view
and to check whether the results of alertness level
obtained after the exposure to blue and red light
confirm previous studies that this color of light
could elicit the alertness level during the day. It was
also important to investigate the correctness of
control in a complex measuring system (effective
and convenient), and work comfort of the
participant.
The protocol was approved by the Senate
Committee of Research Ethics of Józef Piłsudski
University of Physical Education in Warsaw. All
participant gave their written informed consent prior
to the study.
4.1 Participants
The pilot study was carried out during the winter
season. The participants were 10 young, healthy men
aged between 21-30 years old (mean age:
23,63±2,64 years old). All participants met the
following criteria: did not report of any physical or
mental health problems, did not suffer from color
blindness, did not use glasses to work with a
computer, did not use any medication and did not
have problems with sleep. According to the
chronotype identified using Composite Scale of
Morningness – CSM (Smith et al., 1989, Jankowski,
2015) the participants started the experiment session
respectively at 7:30 am (morning chronotype) or at
11:00 am (evening chronotype), similarly to the
study of Maierova (Maierova et al., 2016). The
participants were asked to maintain a fixed regular
NEUROTECHNIX 2018 - 6th International Congress on Neurotechnology, Electronics and Informatics
56

plan sleep, lasting at least 7 hours during the week
preceding the start of the experiment. Every
participant took part in two experiments, each with
exposure to different light. The session order was
counterbalanced for each individual, to avoid the
impact of familiarizing with the procedure on
results. One week interval between the experiments
was established.
4.2 Method
The experimental session started with filling in a
questionnaire for subjective assessment of the
participant’s wellbeing and checking his sleep diary
filled in during 7 days before experiment. The
participants were then prepared for EEG registration,
which included the use of a gel under the electrodes
to obtain proper impedance level in each electrode
(<30 kΩ). After that, the participants sat in dim light
condition for 30 minutes (wash out period). They
were then asked to place their chin on the chin
support and look at the screen in front of them at the
distance of 60 cm when the first resting state was
carried out. Plus symbol (“+”) was presented on the
screen for 3 minutes together with EEG registration.
After the first registration the exposure light was
switched on for 30 minutes of exposure. The
participants were asked to keep their eyes open
during that time, but the person conducting the
experiment was observing participants’ eyes on the
screen to see their face/eyes preview and to check if
they were not falling asleep. Just after the exposure
the second resting state together with EEG
registration was carried out for the next 3 minutes.
Then, the participants was asked to perform
psychomotor tasks: N-back (0-back,1-back,-2back)
and Go-No-Go alternately, 3 times each. The order
of the presentation of the task was counterbalanced
across the subjects. The stimuli in the tasks were
presented with the Presentation ® v.20.0 software.
After that the third resting state was carried out. As a
result we obtain three EEG registrations of 3-
minutes each: one before the exposure (but after 30
minutes of dim light), second just after 30 minutes
of the exposure to red or blue light (acute alerting
effect) and third after 48 minutes after the exposure
and computer tests in dim light (sustained acute
alerting effect).
5 DATA ANALYSIS
The collected set of EEG signals was analyzed in
order to recognize the change in alertness level. The
initially prepared signal was divided into a set of 1s
fragments. Each fragment was analyzed by Fast
Fourier Transform giving energy in proper bands.
For one user the mean value for proper band was
calculated from a set of 1s fragments. In a typical
analysis of alertness, low bands (Theta, Alpha) are
registered from O1, O2, and Oz and sometimes from
neighboring electrodes. We wanted to simplify the
analysis in our pilot study and we assumed the use
of signal analysis from only one electrode located in
the center of the skull – Oz.
For most people during normal readiness state
(and with open eyes) the amplitudes of Theta waves
(4.5-8 Hz) and Alpha waves (8–12 Hz) are minimal.
Practically these waves do not exist in such
situation. This is confirmed by numerous
publications (Klimesch, 2012, Sahin and Figueiro,
2013, Okamoto et al., 2014, Baek and Min, 2015).
The main problem in analysis of EEG signals for
alertness recognition is individual differences
between the participants. Many researchers try to
remedy this problem by specific analysis. For
example, the Author of the paper (Chang et al.,
2013) analyzed the sum of Theta and Alpha bands in
order to cover a wide range of frequency.
The analysis was based on a new measure of
alertness (TAAT
max
) introduced in 2016 (Sawicki et
al., 2016). Using FFT we have prepared the
following bands: Theta (4-8 Hz), AlphaTheta (5-
9 Hz), AlphaLow (8-10 Hz), AlphaHigh (10-12 Hz)
and applied the formula (1):
TAAT
max
= max(DF
T
, DF
AL
, DF
AH
, DF
AT
) (1)
where DF
T
is the difference of power in Theta
band. This is calculated as energy before – energy
after. DF
AL
, DF
AH
, DF
AT
are the differences of
power in the AlphaLow, AlphaHigh and AlphaTheta
band respectively. Since the decrease in signal level
is correlated with an increase in alertness, the higher
the TAAT
max
, the higher the alertness level.
6 RESULTS AND DISCUSSION
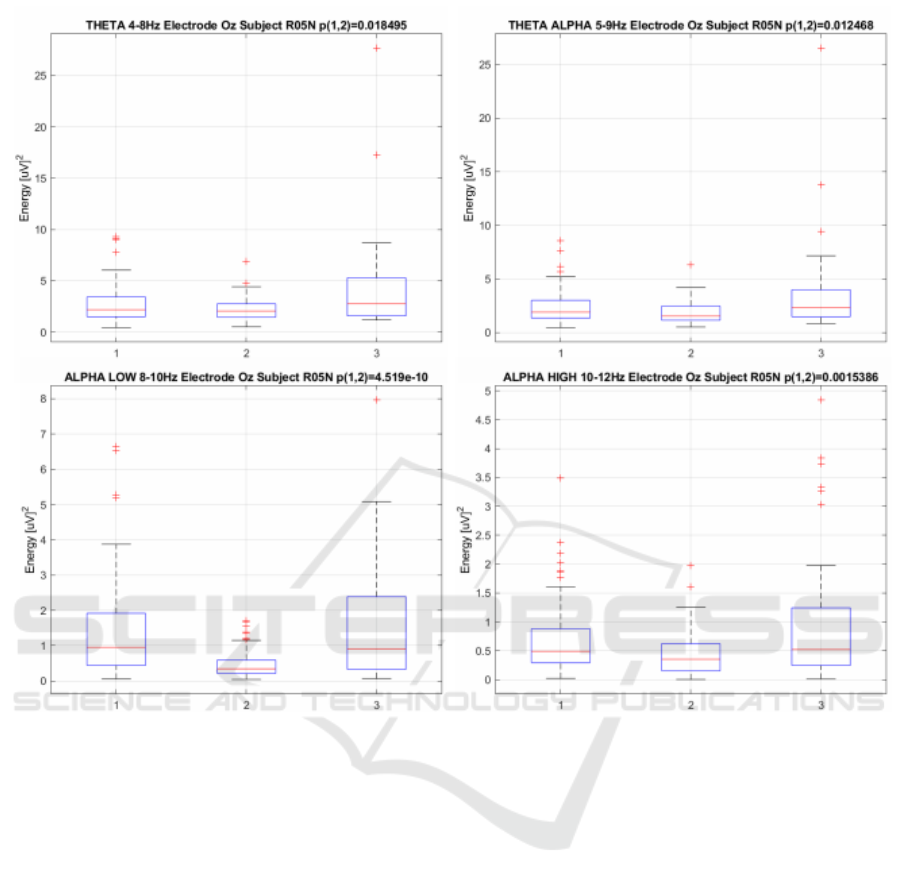
As expected, the highest impact on alertness was
observed in the use of blue light and it was clear in
the case of almost all participants. The typical box
plot for analyzed bands for one participant is
presented in Figure 2. We have also calculated
statistical significance between the first and the
second registration (1-2), which is in all considered
bands statistically significant p<0.05.
Method of Acute Alertness Level Evaluation after Exposure to Blue and Red Light (based on EEG): Technical Aspects
57
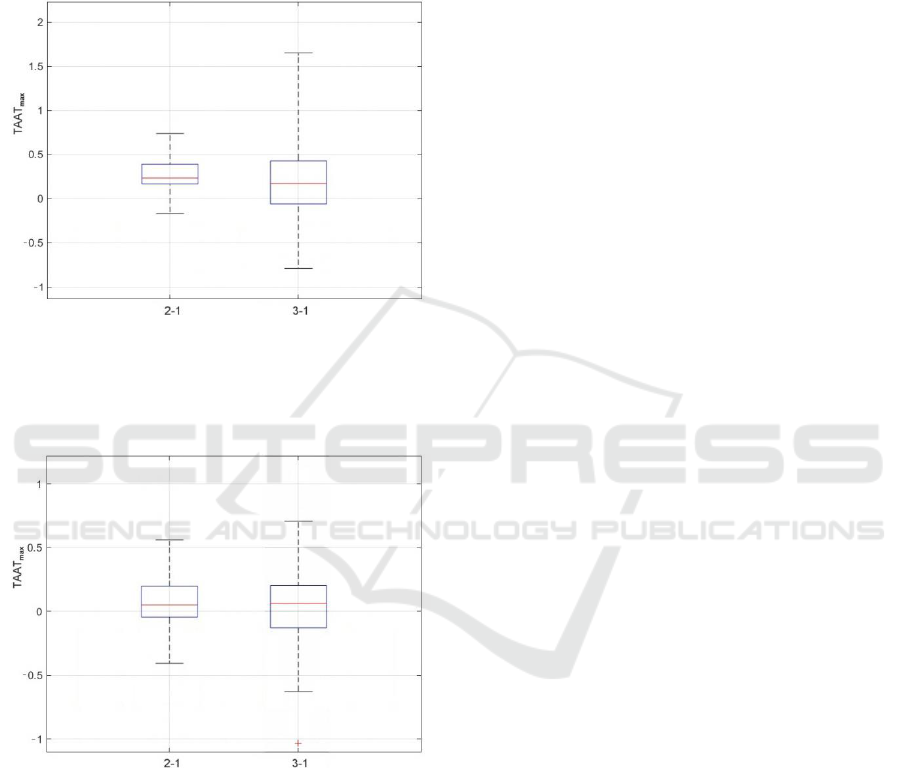
The TAAT
max
measure for all participants was
calculated to assess the differences between two
states: after the exposure to light in relation to the
state before the exposure (acute alerting effect), and
after a period of performing computer tests
following the exposure to light in relation to the state
before the exposure (sustained acute alerting effect).
The calculated TAAT
max
measures showing the
impact of blue and red light on alertness level are
presented in Figures 3 and 4, respectively.
There is a visible impact of blue light exposure
on the increase in acute alertness level in the first
period after the exposure (Figure 3). After 45
minutes of performing computer tests following the
exposure the impact on alertness level was weaker.
The acute alertness level seems to decrease with
time. It could be related to mental tiredness of
participants performing the computer psychomotor
tasks.
In the use of red light (Figure 4) the impact was
not so clear in the case of all participants, but the
tendency of increasing the alertness was visible.
These results for exposure to both blue and red light
influencing the alertness level are consistent with
previous results, which introduced TAAT
max
as a
new measure of alertness (Sawicki et al., 2016).
Although the number of the participants was small,
the results obtained so far suggest that the applied
methodology and the experimental setup is
appropriate. More subjects of both chronotype is
needed to draw more reliable conclusions.
First of all the methodology meets our
expectations and provides an opportunity to assess
the acute alertness after the exposure to light. Our
results confirmed previous studies concerning
alerting effect of blue and red light (Figueiro et al.,
2016, Figuerio and Rea, 2010, Chang et al., 2013,
Sahin and Figueiro, 2013, Łaszewska et al., 2017,
Figure 2: An example of box plots for participant R05N. Box plots of energy value in bands: Theta, AlphaTheta, AlphaLow,
AlphaHigh. Energy is presented in three measure points: (1) before the exposure to blue light, (2) just after the exposure to
blue light, (3) after a period of performing computer tests following the exposure to blue light.
NEUROTECHNIX 2018 - 6th International Congress on Neurotechnology, Electronics and Informatics
58
Sawicki et al., 2016). Interview with the participants
after the experiments confirmed that work stand
provided them with comfort during the experimental
session. In the opinion of participants and Authors
this was a valuable contribution to minimizing the
impact of discomfort-related factors on the obtained
results.
Figure 3: Impact of blue light exposure on the alertness
level. Box plots of TAAT
max
for two states: (2-1) after the
exposure, (3-1) after performing computer tests. The
higher the TAAT
max
, the higher the level of alertness
(Sawicki et al., 2016)
Figure 4: Impact of red light exposure on the alertness
level. Box plots of TAAT
max
for two states: (2-1) after the
exposure, (3-1) after performing computer tests. The
higher the TAAT
max
, the higher the level of alertness
(Sawicki et al., 2016).
The second important result of the pilot study
was the confirmation that Author’s management
application (software for experiment management)
meets the requirements in various real working
conditions. It was particularly important to confirm
the correctness of data transmission between two
different operating systems and the synchronization
of the entire registration process. At the same time
the experiments showed that the applied solutions
allowed for simple and effective control of the
experiment. In addition, some programming errors
were detected and corrected during the pilot study.
7 CONCLUSIONS
Various research studies on the influence of lighting
parameters on human wellbeing psychophysiology
of vision and visual ergonomics have been the
subject of research carried out by the Authors of this
article for many years. The long-standing experience
in conducting the experiments with participants has
showed that developing a proper work stand and
procedure constitutes a big, self-contained and
difficult problem. Studies on the influence of light
on alertness level usually described in detail the
conditions and procedure of exposure, while the
technical aspects of experimental stand and
management were omitted. Reading the articles, we
believe that the described experimental conditions
and procedures may be easy to reproduce, but
sometimes surprisingly difficult or impossible to
perform.
Construction of a complex experimental stand
with EEG registration can be a difficult task,
especially when IT problems play an important role.
There may be a complex measurement system
controlled by heterogeneous software. With this in
mind, the Authors of this article wanted to share
their knowledge and experience in planning this type
of study, and believe that the technical aspects that
were described could be useful for those scientists,
who would like to analyze influence of light on
alertness level based on EEG recording in the future.
ACKNOWLEDGEMENTS
This paper has been based on the results of a
research task carried out within the scope of the
fourth stage of the National Programme
"Improvement of safety and working conditions"
partly supported in 2017–2019 --- within the scope
of research and development --- by the Ministry of
Science and Higher Education / National Centre for
Research and Development. The Central Institute for
Labour Protection -- National Research Institute
(CIOP-PIB) is the Programme's main co-ordinator.
Method of Acute Alertness Level Evaluation after Exposure to Blue and Red Light (based on EEG): Technical Aspects
59

REFERENCES
Alkozei A., Smith R., Pisner D.A, Vanuk J.R, Berryhill
S.M, Fridman A., Shane B.R., Knight S.A., Killgore
W.D.S., 2016. Exposure to blue light increases
subsequent functional activation of the prefrontal
cortex during performance of a working memory task.
Sleep, 39 (9), 1671-1680. https://doi.org/10.5665/
sleep.6090
Baek, H. Min, B.K., 2015. Blue light aids in coping with
the post-lunch dip: an EEG study. Ergonomics, 58 (5),
803-810.
Bellia L., Bisegna F., Spada G., 2011. Lighting in indoor
environments: Visual and non-visual effects of light
sources with different spectral power distributions.
Build Environ 46, 1984-1992. https://doi.org/10.1016/
j.buildenv.2011.04.007
Cajochen C., 2007. Alerting effects of light. Sleep Med
Rev., 11, 453-464.
Cajochen C., Chellappa S., Schmidt C., 2010. What keeps
us awake? The role of clocks and hourglasses, light,
and melatonin. Int Rev Neurobiol, 93, 57-90.
Chang A.M., Scheer F.A.J, Czeisler C.A., Aeschbach D.,
2013. Direct effects of light o alertness, vigilance, and
the waking electroencephalogram in humans depend
on prior light history. Sleep, 36 (8), 1239-1246.
Chellappa S.L., Steiner R., Blattner P., Oelhafen P., Gotz
T., Cajochen C., 2011. Non-visual effects of light on
melatonin, alertness and cognitive performance: can
blue enriched light keep us alert? PLoS One, 6,
e16429.
Figueiro M.G., 2013. Non-Visual Lighting Effects and
Their Impact on Health and Well-Being. In
Encyclopedia of Color Science and Technology.
Springer Science+Business Media New York doi:
10.1007/978-3-642-27851-8_118-4, 1-11.
Figueiro M.G., Bierman A., Plitnick B., Rea M.S., 2009.
Preliminary evidence that both blue and red light can
induce alertness at night. BMC Neurosci, 10. 10:105.
https://doi.org/10.1186/1471-2202-10-105
Figueiro M.G., Rea M.S., 2010. The effects of red and
blue light on circadian variations in cortisol, alpha
amylase and melatonin. Int J Endocrinol., Volume
2010, Article ID 829351, 9 pages, https://doi.org/
10.1155/2010/829351
Figueiro M.G., Rea M.S., 2017. Quantifying circadian
light and its impact. Architectural lighting
http://www.archlighting.com/technology/quantifying-
circadian-light-and-its-impact_o (retrieved 018/04/02).
Figueiro M.G., Sahin, L., Wood, B., Plitnick, B., 2016.
Light at night and measures of alertness and
performance: implications for shift workers. Biol Res
Nurs.. 18 (1), 90-100. https://doi.org/10.1177/
1099800415572873
Jankowski K.S., 2015. Composite Scale of Morningness:
psychometric properties, validity with Munich
ChronoType Questionnare and age/sex differences in
Poland. Eur Psychiatry, 30, 166-171.
Klimesch W., 2012. Alpha-band oscillations, attention,
and controlled access to stored information. Trends
Cogn Sci. 16 (12), 606-617.
Łaszewska K., Goroncy A., Weber P., Pracki T., Tafil-
Klawe M., Pracka D., Złomańczuk P., 2017. Daytime
acute non-visual alerting response in brain activity
occurs as a result of short- and long wavelengths of
light. Journal of psychophysiology. https://doi.org/
10.1027/0269-8803/a000199
Maierova L., Borisuit A., Scartezzini J.L., Jaeggi S.M.,
Schmidt C., Münch M., 2016. Diurnal variations of
hormonal secretion, alertness and cognition in extreme
chronotypes under different lighting conditions.
Nature. Scientific Reports, 1-10. https://doi.org/
10.1038/srep33591
Okamoto Y., Rea M.S., Figueiro M.G., 2014. Temporal
dynamics of EEG activity during short and long
wavelength light exposures in the early morning. BMC
Res Notes, 7: 113, 1-6.
Phipps-Nelson J., Redman J.R., Schlangen L.J.,
Rajaratnam S.M., 2009. Blue light exposure reduces
objective measures of sleepiness during prolonged
night time performance. Chronobiol Int. 26 (5), 891-
912. doi: 10.1080/07420520903044364.
Plitnick B., Figueiro M.G., Wood B., Rea M.S., 2010. The
effects of red and blue light on alertness and mood at
night. Lighting Res. Technol, 42 (4), 449-458.
https://doi.org/10.1177/1477153509360887
Sahin L. and Figueiro M.G., 2013. Alerting effects of
short-wavelength (blue) and long – wavelengths (red)
lights in the afternoon. Physiol Behav. 116-117 (5), 1-
7. https://doi.org/10.1016/j.physbeh.2013.03.014
Sahin L., Wood B.M., Plitick B., Figueiro M.G., 2014.
Daytime light exposure: effects on biomarkers,
measure of alertness and performance. Behav Brain
Res. 274, 176-185. https://doi.org/10.1016/j.bbr. 2014.
08.017
Sawicki, D., Wolska, A., Rosłon, P., Ordysiński, S. 2016.
New EEG Measure of the Alertness Analyzed by
Emotiv EPOC in a Real Working Environment. In
Proc. of the 4th International Congress on
Neurotechnology, Electronics and Informatics,
NEUROTECHNIX 2016, Porto, Portugal, 7-8 Nov.
2016, 35-42. doi: 10.5220/0006041200350042
Smith C.S., Reilly C., Midkiff K., 1989. Evaluation of
three circadian rhythm questionnaires with suggestion
for an improved measure of morningness. J Appl
Psychol., 75, 728-738.
NEUROTECHNIX 2018 - 6th International Congress on Neurotechnology, Electronics and Informatics
60
