
Identifying Electromyography Sensor Placement using Dense Neural
Networks
Paolo Cappellari
1
, Robert Gaunt
2
, Carl Beringer
2
, Misagh Mansouri
2
and Massimiliano Novelli
2
1
College of Staten Island, City University of New York, U.S.A.
2
RNEL, University of Pittsburgh, Pittsburgh, U.S.A.
Keywords:
Neural Network, Machine Learning, Sensor Data, Predictive Modeling.
Abstract:
Neural networks are increasingly being used in medical settings to support medical practitioners and resear-
chers in performing their work. In the field of prosthetics for amputees, sensors can be used to monitor the
activity of remaining muscle and ultimately control prosthetic limbs. In this work, we present an approach to
identify the location of intramuscular electromyograph sensors percutaneously implanted in extrinsic muscles
of the forearm controlling the fingers and wrist during single digit movements. A major challenge is to con-
firm whether each sensor is placed in the targeted muscle, as this information can be critical in developing and
implementing control systems for prosthetic limbs. We propose an automated approach, based on artificial
neural networks, to identify the correct placement of an individual sensor. Our approach can provide feed-
back on each placed sensor, so researchers can validate the source of each signal before performing their data
analysis.
1 INTRODUCTION
Artificial neural networks (ANN) (LeCun et al., 2015)
are being used in many fields, including computer vi-
sion, speech/audio recognition, bio-informatics, etc.
Practical evidence gathered from ANN powered ap-
plications shows results that are comparable and often
better of those achievable by humans. For instance,
in the computer vision field, deep learning techniques
can accurately identify objects in pictures (Lin et al.,
2013; Szegedy et al., 2016); in natural language pro-
cessing, they are used for language modeling (Luong
et al., 2015; J
´
ozefowicz et al., 2016) to achieve speech
recognition, machine translation, part-of-speech tag-
ging, parsing, handwriting recognition, amongst other
applications.
Most of the work with ANNs focus on automatic
classification of images and textual data. There are
areas, however, where data are not immediately usa-
ble and/or represent very different underlying signals,
like in the medical domain. Some studies using deep
learning already exist in the medical domain, e.g. (Li-
ang and Hu, 2015; Rubin et al., 2017), and a number
of challenges, e.g. (Kaggle, 2014; Kaggle, 2015) have
been published to see how deep learning can help with
specific problems.
In the area of prosthetic limbs control for ampu-
tees, intramuscular electrodes could be used to record
the bioelectric activity from muscles in the residual
limb and in turn used to control the movement of
a prosthesis. These sensors record the electromyo-
graphy (EMG) activity in the set of muscles that
collaboratively contribute to the execution of a mo-
vement. In current commercial myoelectric systems,
EMG signals are acquired from just a few sensors on
the surface of the residual limb. One potential chal-
lenge in the design of advanced prostheses based on
fully implanted systems and intramuscular EMG is to
assess, from the immediate sensor readings, the iden-
tity of the specific muscle that a given sensor is re-
cording from. Given that in the forearm, for example,
there are approximately 28 muscles that control the
wrist and fingers and are often coactivated, it is not a
trivial task to simply identify the signature of a muscle
based on hand and wrist movements.
In this work, we present a neural network appro-
ach to identify which muscle a particular sensor is re-
cording from using noisy data where the validity of
the labelling is uncertain.
Paper Structure. The paper is structured as fol-
lows: in the remainder of this section, we discuss the
background and motivation for this research, the re-
search aims, and the contribution; in Sec. 2, we pre-
130
Cappellari, P., Gaunt, R., Beringer, C., Mansouri, M. and Novelli, M.
Identifying Electromyography Sensor Placement using Dense Neural Networks.
DOI: 10.5220/0006912501300141
In Proceedings of the 7th International Conference on Data Science, Technology and Applications (DATA 2018), pages 130-141
ISBN: 978-989-758-318-6
Copyright © 2018 by SCITEPRESS – Science and Technology Publications, Lda. All rights reserved

sent the related research; in Sec. 3, we provide de-
tails about the experimental setup, data collection and
the initial pre-processing of the acquired raw data; in
Sec. 4, we present a process to transform such raw
data into usable information for the neural network;
in Sec. 5, we describe the neural network architecture
and configuration; in Sec. 6 we detail our evaluations
and we discuss the results; and finally, in Sec. 7, we
draw our conclusions.
1.1 Background and Motivation
The loss of a limb can have significant effects that
place limitations on a person’s activities of daily
living. In many instances of limb loss however,
muscles remain in the residual limb that can be vo-
luntarily activated by attempting to move the missing
limb. For example, in the case of a wrist disarticula-
tion (hand missing at the wrist) or a transradial am-
putation (hand missing mid-forearm), nearly all the
muscles that control the wrist and fingers remain in-
tact.
This muscle activity can be monitored via elec-
tromyography (EMG). Briefly, when a muscle con-
tracts, it generates an electrical potential associated
with the flow of calcium ions in the muscle fibers. As
more fibers in a muscle are recruited, the amplitude
of this signal, after some simple signal processing, in-
creases. This electrical potential can be monitored by
a sensor (an electrode) either placed on the surface
of the skin over a muscle, or surgically placed into
the muscle itself. A single sensor, usually, monitors
a specific muscle, or part of it. Multiple sensors are
placed in multiple muscles to monitor the overall be-
havior of a limb, as limb movement is the result of the
activity of many muscles.
1.2 Research Aims
Positively identifying the muscle associated with a
specific sensor is not a trivial task. Consider the con-
trol of the hand: there are more than 20
1
muscles at
work in the forearm alone. The activity of many of
these muscles are highly correlated across many diffe-
rent coordinated movements, and producing isolated
activity of specific muscles is a very difficult for sub-
jects. This is especially true in amputees that may not
have attempted to move certain muscles for many ye-
ars. As a result, identifying the placement of an EMG
sensor can be a challenging and time-consuming task.
Misplacing a sensor may lead to changes in the out-
come of specific data analysis processes and ultima-
tely prosthesis control. The focus of this work is to
1
https://en.wikipedia.org/wiki/Forearm#Muscles
use a dense neural network to identify the relationship
between a specific sensor and the underlying muscle.
In short, we seek to label each sensor with the correct
muscle name. To accomplish this, we will use a data
set consisting of EMG and kinematic data collected
from a number of able-bodied individuals performing
structured hand and finger movements. Here, each
EMG sensor has been targeted to a specific muscle
under ultrasound guidance, but in certain cases we
know that these labels are incorrect, either due to elec-
trode migration or slight errors in targeting. The chal-
lenge is to validate each EMG signal, to capture any
mislabeling within the data collected during each ex-
periment, and provide a method to continually vali-
date the correctness of the labelling throughout the
experiment, given that the sensors can shift position
with muscle contraction.
1.3 Contribution
ANNs are capable of discovering and associating me-
aning to complicated and/or noisy data. During the
past number of years, ANNs have been used to iden-
tify patterns and trends that humans cannot (easily)
find, which make them a potentially ideal method to
identifying EMG sensor labels. Most of the existing
works that focus on recognizing movements by mo-
nitoring EMG signals assume that the monitoring de-
vice is properly configured and deployed. With this
work we make the following contributions:
• Automatic collection and enrichment of low level
sensor values with the experiment contextual in-
formation;
• A method for feature extraction of both EMG va-
lues of muscle activity patterns and kinematic me-
asurements of related movements, to succinctly
represent a rehabilitation session’s data;
• The automatic classification of sensor
(mis-)placement using an artificial neural
network.
This approach to sensor identification could have se-
veral benefits. First, it could reduce the time that re-
searchers or prosthetists require to identify a muscle
when setting up or programming a prosthetic control
system, and second, it could be used to automatically
track changes in the sensor locations that could occur
over time.
2 RELATED RESEARCH
Over the years, EMG signals have been used in many
diagnostic, research and rehabilitation applications.
Identifying Electromyography Sensor Placement using Dense Neural Networks
131

In particular surface EMG signals, that is signals re-
corded from skin surface, have been used in prosthe-
sis control (Khezri and Jahed, 2011; Chu et al., 2006;
Soares et al., 2003), analysis of functional electri-
cal stimulation (FES) (Kocyigit et al., 1996), human-
machine interaction (HCI) (Zazula et al., 1998), pat-
hological tremor analysis (Dideriksen et al., 2011),
and muscle fatigue analysis (Steens et al., 2012). The
main characteristic of surface EMG sensors, as op-
posed to intramuscular ones, is that are non-invasive
and thus easier to use in a broad range of applications.
On the other hand, surface sensors cannot be used to
monitor the activity of deep muscles as the electrical
activity of more superficial muscles always appears
larger in amplitude. Further, surface EMG sensors ty-
pically have low spatial resolution and cannot distin-
guish between the activity of even superficial muscles
that are immediately adjacent. Intramuscular sensors
are used to study single motor unit activity which is
necessary for analyzing neuropathies, such as myo-
pathes and diseases of neuromuscular junctions (Mer-
letti and Farina, 2009).
To date, there has been limited attention to the
challenges surrounding the identification of high-
density intramuscular sensors. In simple systems,
with just a few sensors, this issue is less problematic.
However, as intramuscular systems containing dozens
of electrodes are developed, addressing this issue be-
comes paramount. In (Kamavuako et al., 2011; Ka-
mavuako et al., 2012), authors build an ANN to es-
timate grasping force of a hand movement given the
EMG signals. In this work, the researchers break the
input EMG signals in contiguous chunks of 200 milli-
seconds to extract entropy values, which are then as-
sociated to the subject’s grasping force. Altogether,
these values are provided as input to train the ANN,
which can then estimate grasping force by just rea-
ding the EMG signals.
In (Matsumura et al., 2002), authors use an ANN
to recognize wrist movements/positions by analyzing
EMG signals. Signals are transposed into the fre-
quency domain by evaluating the Fast Fourier Trans-
form, which is then classified into a number of ca-
tegories representing possible positions of the wrist
(neutral, up and down, right and left, wrist to inside,
wrist to outside), achieving an accuracy ranging from
about 50% to 90%.
In (Gandolla et al., 2017), authors predict a set of
hand grasp movements by using a sequence of ANNs.
The approach processes 10 EMG signals simultane-
ously, with the goal of predicting the subject’s mo-
vement intention so to command a robotic hand. A
first network performs a subject’s specific clustering
on the input EMG signals. When the clustering de-
tects that more than one hand grasp task, then the out-
put of the first network is passed to a second ANN
that classifies hand grasp tasks within the cluster. The
results show an overall accuracy around 76%.
In (Atzori et al., 2016a) authors use convolutional
neural networks to classify more than 50 hand mo-
vements from EMG signals. Input signals are bro-
ken down into intervals so to achieve real-time cont-
rol of the prosthesis. Overall, the network was able to
achieve an accuracy ranging between 60-70%. Rese-
archers observed that the accuracy improves when the
class of movements to classify is reduced, reaching
the 90% when only 11 movements are considered, as
also noted by (Atzori et al., 2016b).
Other works, e.g. (Yang et al., 2017), extend on
the conventional rehabilitation setting by leveraging
the use of virtual reality so to provide patients with
a more familiar life-like scene, or tackle the issue of
develop a EMG controlled exoskeletons (Mulas et al.,
2005; Moital et al., 2015).
Finally, in (Karlik, 2014) authors provide a sur-
vey of the different machine learning approaches for
EMG signal characterizations, including ANNs. Aut-
hors briefly present the surveyed works, discussing
performance, pros and cons of each. While some of
these reports discuss the processing of EMG signals,
none of the approaches surveyed emphasize the cor-
rectness of the input EMG labels themselves, which
is the primary goal of this work, and one where com-
plexity scales as the number of sensors increases.
3 DATA ACQUISITION AND
ANALYSIS
This section describes the experimental setup used to
record raw data, the physical movements performed
by the subjects, and how the data are stored and ma-
nipulated to make it processable by an ANN.
3.1 Experimental Setup
All procedures described here were approved by the
Institutional Review Boards at the University of Pitts-
burgh and the Army Research Lab. Informed con-
sent was obtained from the participants prior to any
study procedures being performed. The experiments
and data collection sessions typically lasted 8 hours
and are briefly described here. At the beginning of the
experiment, a physician used ultrasound guidance to
place 16 fine-wire intramuscular EMG sensors (Mo-
tion Lab Systems, Baton Rouge, USA) into a set of
wrist and finger extrinsic hand muscles of the fore-
arm. Each sensor was labeled with a code represen-
DATA 2018 - 7th International Conference on Data Science, Technology and Applications
132
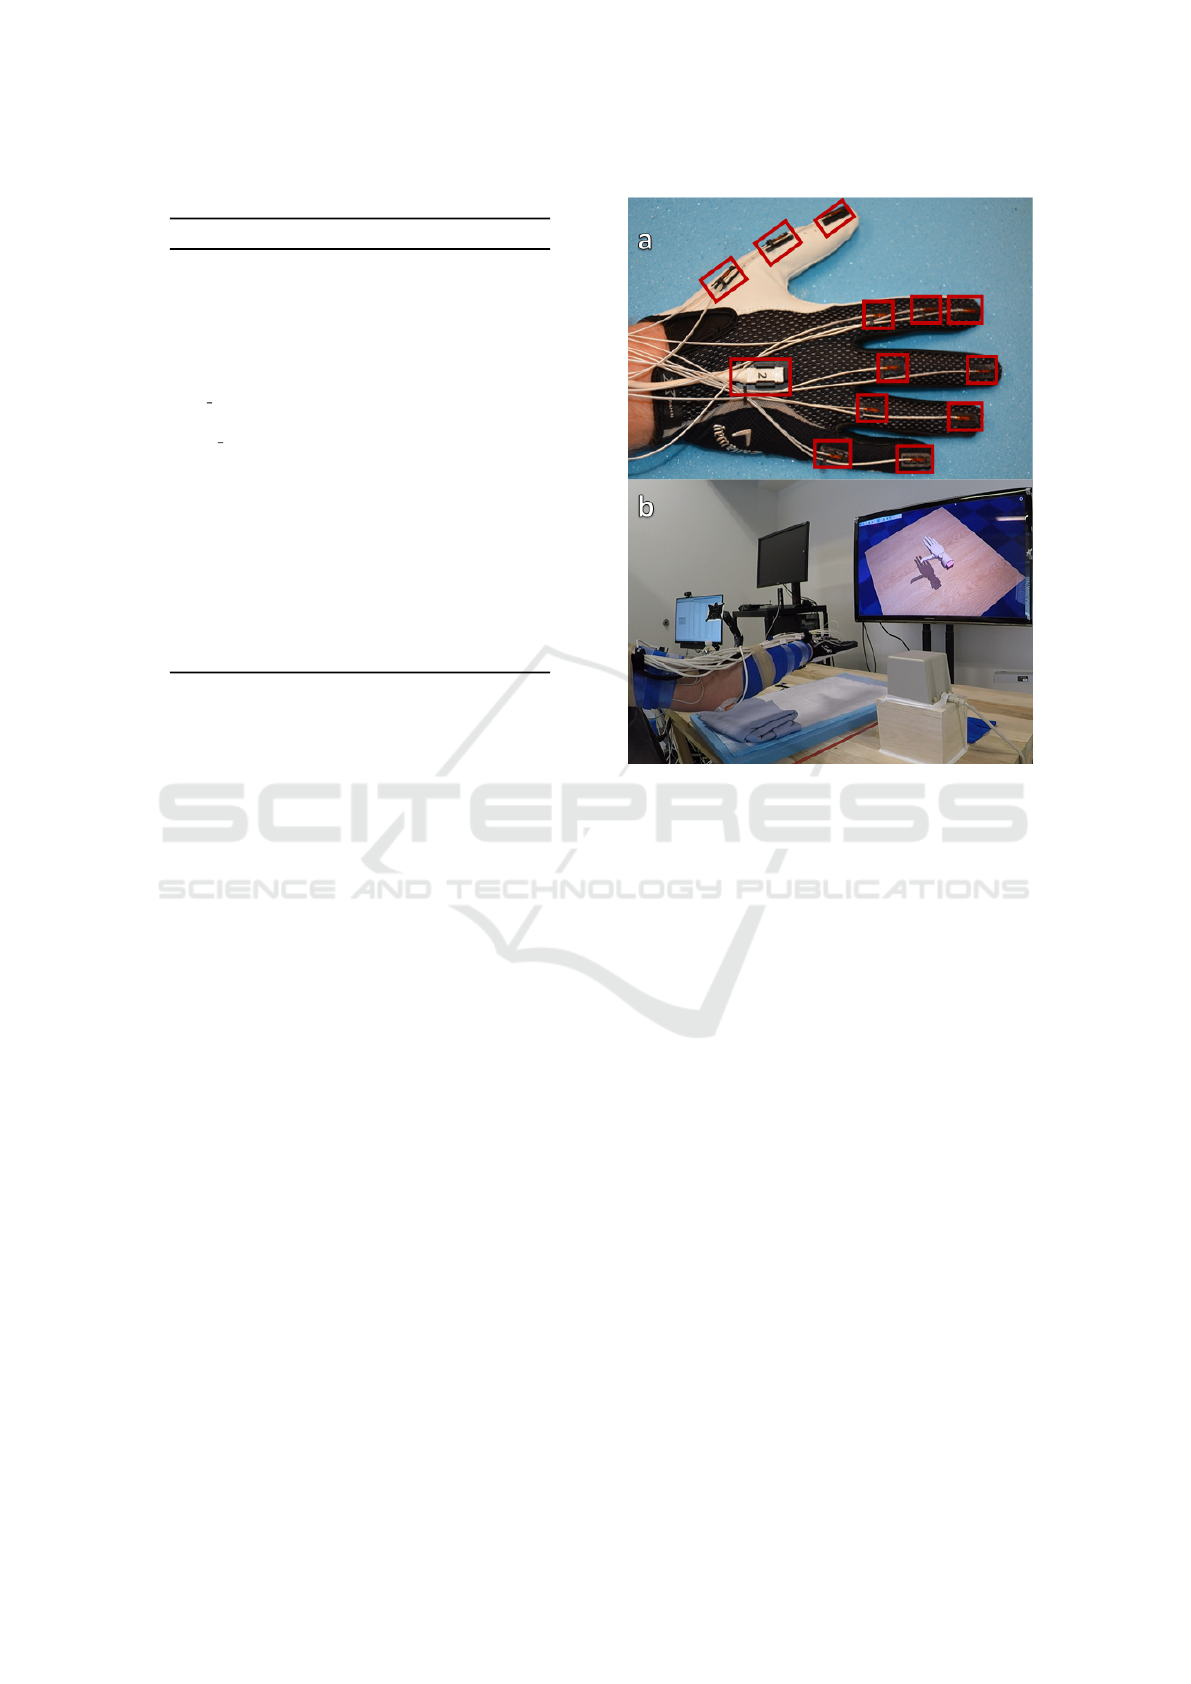
Table 1: Muscle names and associated labels.
Label Muscle name
FPL flexor pollicis longus
APL abductor pollicis longus
ED2 extensor digitorum index
ED3 extensor digitorum middle
ED4 extensor digitorum ring
ED5 extensor digitorum pinky
EIND extensor indicis
ED M extensor digit minimi
EPL extensor pollicis longus
ECR LO extensor carpi radialis longus
ECU extensor carpi ulnaris
FDS2 flexor digitorium superficialis index
FDP2 flexor digitorum profundus index
FDS3 flexor digitorium superficialis middle
FDP3 flexor digitorum profundus middle
FDS4 flexor digitorium superficialis ring
FDP4 flexor digitorum profundus ring
FCR flexor carpi radialis
FCU flexor carpi ulnaris
SUP supinator
PTER pronetor teres
ting the muscle that was targeted for implantation. Ta-
ble 1 shows the muscle codes used in our experiments.
Subjects were asked to execute specific mo-
vements while researchers tested electrical connecti-
ons, signal quality, and attempted to confirm sensors
location. Once the EMG sensor setup was valida-
ted, the forearm was wrapped with protective gauze
and the subject was asked to wear a glove that had
been instrumented with kinematics sensors (The Mo-
tion Monitor, Chicago, USA), as shown in Fig. 1(a).
The kinematic sensors enabled the tracking of all fin-
ger, thumb and wrist joint kinematics in 3D space.
The subjects were seated on a comfortable chair
and were able to rest their forearms on the table bet-
ween recordings. A wide screen television was placed
in front of the subjects where videos explaining the
type of movements were shown. The complete setup
can be seen in Fig. 1(b)
Subjects were asked to perform a variety of repe-
titive hand movements. During each movement EMG
and kinematic signals were recorded. Each recording
where data was acquired is called trial. The trials of
interest for the purpose of this paper are single joint
movement trials where the subject was asked to main-
tain a specific wrist posture (neutral, flexed, extended,
pronated, and supinated) and to move the selected fin-
ger in flexion and extension 10 times for the duration
of the trial as indicated by the video shown. Each sub-
ject was required to perform all the combinations be-
tween wrist positions and finger selected at the speed
of 1 movement per second, while only for some of
them a slower version (2 seconds per movement) were
Figure 1: Glove with embedded kinematics sensors (a).
Complete experimental setup (b).
collected due to time constrains. The duration of each
trial was set to allow the subject to complete 10 repe-
titions of flexion and extension at the requested speed.
For each trial, 2 data files were generated and saved:
one containing EMG signals and one with kinema-
tics signals. These signals were acquired on different
computers with EMG files containing 32 single-ended
signals, sampled at 30 kHz. Kinematics files included
23 hand joints relative positions, which were sampled
at 100.2 Hz.
3.2 Raw Data Storage
Once the experiment is completed, researchers trans-
fer EMG and kinematic data in their raw proprietary
format to a central disk storage, in a directory struc-
ture dedicated to the subject with all file names pro-
perly assigned for easy management. Once there, they
are converted to a more accessible format and impor-
ted in our data framework which allows fast retrieval
and has query capabilities. At this time the full raw
data for each trial is accessible to any lab member ha-
ving access rights for processing and analysis.
Identifying Electromyography Sensor Placement using Dense Neural Networks
133

4 DATA PREPARATION
In this section, we describe how we transform the re-
corded EMG and kinematic data into a representation
that captures relevant features of the signals and that
can be processed by a neural network. We perform the
following transformation steps: signal filtering, and
feature extraction.
4.1 Signal Filtering
EMG signals are typically transformed from their raw
state into a filtered representation prior to use in ana-
lysis or prosthesis control. As described in (Kamavu-
ako et al., 2009), to extract an estimate of muscle acti-
vation, we performed the following 3 filtering steps:
high pass filter at 100 Hz to remove motion artifacts,
rectify the signal (compute the absolute value of the
signal), and low pass filter at 10 Hz. Fig. 2 illustrates
the difference between EMG signals before (on left)
and after (on right) these filtering steps.
Kinematic signals are low-pass filtered at 10Hz.
These signals do not require additional frequency fil-
tering, as their wavelets are not noisy, see Fig. 3. Ne-
vertheless, we apply a smoothing filter to soften sig-
nals peaks and asperities.
In figure, it can be observed a flat kinematic acti-
vity at both the beginning and the end of the signals:
these are the intervals between the start of the signal
recording and the start of the actual articulation mo-
vement, and the between the end of the physical exer-
cise and the halt of the recording. We are interested at
the time window where the rehabilitation movement
occurs. Given the latencies of the system and the re-
sponse time of the subject, such window is not con-
stant across trials and subjects. To isolate the mo-
vement window, we have implemented an algorithm
to detect the beginning and the end of the movement
in the trials. This start/end times are calculated on
the kinematic signals, and applied to both EMG and
kinematic datasets to remove unnecessary data.
Briefly, the algorithm first finds the period of the
movement, then calculates the start and end times.
The period of each signal is calculated by transfor-
ming the signal in the frequency domain so to isolate
its harmonic with highest energy, which in this type of
trials is the frequency of the movement, from which
the signal period can be extracted. Periods from all
signals are aggregated and the median is computed to
calculate the value of the overall movement period.
The start/stop time of each input signal is calculated
as follows: (i) we find the peaks of the signal (in the
time domain), (ii) we extract the time at which the first
and last peaks occur, and (iii) we off-set the latter by
a quarter period in advance and in delay, respectively.
The start of the movement is considered to be the mi-
nimum value across all the start computed from the
kinematics signal, while the end is the max value be-
tween all the ends. During the process, some signals
do not report peaks so they are not included in this
computation.
4.2 Feature Extraction
In this section we describe how we encode EMG and
kinematic signals in a compact format that is both des-
criptive of the trial and processable by an ANN.
To prepare the continuous time EMG and kine-
matic data for the ANN, we extracted representative
and salient features from the input signals. The pri-
mary features chosen for this analysis were the cross-
correlations between the EMG signals and between
EMG and kinematic signals. All subjects performed
the same set of movements and we assume that the
time-varying patterns of muscular activity required to
produce these movements are similar. As a result,
we therefore assume that the cross-correlations bet-
ween muscle activations and kinematics contains uni-
que features that can be discovered by a neural net-
work when properly trained.
For each subject and trial, we calculated two dif-
ferent sets of cross-correlations. First, we calculated
the cross-correlation between each filtered EMG sig-
nal and all other filtered EMG signals, and second, we
calculated the cross-correlations between each filte-
red EMG signal and each filtered kinematic variable.
This simple feature extraction approach reduced the
multi-channel continuous time series data to a 16 by
38 matrix, consisting of 16 EMG signals and 16 EMG
signals plus 22 kinematic. Fig. 4 shows a heat map
representation of the subset of the correlation matrix
obtained from the EMG signals from a single trial,
where the red and white indicate high and low corre-
lation values, respectively.
5 SIGNAL CLASSIFICATION
MODELING
In the following section we detail the architecture of
the ANN; the rationale for the selection of the trai-
ning, validation and test data; and, the training of the
artificial neural network for our classification task.
5.1 Neural Network Architecture
After feature extraction, each trial can be represented
with a relatively small amount of data, representable
DATA 2018 - 7th International Conference on Data Science, Technology and Applications
134
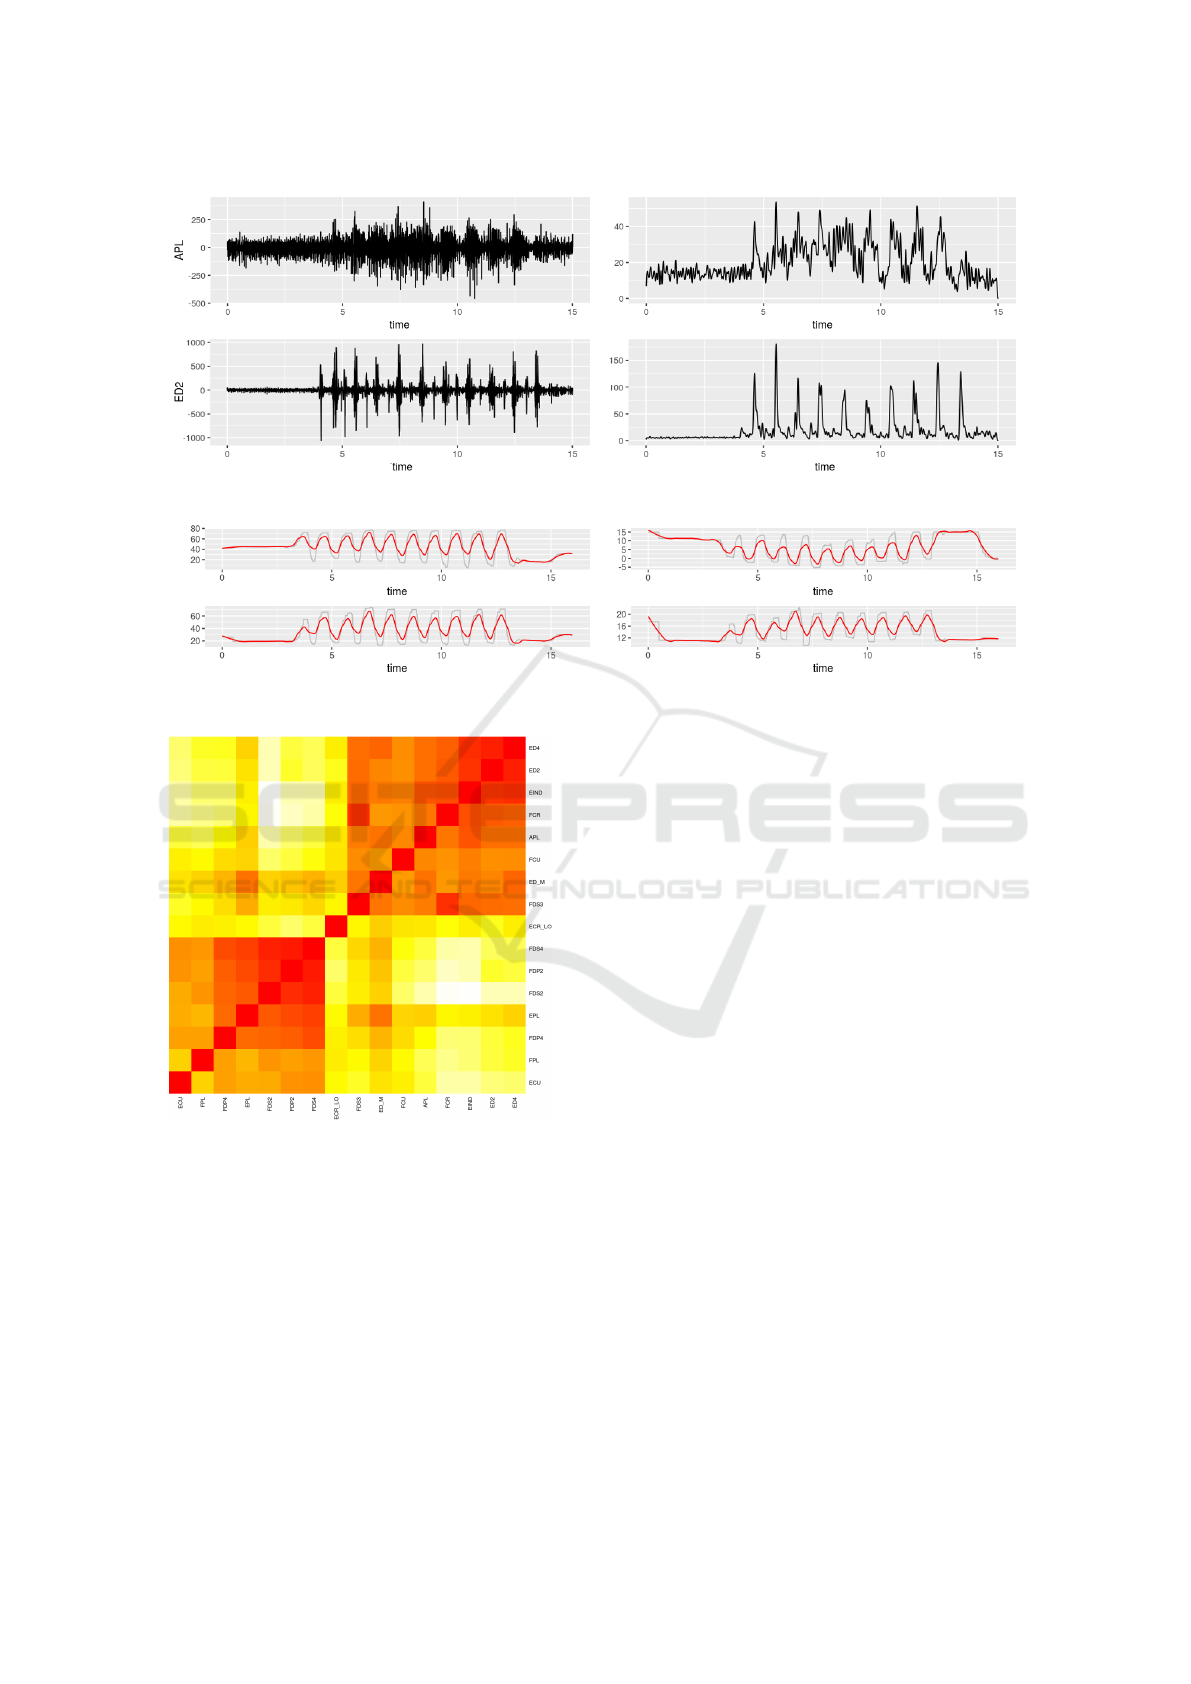
Figure 2: A sample of EMG signals for a few sensors before (on left) and after (on right) frequncy filtering.
Figure 3: A sample of kinematics signals for a few sensors.
Figure 4: Sample Heat map of correlation matrix between
data from all EMG sensors.
by the correlation matrix. In this matrix (or table), a
single trial consists of 16 rows (one for each EMG sig-
nal) and 38 columns describing the correlations of the
other EMG sensors and kinematic variables to each
EMG signals. Multiple trials are combined together
in the table by concatenating the matrices vertically to
form a table with 38 columns and a number of rows
equal to 16 multiplied by the number of trials. This
kind of input can be managed by a neural network
with a relatively simple neural network architecture,
in contrast to other approaches that use images thus
requiring deep neural networks, e.g. (Rubin et al.,
2017). Our neural network is a dense neural network
composed of the following layers:
• An input layer with 100 inputs, which correspond
the number of our features; activation is ReLU;
• 3 hidden layers completely interconnected of size
200, 300 and 200 neurons, with ReLU activation
function;
• The output layer with 21 neurons matching the la-
bels of the targeted muscle present in the raw data
with a softmax activation.
The output of our neural network is a set of 21
numbers with value between 0 and 1 indicating the
probability that the input is the muscle indicated by
the label assigned to the specific output. To assign
the correct label, we threshold the probabilities at 0.5,
anything above is considered 1, while below is 0.
5.2 Training, Validation, and Test Sets
In supervised learning, input data has to be separated
into three sets: training, validation, and test. The first
set is used to train the network; the second to vali-
date the quality of the trained network during the trai-
ning process, on data for which classification result is
known; and, the third represent unseen data to the net-
work and it is used to evaluate the prediction accuracy
when the training is done. With our goal being the
correct labeling (classification) of the muscle associ-
ated with each EMG sensor represented by the input
Identifying Electromyography Sensor Placement using Dense Neural Networks
135

features across multiple type of movements, we devi-
sed the following input sets:
• Full-Random: at each training cycles observati-
ons belonging to each set are selected randomly
from the input data sets according to the following
proportions: 70% for training, 15% for validation,
and 15% test.
• Subject-specific: data from one of the subject
is completely removed from the data set and used
as test set. The remaining data is organized accor-
dingly: 85% for training; and, 15% for validation
Datasets built using the Full-Random are com-
mon to the majority of the approaches using ANNs.
This approach is the simplest and basically rely on
the amount of input observations in order to be able
to discover patterns. With Subject-specific, we
remove all data belonging to one subject from the
training and validation sets. In doing so, we are able
to evaluate how the network behaves when presented
with data that, in its entirety, has not been seen be-
fore, thus the network could not have assimilated any
pattern from it.
Results from training the network with these three
different types of sets will be described in Sec. 6.
5.3 Neural Network Training
The input to our neural network is the tabular repre-
sentation of the cross-correlation matrices represen-
ting the various trials. In preparing the input for the
neural network, we had to convert the categorical va-
riables to so-called one-hot encodings. Specifically,
each observation in our tabular representation is com-
posed of the following data:
• a one-hot encoding describing the type of mo-
vement (56 boolean inputs);
• the cross-correlation values between one EMG
channel and all the other EMG channels, that is
21 inputs with values between -1 and 1;
• the cross-correlation between one EMG signal
(the same as above) and all the kinematics signals,
that is 23 inputs with value between -1 and 1;
• a one-hot encoding describing which EMG signal
is the source of all correltions, that is what muscle
the EMG sensor is monitoring.
We created one model for each of our input sets
defined in Sec. 5.2. To create each model, we run the
training cycle process for 100 epochs, with batch size
of 16 data samples. For a proper evaluation of the
model, we repeated the training cycle 1000 times for
each type of input sets. The next section presents the
results of our experiments.
6 EVALUATION
This section presents the evaluation of our approach
to automatic classification of EMG sensor placement.
The goal is to correctly associate each EMG input
channel with the correct muscle label, confirming the
information provided during the experimental setup
where electrodes were placed under ultrasound gui-
dance, or, in case of different prediction, marking the
specific channel for more scrutiny and study.
For evaluating our approach, we built a prototype
system using R, python, and keras. The input data
was composed of the signals collected from 6 sub-
jects; each subject undergo between 24 and 55 trials,
for a total of 204 trials in total. In the reminder of this
section we present: the results obtained when using
the Full-Random input set, the results obtained when
using the Subject-Specific input set, and a discus-
sion of the discoveries.
6.1 Full-Random Model
Fig. 5 shows the progression of the model accu-
racy over 1000 training cycles when trained on the
Full-Random input set. The model reached an
average accuracy of 99.27% with a standard deviation
of 0.04 on the training set, and an accuracy of 90.10%
with a standard deviation of 0.01 on the validation set.
The test set results over the thousands iterations
computes to an average accuracy of 90.02% with a
standard deviation of 0.0148. Fig. 6 show the box
plot of model accuracy and loss on the test set. The
vast majority of training cycles perform well, while a
minority exhibit lower performance.
We proceeded by analyzing the accuracy on each
individual muscle label to investigate whether the
classification model was performing better for some
muscles than for others. Fig. 7 shows that the muscle
label classification performs well, except for ED3,
ED5, and ED M, to some extent.
We then analyzed the prediction accuracy for
every muscle of each subjects. Fig. 8 shows the neural
network predictions for the first 8 channels, enumera-
ted from left to right by row, of subject 1. As we can
see, channels 1, 2, and 3, with labels ECR LO, ECU,
and FDP4, are predicted correctly almost all the ti-
mes. For channels 4, and 8, the prediction is not as
good as for the previous group. For channels 5, 6, and
7, the neural network performed poorly.
Lastly, we checked the accuracy over the same
muscle across different subjects. Fig. 9 shows pre-
dictions for channel FDP4 across all subjects. We can
observe that FDP4 is not present for subject 2, which
DATA 2018 - 7th International Conference on Data Science, Technology and Applications
136
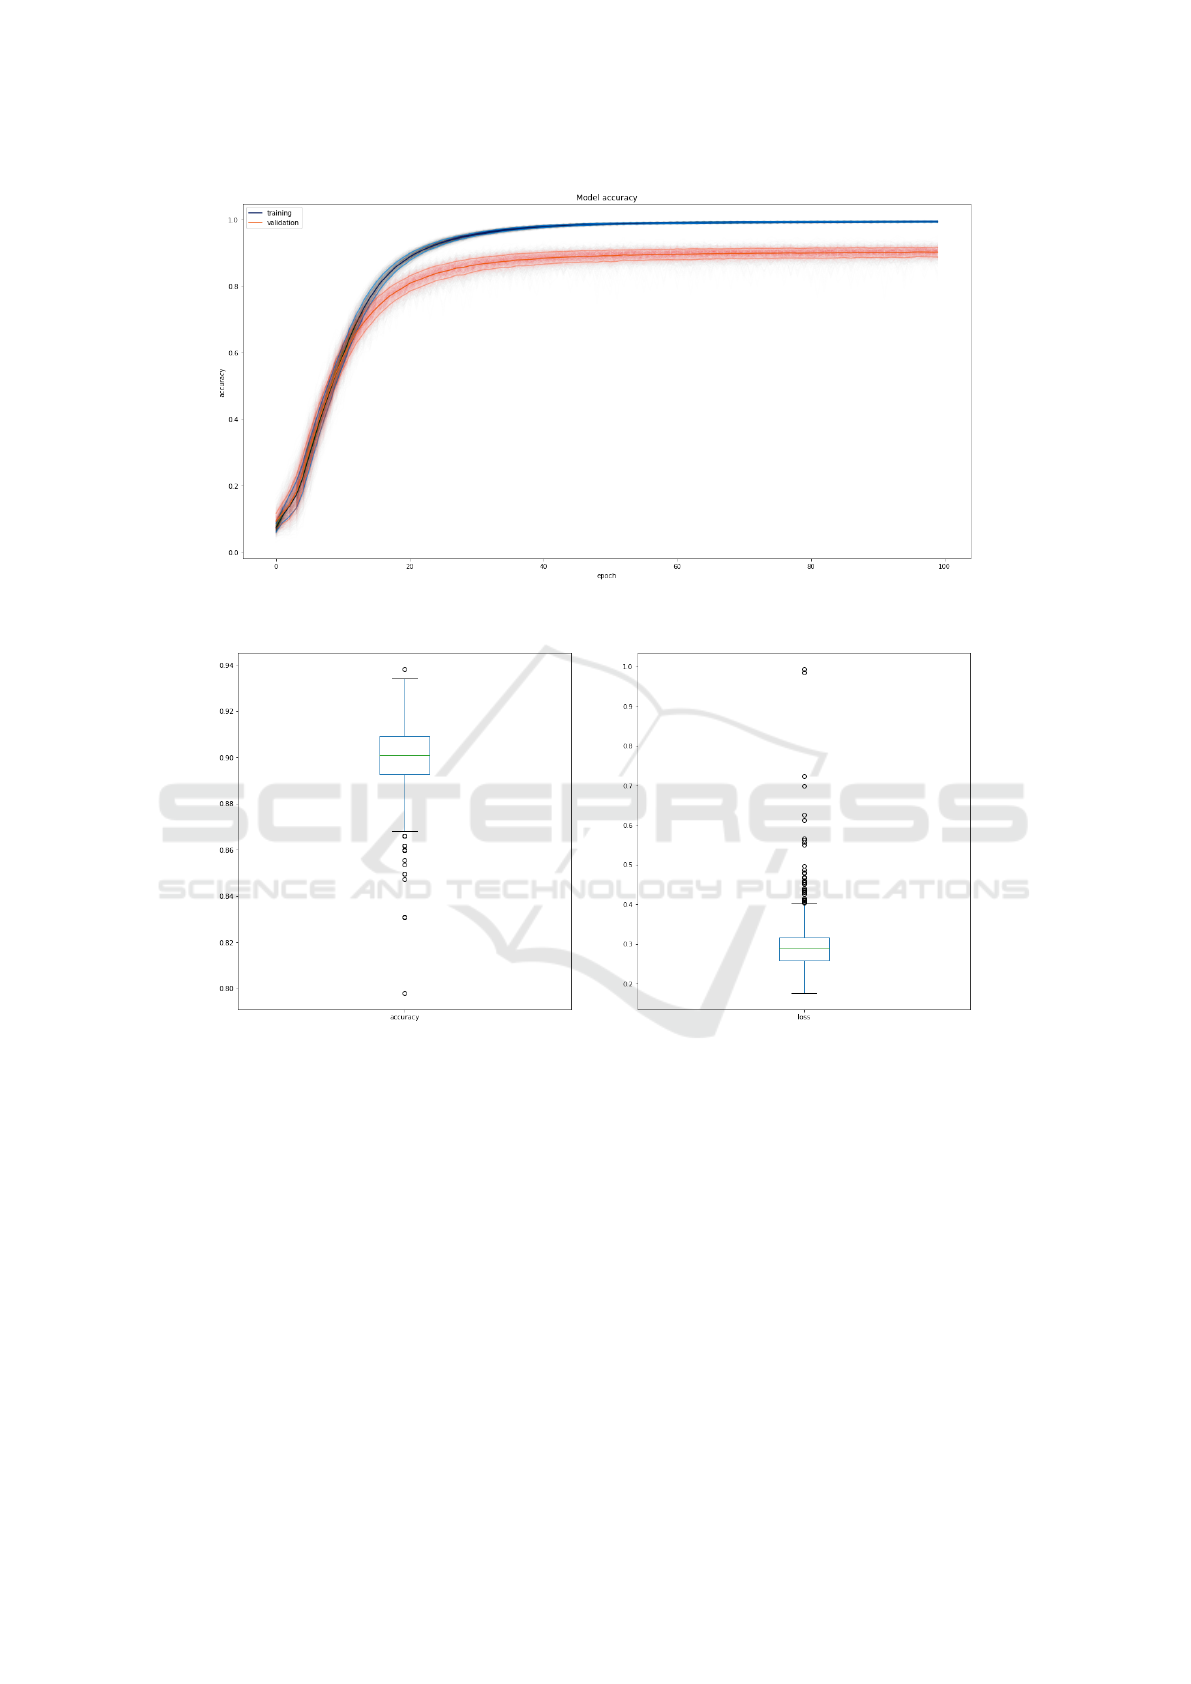
Figure 5: Progression of accuracy during 100 epochs on training (blue) and validation (red) sets. Solid line is the average
value with plus and minus one std. The cloud contains each single training cycles.
Figure 6: Box plot of accuracy and loss for test set over the thousand training cycles.
likely means that for the trial no sensor was placed in
the associated muscle. For all the remaining 5 sub-
jects, we can say that the prediction is fairly accurate.
6.2 Subject-specific Model
With regards to the Subject-specific input sets,
we relegated data from a single subject to the test set,
while data from all other subjects composed the trai-
ning and validations set. The model accuracy was si-
milar to the Full-Random configuration, where the
network achieved 99.03% and 90.19% accuracy for
the training and validation sets, respectively. With
data from the test subject, that had never been seen
by the network during training 88.17% of the EMG
sensors were identified as recording signals from the
muscle that was assigned under ultrasound guidance.
Fig. 10 shows the accuracy for first 8 channels for
subject 1. It can be observed that the prediction accu-
racy was: very high for channels 1, 2, 3, 5 and 8, high
for channels 4 and 6, and low/poor for channel 7.
6.3 Discussion
Validation of placement of fine-wire electrodes in the
extrinsic hand muscles and other locations has typi-
cally been accomplished by qualitative comparison of
EMG activity generated by the movement being per-
formed (Birdwell et al., 2011; Burgar et al., 1997;
Rudroff, 2008). The applications of small amounts
of current through EMG electrodes to stimulate a
muscle contraction has alternatively been used (Bird-
Identifying Electromyography Sensor Placement using Dense Neural Networks
137
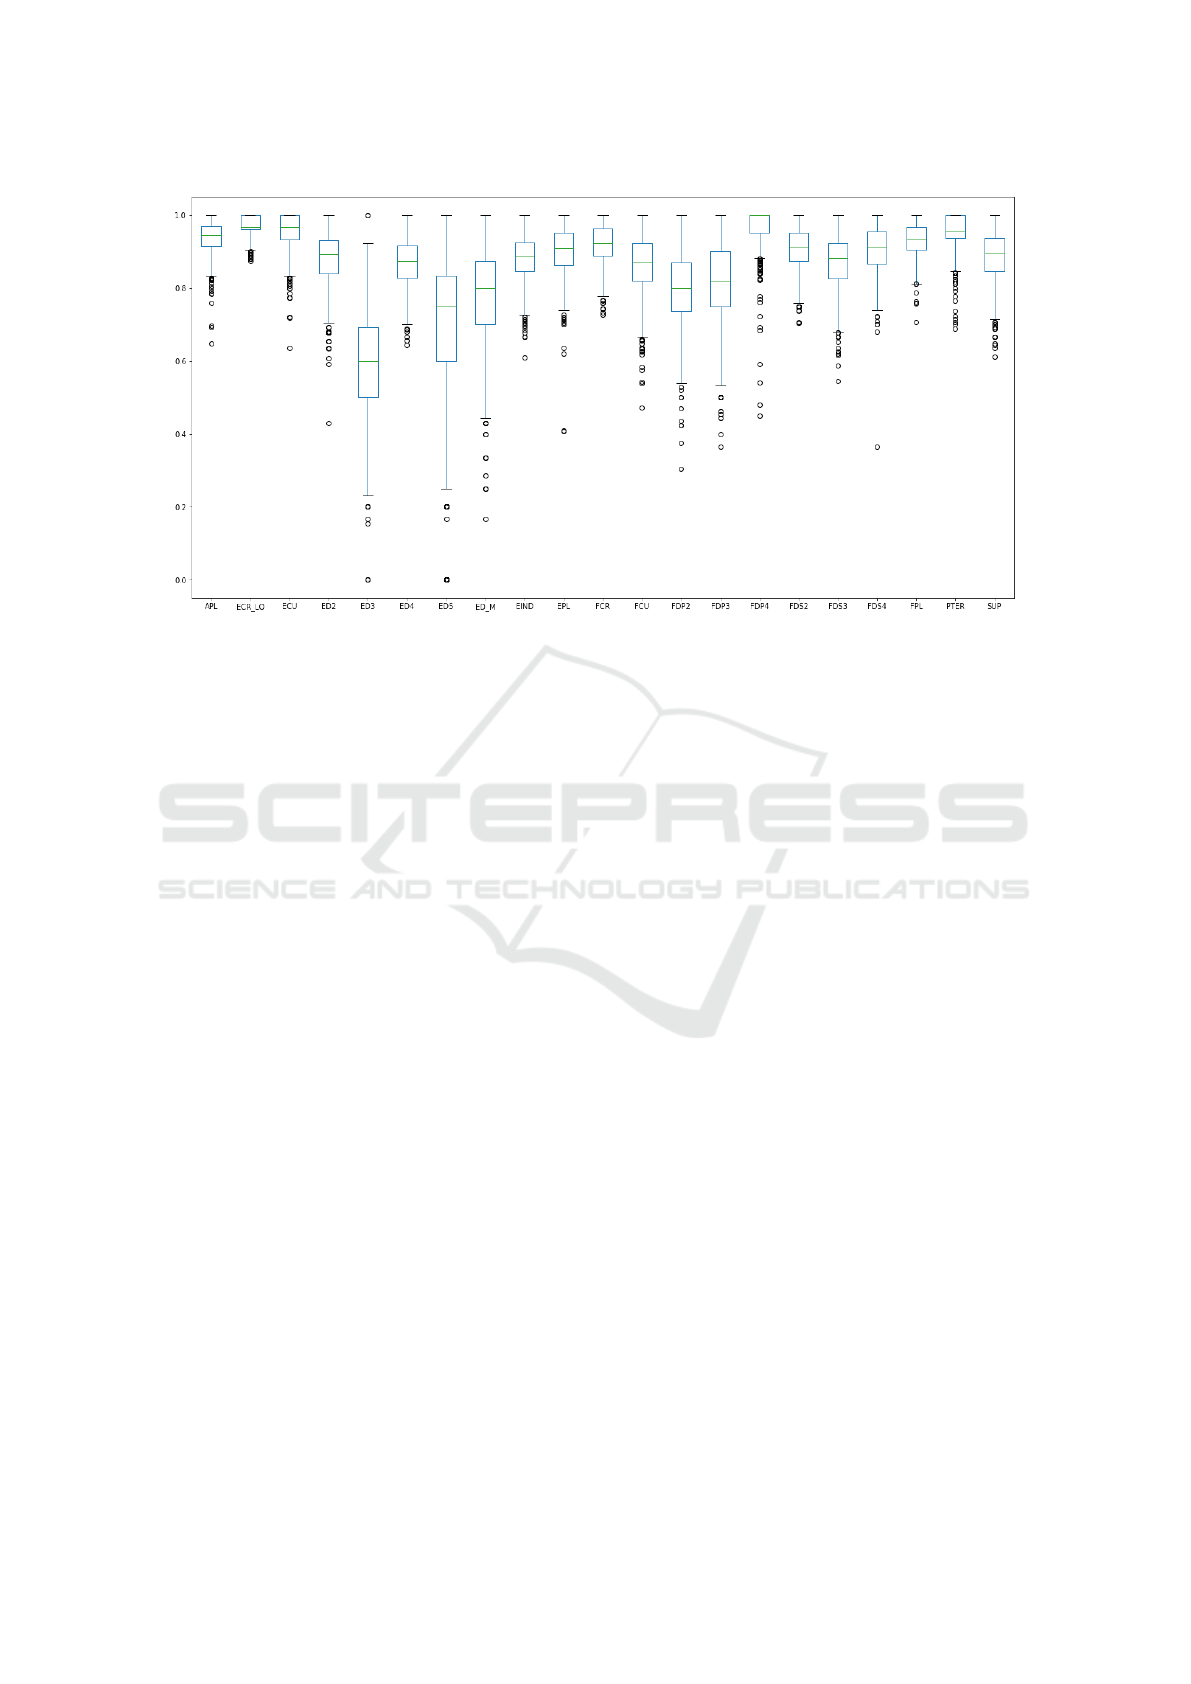
Figure 7: Box plot for accuracy for each muscle.
well et al., 2013; Park and Harris, 1996), but this met-
hod may not be applicable for prosthetic limb users.
To the best of our knowledge, our approach is the first
of its kind to use a machine-learning algorithm to va-
lidate electrode location.
The neural network model we developed delivers
very good performance in labeling EMG channels
with the identity of the muscle that was targeted du-
ring implant, especially when considering the relati-
vely small amount of subjects and trials composing
the training data. In analyzing the results from the
evaluation, we noted several interesting findings.
In the individual muscle labelling experiment for
the Full-Random input set, see Fig. 7, we discovered
that one reason why channels were under-performing
is that the input signals for those channels do not ap-
pear for all monitored subjects. As a consequence, the
model had a smaller number of samples to use to infer
signal patterns, thus impacting the overall accuracy.
In the per subject muscle labelling experiment for
the Full-Random input set, see Fig. 8, the poor per-
formance on channels 5, 6, and 7 could be caused by
the presence of inconsistencies in the initial labelling
provided by the physician for these channels. To vali-
date this hypothesis, domain expert researchers have
to review the experimental data and analyze the dyn-
amics of the signal in relation to the movement.
Finally, we looked at the incorrect predictions to
investigate whether there is a correlation between the
actual (correct) muscle and the incorrect predicted
value. We built a directed graph of the wrong pre-
dictions, see Fig. 11 which show an excerpt of this
graph for a single example. The graph exhibits some
interesting patterns including that the ANN confu-
sed muscles within two separate groups: extensors
and flexors. This figure also shows that some of the
muscle are not predicted at all, and they lead to the
use of the “none” label.
7 CONCLUSIONS
Artificial neural networks show great application po-
tential across a range of different domains. In this
paper, we focused on how to support physician and
medical researchers in assessing whether a set of in-
tramuscular electromyography sensors are placed in
the targeted muscle or not. We presented a number
of data processing steps which take raw sensor data
and transforms it in usable information that enables
domain specialists to perform their tasks more effi-
ciently and effectively, improving both the rehabilita-
tion sessions as well as the quality of the data analysis
resulting from the multiple recording trials.
We have presented a novel approach that combi-
nes a dense neural network architecture with a com-
pact cross-correlation matrix describing the rehabili-
tation trial sensor readings. We have developed a pro-
totype system and evaluated it on real data. The expe-
riments demonstrated that our approach achieves an
accuracy around 90% in classifying the muscle from
which sensor readings are coming from. This is a very
promising result, especially when considering that: in
our experiments the classification imprecision on spe-
cific muscles was caused by lack of data regarding
such muscles, possibly muscle mis-labelling; and that
the amount of observations available to train the net-
DATA 2018 - 7th International Conference on Data Science, Technology and Applications
138
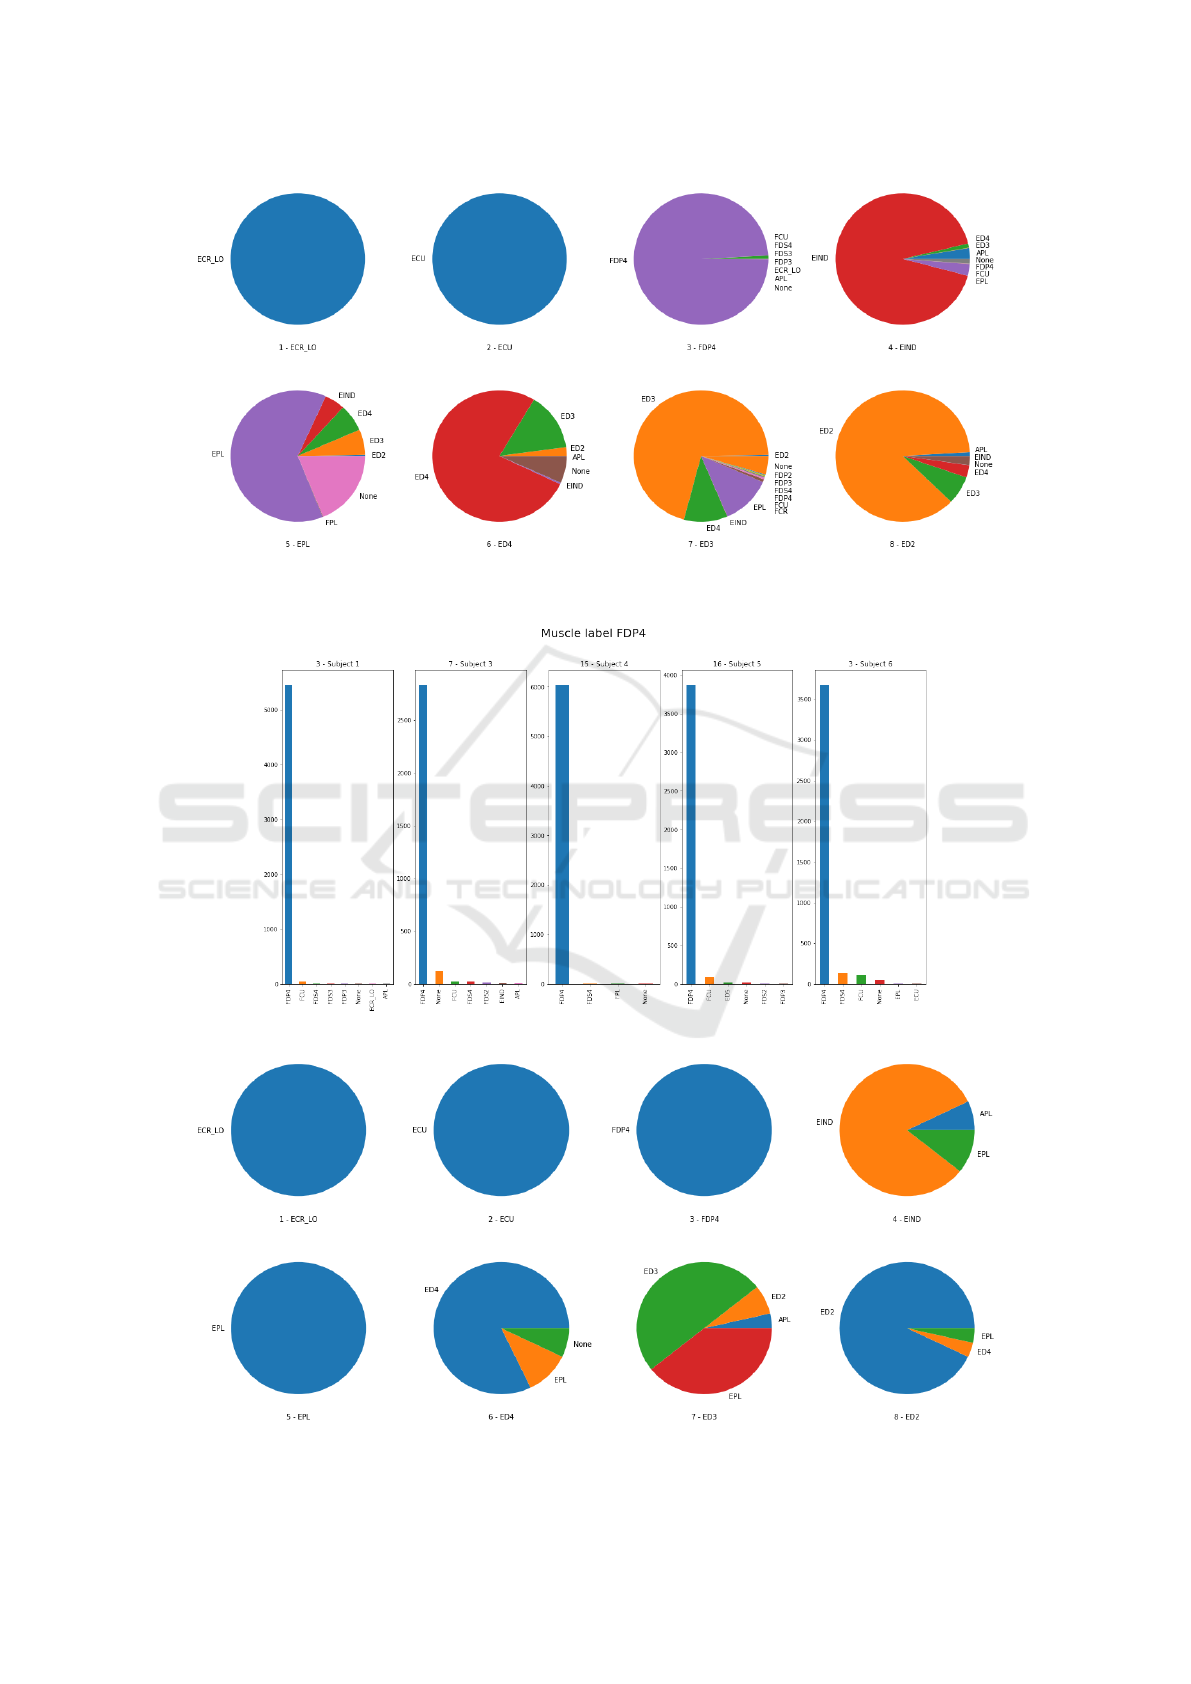
Figure 8: Excerpt of the first 8 channels from Subject 1 individual channel predictions. Each pie chart represent the predictions
for one channel which is indicated right below with the label that was assigned during experimental setup
Figure 9: Muscle FDP4 predictions across subjects.
Figure 10: Excerpt with the first 8 channels from the predictions on all channels with subject 1 data as a test set.
Identifying Electromyography Sensor Placement using Dense Neural Networks
139

Figure 11: Directed graph of the wrong predictions: edge
thickness indicates the number of occurrences of the mista-
ken label.
work was limited in general, when compared to other
works using neural networks.
The results of this study can help with valida-
ting the implanted muscle identity using the pattern
of EMG activity. We used ultrasound techniques as
an initial tool to validate the predicted results. Future
work will focus on validating the predicted muscles
identities using the EMG pattern with the probability
of migration of each EMG sensor in the neighboring
muscle compartment based on the geometrical vici-
nity. Also, we are planning to extend this work to im-
prove classification accuracy by obtaining access to a
larger amount of observations, further enriching the
trials’ metadata, and trying different neural network
architectures and parameters.
ACKNOWLEDGEMENTS
Research was sponsored by the U.S. Army Rese-
arch Office and the Defense Advanced Research Pro-
jects Agency (DARPA) and was accomplished un-
der Cooperative Agreement Number W911NF-15-2-
0016. The views and conclusions contained in this
document are those of the authors and should not be
interpreted as representing the official policies, either
expressed or implied, of the Army Research Office,
Army Research Laboratory, DARPA, or the U.S. Go-
vernment. The U.S. Government is authorized to re-
produce and distribute reprints for Government pur-
poses notwithstanding any copyright notation hereon.
REFERENCES
Atzori, M., Cognolato, M., and Mller, H. (2016a). Deep le-
arning with convolutional neural networks applied to
electromyography data: A resource for the classifica-
tion of movements for prosthetic hands. Frontiers in
Neurorobotics, 10:9.
Atzori, M., Gijsberts, A., Castellini, C., Caputo, B., Hager,
A.-G. M., Elsig, S., Giatsidis, G., Bassetto, F., and
Mller, H. (2016b). Effect of clinical parameters on
the control of myoelectric robotic prosthetic hands.
Journal of rehabilitation research and development,
53(3):345358.
Birdwell, A. J., Hargrove, L. J., and Weir, R. F. (2011).
Quantification of isolated muscle compartment acti-
vity in extrinsic finger muscles for potential prosthesis
control sites. In IEEE Conference of the Engineering
in Medicine and Biology Society, EMBS 2011, Boston,
Massachusetts, USA, August 30-September 3, 2011.,
pages 4104 – 4107.
Birdwell, J., Hargrove, L., Kuiken, T., and Weir, R. (2013).
Activation of individual extrinsic thumb muscles and
compartments of extrinsic finger muscles. Journal of
Neurophysiology, 110(6):1385–1392.
Burgar, C. G., Valero-Cuevas, F. J., and Hentz, V. R. (1997).
Fine-wire electromyographic recording during force
generation: Application to index finger kinesiologic
studies. American journal of physical medicine & re-
habilitation, 76(6):494–501.
Chu, J. U., Moon, I., and Mun, M. S. (2006). A real-
time emg pattern recognition system based on linear-
nonlinear feature projection for a multifunction myoe-
lectric hand. IEEE Transactions on Biomedical Engi-
neering, 53(11):2232–2239.
Dideriksen, J. L., Gianfelici, F., Maneski, L. Z. P., and
Farina, D. (2011). Emg-based characterization of
pathological tremor using the iterated hilbert trans-
form. IEEE Transactions on Biomedical Engineering,
58(10):2911–2921.
Gandolla, M., Ferrante, S., Ferrigno, G., Baldassini, D.,
Molteni, F., Guanziroli, E., Cottini, M. C., Seneci, C.,
and Pedrocchi, A. (2017). Artificial neural network
emg classifier for functional hand grasp movements
prediction. Journal of International Medical Rese-
arch, 45(6):1831–1847. PMID: 27677300.
J
´
ozefowicz, R., Vinyals, O., Schuster, M., Shazeer, N., and
Wu, Y. (2016). Exploring the limits of language mo-
deling. CoRR, abs/1602.02410.
Kaggle (2014). American epilepsy society seizure pre-
diction challenge. https://www.kaggle.com/c/seizure-
prediction. [Online; accessed 20-April-2018].
Kaggle (2015). Grasp-and-Lift EEG Detection.
https://www.kaggle.com/c/grasp-and-lift-eeg-
detection. [Online; accessed 20-April-2018].
Kamavuako, E. N., Farina, D., and Jensen, W. (2011).
Use of sample entropy extracted from intramuscular
emg signals for the estimation of force. In Drem-
strup, K., Rees, S., and Jensen, M. Ø., editors, 15th
Nordic-Baltic Conference on Biomedical Engineering
and Medical Physics (NBC 2011), pages 125–128,
Berlin, Heidelberg. Springer Berlin Heidelberg.
Kamavuako, E. N., Farina, D., Yoshida, K., and Jensen,
W. (2009). Relationship between grasping force and
features of single-channel intramuscular emg signals.
Journal of Neuroscience Methods, 185(1):143 – 150.
DATA 2018 - 7th International Conference on Data Science, Technology and Applications
140

Kamavuako, E. N., Farina, D., Yoshida, K., and Jensen, W.
(2012). Estimation of grasping force from features of
intramuscular emg signals with mirrored bilateral trai-
ning. Annals of Biomedical Engineering, 40(3):648–
656.
Karlik, B. (2014). Machine learning algorithms for cha-
racterization of emg signals. International Journal of
Information and Electronics Engineering, 4(3):189 –
194.
Khezri, M. and Jahed, M. (2011). A neuro-fuzzy inference
system for semg-based identification of hand motion
commands. IEEE Transactions on Industrial Electro-
nics, 58(5):1952–1960.
Kocyigit, Y., Karlik, B., and Korurek, M. (1996). Emg
pattern discrimination for patient-response control of
fes in paraplegics for walker supported using artifical
neural network (ann). In Proceedings of 8th Mediter-
ranean Electrotechnical Conference on Industrial Ap-
plications in Power Systems, Computer Science and
Telecommunications (MELECON 96), volume 3, pa-
ges 1439–1441 vol.3.
LeCun, Y., Bengio, Y., and Hinton, G. E. (2015). Deep
learning. Nature, 521(7553):436–444.
Liang, M. and Hu, X. (2015). Recurrent convolutional neu-
ral network for object recognition. In IEEE Confe-
rence on Computer Vision and Pattern Recognition,
CVPR 2015, Boston, MA, USA, June 7-12, 2015, pa-
ges 3367–3375.
Lin, M., Chen, Q., and Yan, S. (2013). Network in network.
CoRR, abs/1312.4400.
Luong, M., Le, Q. V., Sutskever, I., Vinyals, O., and Kaiser,
L. (2015). Multi-task sequence to sequence learning.
CoRR, abs/1511.06114.
Matsumura, Y., Mitsukura, Y., Fukumi, M., Akamatsu, N.,
Yamamoto, Y., and Nakaura, K. (2002). Recognition
of emg signal patterns by neural networks. In Neu-
ral Information Processing, 2002. ICONIP ’02. Pro-
ceedings of the 9th International Conference on, vo-
lume 2, pages 750–754 vol.2.
Merletti, R. and Farina, D. (2009). Analysis of intramuscu-
lar electromyogram signals. Philosophical Transacti-
ons of the Royal Society of London A: Mathematical,
Physical and Engineering Sciences, 367(1887):357–
368.
Moital, A. R., Dogramadzi, S., and Ferreira, H. A. (2015).
Development of an emg controlled hand exoskeleton
for post-stroke rehabilitation. In Proceedings of the
3rd 2015 Workshop on ICTs for Improving Patients
Rehabilitation Research Techniques, REHAB ’15, pa-
ges 66–72, New York, NY, USA. ACM.
Mulas, M., Folgheraiter, M., and Gini, G. (2005). An emg-
controlled exoskeleton for hand rehabilitation. In 9th
International Conference on Rehabilitation Robotics,
2005. ICORR 2005., pages 371–374.
Park, T. A. and Harris, G. (1996). ”Guided” intramuscu-
lar fine wire electrode placement. A new technique.
American journal of physical medicine & rehabilita-
tion, 75:232–4.
Rubin, J., Abreu, R., Ganguli, A., Nelaturi, S., Matei, I.,
and Sricharan, K. (2017). Recognizing abnormal he-
art sounds using deep learning. In Proceedings of the
2nd International Workshop on Knowledge Discovery
in Healthcare Data Co-located with the 26th Interna-
tional Joint Conference on Artificial Intelligence (IJ-
CAI 2017), Melbourne, Australia, August 20, 2017.,
pages 13–19.
Rudroff, T. (2008). Kinesiological fine wire emg. A practi-
cal introduction to fine wire EMG applications.
Soares, A., Andrade, A., Lamounier, E., and Carrijo, R.
(2003). The development of a virtual myoelectric
prosthesis controlled by an emg pattern recognition
system based on neural networks. Journal of Intel-
ligent Information Systems, 21(2):127–141.
Steens, A., Heersema, D., Maurits, N., Renken, R., and Zi-
jdewind, I. (2012). Mechanisms underlying muscle
fatigue differ between multiple sclerosis patients and
controls: A combined electrophysiological and neu-
roimaging study. NeuroImage, 59(4):3110 – 3118.
Szegedy, C., Vanhoucke, V., Ioffe, S., Shlens, J., and Wojna,
Z. (2016). Rethinking the inception architecture for
computer vision. In 2016 IEEE Conference on Com-
puter Vision and Pattern Recognition, CVPR 2016,
Las Vegas, NV, USA, June 27-30, 2016, pages 2818–
2826.
Yang, X., Yeh, S.-C., Niu, J., Gong, Y., and Yang, G. (2017).
Hand rehabilitation using virtual reality electromyo-
graphy signals. 2017 5th International Conference on
Enterprise Systems (ES), pages 125–131.
Zazula, D., Korosec, D., and Sostaric, A. (1998). Computer-
assisted decomposition of the electromyograms. In
Proceedings. 11th IEEE Symposium on Computer-
Based Medical Systems (Cat. No.98CB36237), pages
26–31.
Identifying Electromyography Sensor Placement using Dense Neural Networks
141
