
Open Source Business Intelligence Platforms’ Assessment using
OSSpal Methodology
Nuno Leite
1
, Isabel Pedrosa
1
and Jorge Bernardino
2
1
Polytechnic of Coimbra, Coimbra Business School - ISCAC, Quinta Agrícola – Bencanta, 3040-316 Coimbra, Portugal
2
Polytechnic of Coimbra, Institute of Engineering of Coimbra – ISEC, Rua Pedro Nunes, 3030-199 Coimbra, Portugal
Keywords: Business Intelligence, Open Source, OSSpal Methodology, Knowage, Pentaho.
Abstract: The knowledge that can be acquired from existing data in organizations is critical to increasing organizations
competitive advantage in today's changing markets. The use of Business Intelligence (BI) platforms is an
effective choice in support of decision-making. BI platforms are a major asset for any enterprise, as they have
multiple benefits, such as efficient use of resources, identification of business opportunities and negative
trends that become a competitive advantage. Open source BI platforms provide most of the functionalities
available in commercial solutions without increasing costs for enterprises. However, it is important to know
which open source BI platform to choose. In this paper, it is used OSSpal, an open source assessment
methodology to evaluate two of the most popular open source BI platforms: Knowage and Pentaho.
1 INTRODUCTION
Business Intelligence translates into a set of
management practices, implemented through
software, with the objective of increasing profitability
and supporting administrations in the decision-
making and leadership of their organizations (Lapa et
al., 2014). Enterprises that use BI platforms have
analytical tools that provide important information
and data for their management.
The term Business Intelligence (BI) was
introduced by Howard Dresner of the Gartner Group
in 1989 (Power, 2007). Davenport defines a BI
platform as a set of processes and software used to
collect, analyse and disseminate data, with the aim of
better decision making (Davenport, 2006). BI
platforms use data available in organizations to
generate and deliver information used to support
decision-making. This information is obtained by
combining data interrogation and exploration tools
with tools that enable reporting. These platforms
typically associate three technologies: Data
Warehouses, On-Line Analytical Processing (OLAP)
and Data Mining. Data Warehouse is an integrated
repository that allows storing information. This
information can then be analysed through OLAP and
/ or Data Mining tools.
OLAP is a multidimensional analysis that allows
analysing the information under different
perspectives. Data Mining uses data mining
algorithms that identify patterns, relationships,
models, etc. Business Intelligence contributes to
increase the collective intelligence, learning ability
and creativity of the organization (Santos and Ramos,
2006). This work focuses on open source BI
platforms. Although they require some effort in their
installation, they have no acquisition costs and
licenses, which makes them the most viable option for
enterprises (Lapa et al., 2014).
The increase in the use of Open Source Software
in its "Free / Libre" Open Source Software (FLOSS)
aspect that we witness at the beginning of the 21st
century is due to several factors, including the
absence of licensing costs and the availability of
source code that allows users to tailor it to their
specific needs. A disadvantage is the absence of
metrics that assure the quality of this and prove its
validity (Petrinja et al.2008).
It becomes fundamental that the enterprises make
an informed choice regarding open source software.
In order to assist enterprises in this task, and to
address this main objective, in this paper we apply the
OSSpal methodology to assess two open source BI
platforms: Knowage and Pentaho. To the best of our
knowledge, it is the first time Knowage is assessed
190
Leite, N., Pedrosa, I. and Bernardino, J.
Open Source Business Intelligence Platforms’ Assessment using OSSpal Methodology.
DOI: 10.5220/0006910101900196
In Proceedings of the 15th International Joint Conference on e-Business and Telecommunications (ICETE 2018) - Volume 1: DCNET, ICE-B, OPTICS, SIGMAP and WINSYS, pages 190-196
ISBN: 978-989-758-319-3
Copyright © 2018 by SCITEPRESS – Science and Technology Publications, Lda. All rights reserved

with OSSpal methodology and the installation
process is carried out to provide a better assessment.
The remainder of this paper is organized as
follows. Section 2 presents the related work. Section
3 describes the two open source BI platforms
assessed. Section 4 explains the fundamentals of
OSSpal methodology and Section 5 presents the
assessment of the platforms with OSSpal. Finally,
Section 6 presents the conclusions and future work.
2 RELATED WORK
The advent of FLOSS made the traditional software
evaluation models like McCall, Boehm’s or ISO
9126, not applicable to all software. This models
cannot be adapted to the Open Source development
practices and thus, cannot be used to evaluate the
software and its community as a whole (Samoladas
and Gousios, 2008).
Deprez and Alexandre (2008) conducted the first
effort comparing FLOSS assessment methodologies.
They have done a rigorous comparison between Open
Business Readiness Rating (OpenBRR) and
Qualification and Selection of Open Source Software
(QSOS) based on the description of the
methodologies and not on their empirical application.
They identified advantages and disadvantages of both
methodologies. They concluded that OpenBRR
allows tailoring the criteria to a domain, hence a
better fit to the evaluation context, but terminology is
broad and imprecise for the top nodes in the
hierarchy. On the other hand, QSOS has an extensive
list of criteria but the scoring rules are ambiguous for
more than half of the criteria. The authors also
conclude that QSOS 3-level score is too restrictive.
Petrinja et al., (2010) developed a study on the
quality and usability of three FLOSS assessment
models: OpenBRR, the QSOS, and the QualiPSo
OpenSource Maturity Model (OMM). The study
identified the positive and negative aspects of each of
them. The results revealed that the three models
provided comparable assessments. The main
conclusion was that all three models have some
questions that do not have a clear formulation and
thus are not clear to the assessors. In some questions,
the threshold value available for the answer was not
clear either. The critical aspects of each model were:
Functionality and Quality for OpenBRR; Adoption,
Administration/Monitoring, Copyright owners, and
Browser for QSOS; and Quality of the Test Plan, and
the Technical Environment for OMM.
In Marinheiro and Bernardino (2015), five open
source BI platforms (Jaspersoft, Pentaho, SpagoBI
and Vanilla) were compared using Gartner 2013
criteria. In this comparison, they highlight the
Pentaho and SpagoBI platforms, which were
submitted to an experimental evaluation using the
methodology of open source software comparison,
OpenBRR. The authors concluded that, in the
evaluation scale of this methodology, the SpagoBI
platform obtained the best result.
Ferreira et al., (2017) evaluated four open source
BI platforms (Birt, Jaspersoft, Pentaho and SpagoBI)
using the OSSpal methodology. Applying the
methodology, in its scale of evaluation (from 1 to 5),
Pentaho obtained 3.47, SpagoBI 2.92 and Jaspersoft
2.90. Compared to Pentaho, SpagoBI performed
poorly in the community category and Jaspersoft in
the functionality category.
Leite et al., (2018) developed a comparative
evaluation of three open source BI platforms
(Jaspersoft, Knowage and Pentaho) using Gartner’s
2017 criteria. According to the authors, Knowage is
the new version of SpagoBI that now has also a
commercial version and no longer is 100% open
source. In that evaluation, Knowage validated 10 out
of 11 criteria while Jaspersoft and Pentaho validated
6 of the 11 criteria. The authors concluded that, with
the new Gartner criteria, differences became clearer
among these three platforms: while Knowage has
almost the same main functionalities in their
commercial and open sources version, Jaspersoft and
Pentaho relegate the new features only to their
commercial versions.
Although some of the platforms addressed in the
previous research mentioned are the same ones that
we will assess in this paper, in none of the studies
Knowage and Pentaho BI platforms were installed
and tested. In addition, to the best of our knowledge,
Knowage has never been assessed with OSSpal.
3 BUSINESS INTELLIGENCE
PLATFORMS
In a previous comparative evaluation, we analysed
three platforms using Gartner’s 2017 criteria:
Jaspersoft, Knowage and Pentaho. The three open
source projects were identified, out of six projects, as
the ones still active and under development.
Knowage obtained the best result in this
evaluation while Jaspersoft and Pentaho performed
equally. Based on these results, Knowage is the first
BI platform selected for the assessment.
In a number of recent studies (Tereso and
Bernardino, 2011; Marinheiro and Bernardino, 2015;
Open Source Business Intelligence Platforms’ Assessment using OSSpal Methodology
191
Ferreira et al., 2017) Pentaho has best scores than
Jaspersoft. In addition, once compared at Google
Trends, Pentaho scores 83 while Jaspersoft scores 20.
Therefore, Pentaho is the second BI platform selected
for this assessment.
Next, we briefly describe Knowage and Pentaho
BI platforms.
3.1 Knowage
In 2004, SpagoWorld, an open source initiative
founded by the Engineering Group, developed the
SpagoBI platform in Java. Since June 2017, at the
time of the release of version 6.0, the platform
SpagoBI assumed the new designation of Knowage.
From that moment on, two licenses became available:
a commercial version (Enterprise Edition) and an
open source version (Community Edition) under
AGPL v3 license, ceasing to be 100% open source.
Knowage Community Edition (CE) maintains all
SpagoBI features: Reports, OLAP, Graphs, KPIs,
Interactive dashboards, GEO / GIS, Data Mining, MS
Office integration and mobile integration.
The platform is composed of the following
modules: Big Data, Smart Intelligence, Enterprise
Reporting, Location Intelligence, Performance
Management and Predictive Analysis. According to
Knowage they allow better scalability and are
described next.
Big Data: allows to not only work with large
volumes of data, but also combine different
sources so you can develop different analyses.
Smart Intelligence: enables the development of
static reports, maps, interactive cockpits as well as
ad-hoc queries via drag & drop and
multidimensional analysis (OLAP). The CE
version does not allow calculated field, time series
and Multidimensional Expressions (MDX)
functions at the OLAP level.
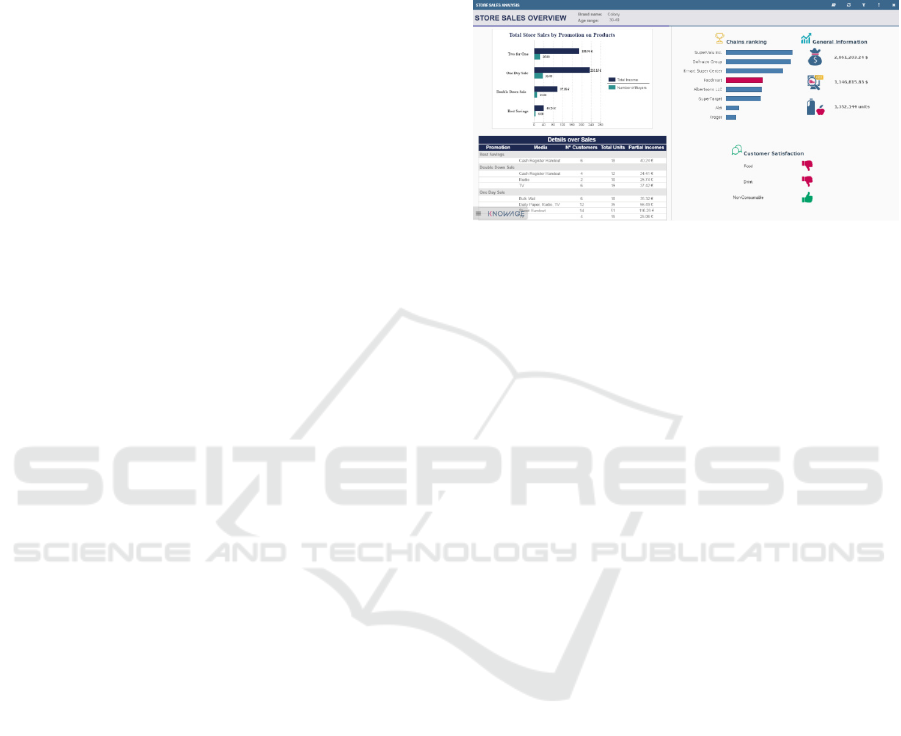
Enterprise Reporting: produces reports such as
the one shown in Figure 1 and allows exporting to
various formats including PDF and MS Office. It
also allows scheduling offline reports and
distributing them to a set of selected users.
Location Intelligence: is a module dedicated to
the spatial analysis of information, using various
types of sources such as maps or vector images
(SVG). It allows working traditional information
with spatial information that has a relation
between them, producing dynamic maps.
Performance Management: is a module dedicated
to the production and visualization of KPIs and
scorecards.
Predictive Analysis: enables advanced processing
with Data Mining techniques to simulate actions
and to evaluate their effects. For the “what-if”
feature, this module uses an OLAP solution that
allows interactive simulation between
measurements and dimensions via drag & drop.
Figure 1: A report from Knowage platform (Knowage,
2018).
The commercial version contains the same
modules and functionalities as the open source
version, but it adds advanced functions to almost all
the modules. Examples of this are more interactive
graphs in which we can zoom, cockpits with near
real-time updates, what-if with access to MOLAP,
and self-service KPIs. At the administrative level,
only the commercial version allows multi-
environment installation, cache manager and multi-
person management.
The Knowage platform is presented as an all-in-
one installation solution. With only one installation
on the server, the platform is ready to operate through
the browser. In addition to the single version,
Knowage provides the modules independently, which
makes it quite versatile in the installation process.
The Community Edition is quite complete and the
all-in-one installation, accompanied by an extensive
and comprehensive manual, is a strong point of this
platform.
3.2 Pentaho
Pentaho was created in 2004, comprising Pentaho
Reporting, Pentaho Reporting Server, Mondrian
OLAP Server and Pentaho Data Integration tools.
These tools composed the Pentaho Open BI Suite. In
2006, Pentaho encompasses the Kettle and Weka
projects. In 2015, Hitachi Data Systems acquired
Pentaho. In the last years has been released a new
edition per year, being currently in version 8.0.
The Pentaho BI platform is available in two
versions, both developed in Java. The Enterprise
Edition, this being the commercial and the
ICE-B 2018 - International Conference on e-Business
192

Community Edition, the open source version. The
platform integrates the following modules:
Business Analytics Platform: is the server that
provides various services to users such as reports
and integration tools.
Data Integration: is the platform’s ETL module,
also known as Kettle, and allows data extraction,
transformation and loading actions.
Report Designer: is a graphical tool that allows
you to design reports as shown in Figure 3.
Aggregation Designer: allows to create and
maintain aggregate tables.
Schema Workbench: is a visual interface for
creating and testing OLAP cubes in Mondrian.
Metadata Editor: presents itself as a tool that
simplifies the reporting experience by allowing to
build metadata domains and relational data
models.
Figure 2: An example of a report designed with Pentaho
platform.
Pentaho highlights features that are only present
in the commercial version. Among them, the
interactive reports, Ad-hoc queries, Drill down and
Drill through, GEO / GIS, Dashboards and mobile
application. They also highlight more advanced
options in data integration and more sources in Big
Data. However, it is possible to implement
Dashboards with Community Tools.
The modular format of Pentaho architecture and
installation allows the users to build a platform
“tailored” to their needs. This is an advantage but
considering the installation consumes more time,
some users may consider it a disadvantage.
The support documentation is extensive,
including a help website (help.pentaho.com), and a
very active community (community.hds.com).
4 OSSPAL METHODOLOGY
OSSpal has emerged as a successor of the Business
Readiness Rating (OpenBRR) with the goal to
provide a trusted, unbiased source for evaluation of
open source software. It aims to be an open,
comprehensive and standard assessment model that is
trusted, widely used and “tunable” (Wasserman,
2014). OSSpal combines quantitative and qualitative
evaluation measures to decide which software has the
best score. This way it can assist companies,
government agencies, and other organizations in
finding high quality free open source software
(Wasserman et al., 2017).
The implementation of OSSpal Methodology is
composed of four phases (OpenBRR, 2005):
Phase 1: Quick Assessment Filter
Identification of the components of the software
to be analysed, measuring each component in
relation to the evaluation criteria.
Phase 2: Target Usage Assessment
Allocation of weights to categories and measures:
a. Assign a percentage of importance to each
category. They should sum up 100%.
b. For each measure within a category, rank the
measure according to its importance.
c. Assign a percentage to each measure within a
category according to its importance, totalling
100% over all the measures within one category.
Phase 3: Data collection and Processing
Gather data for each metric used in each category
rating, and calculate the applied weighting for
each metric, at a level of 1 (unacceptable) to 5
(excellent).
Phase 4: Data Translation
Use category ratings and the functional
orientation weighting factors to calculate the
OSSpal final score.
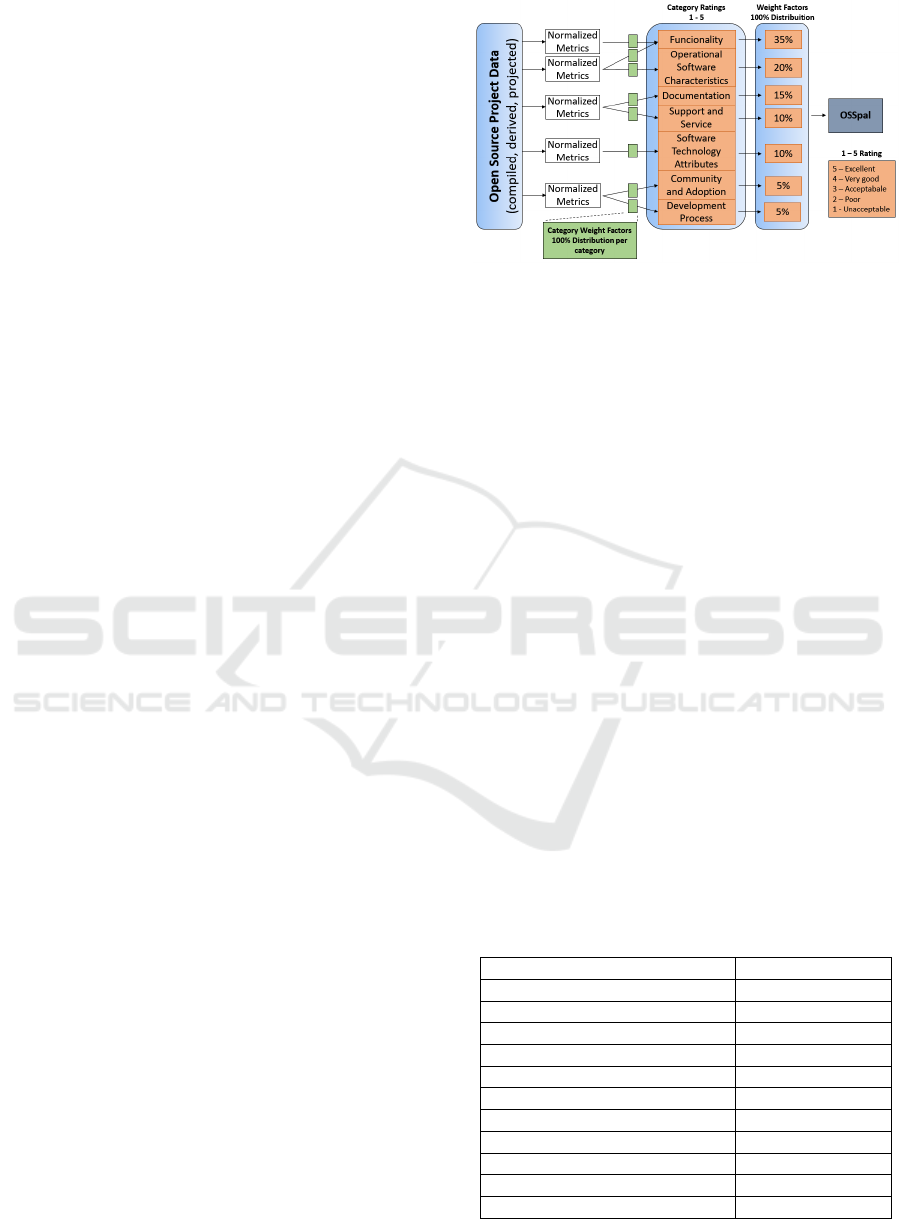
The OSSpal methodology, shown in Figure 5,
consists of seven evaluation areas (Wasserman et al.,
2017):
Functionality: How well will the software meet
the average user’s requirements?
Operational Software Characteristics: How
secure is the software? How well does the
software perform? How well does the software
scale to a large environment? How good is the UI?
How easy to use is the software for end-users?
How easy is the software to install, configure,
deploy, and maintain?
Open Source Business Intelligence Platforms’ Assessment using OSSpal Methodology
193
Support and Service: How well is the software
component supported? Is there commercial and/or
community support? Are there people and
organizations that can provide training and
consulting services?
Documentation: Is there adequate tutorial and
reference documentation for the software?
Software Technology Attributes: How well is the
software architected? How modular, portable,
flexible, extensible, open, and easy to integrate is it?
Are the design, the code, and the tests of high
quality? How complete and error-free are they?
Community and Adoption: How well is the
component adopted by community, market, and
industry? How active and lively is the community
for the software?
Development Process: What is the level of the
professionalism of the development process and of
the project organization as a whole?
Functionality is an assessment category that is
computed differently from other categories. Each
type of software application has a unique set of
features that needs to be fulfilled by the software. The
Functionality rating is obtained by first comparing the
features of the component being evaluated with a
standard feature-set required for an average use. This
standard feature-set must be constructed, or borrowed
from an external source (Phase 1).
The following steps should be used to compute de
Functionality score:
i. Assign an importance score to all items in the
feature list, using a scale of 1 to 3, with 1 being
less important, 3 being very important.
ii. Compare the feature list of the component
with the standard feature list. For each feature
met, add the importance score to a cumulative
sum. If not met, deduct importance score from
the sum.
iii. Divide the cumulative sum by the maximum
score that can be obtained by the standard
features. This ratio is called the feature score.
iv. Normalize the feature score to a scale of 1 to 5
using this scheme:
Under 65%, score = 1 (unacceptable)
65% - 80%, score = 2 (bad)
80% - 90%, score = 3 (acceptable)
90% - 96%, score = 4 (very good)
Greater than 96%, score = 5 (excellent)
Figure 3: OSSpal methodology.
5 EVALUATION
OSSpal appears as the successor to OpenBRR,
combining a qualitative and quantitative evaluation of
the software. It aims to assist companies, government
agencies, and other organizations in finding high
quality FLOSS (Wasserman et al., 2017).To ensure a
more reliable and accurate assessment using OSSpal,
the installation process was carried out for both open
source BI platforms. The installation was followed by
a basic use in order to provide user experience.
As stated in Phase 1, the features list was
elaborated to the functionality category. We selected
our feature list following the criteria used by Leite et
al., (2018) which are based on Gartner 2017 Magic
Quadrant for Business Intelligence and Analytics
Platforms. These features allow a more objective
assessment. With the features list elaborated, an
importance score was assigned to each feature from 1
to 3 (less to very important).
Table 1 shows the features chosen for the
functionality category and the weights given to each
one, according to the OSSpal methodology.
Table 1: Weights assigned to each feature in the
functionality category.
Features Weight
Dashboards 3
Interactive Visualization 3
OLAP 3
Real Time Information 3
ETL 2
Mobile BI 2
Self-Service BI 2
All-in-One Installation 1
Cloud BI 1
Collaboration 1
Hadoop/NoSQL 1
ICE-B 2018 - International Conference on e-Business
194

As stated in Phase 2, we allocated weights for
each category totalling 100%, as showed in Table 2.
Table 2: Weights assigned to each category.
Category Weight
Functionality 35%
Operational Software Characteristics 20%
Documentation 15%
Support and Service 10%
Software Technology Attributes 10%
Community and Adoption 5%
Development Process 5%
Total
100%
We considered “Functionality” the most
important category as it consists on the core of the
software assessed. For this reason, it has been given
the highest weight (35%). Following with a weight of
20%, we considered “Operational Software
Characteristics” the second most important category
as it considers into evaluation areas like user
experience and installation process. Still with some
importance, with weights of 15% and 10%, follows
the “Documentation” and “Support and Service”
categories respectively. Especially in the open source
context, these categories play an important role on
helping users and Information Technologies
professionals. Considered of less relevance, the
category of “Software Technology Attributes” was
given a 10% weight, “Community and Adoption” and
“Development Process” categories where both
weighted 5%.
After this weight attribution to all categories,
Phase 3 takes place. Each BI platform is assessed and
for each category, a score from 1 (unacceptable) to 5
(excellent) is given.
As stated previously, the score from 1 to 5 for
functionality category is computed differently.
Table 3 presents the intermediate results for this
step and the score obtained for functionality category.
In Phase 4, all the scores are translated according
to the weight each category was given (e.g., 10% of 5
translates to 0.5). The cumulated sum of each
category-translated score gives the final score of each
BI platform.
Table 4 presents the results of the assessment.
Pentaho, with a score of 4.35 (from 1 to 5) was the
BI platform with the highest score. Knowage has
scored 3.31. Pentaho scores slightly better that
Knowage on each category, except Functionality
where it has a difference of 0.35. In the first step to
compute Functionality score, Knowage had a result
of 86% and Pentaho 91%.
Table 3: Functionality score.
Feature Weight
Knowage Pentaho
Dashboards 3 3 3
Interactive
Visualization
3 3 3
OLAP 3 3 3
Real Time
Information
3 3 3
ETL 2 0 2
Mobile BI 2 2 2
Self-Service BI 2 2 2
All-in-One
Installation
1 1 0
Cloud BI 1 1 1
Collaboration 1 0 0
Hadoop/NoSQL 1 1 1
Cumulative sum 22 19 20
Normalization to
scale 1-5
100% 86% 91%
3 4
While this stands for a close result, the
normalization set by OSSpal methodology transforms
this value in a score of 3 to Knowage and 4 to
Pentaho.
Table 4: OSSpal final score.
Category
Score
Knowage Pentaho
Functionality 1.05 1.40
Operational Software
Characteristics
0.80 1.00
Documentation 0.53 0.68
Support and Service 0.35 0.45
Software Technology
Attributes
0.30 0.40
Community and Adoption 0.13 0.23
Development process 0.15 0.20
TOTAL 3.31 4.35
Applying the 35% weight to these scores, means
a rather relevant impact on the final score than it
actually was at the beginning.
In Operational Software Characteristics,
Pentaho’s user interface is simpler than Knowage’s,
yet more intuitive and effective. As for
Documentation, Pentaho has more and better
tutorials, which is important on the FLOSS context.
The final difference between Pentaho and
Knowage scores is 1.04. We address this difference
with the fact that Pentaho has a much larger
worldwide adoption, which helps to become a more
mature software.
Open Source Business Intelligence Platforms’ Assessment using OSSpal Methodology
195

6 CONCLUSIONS AND FUTURE
WORK
In this paper, we evaluated two open source BI
platforms still active and under development. This
evaluation was developed using OSSpal, which is an
open source software assessment methodology. The
use of an assessment methodology for open source
software is highly recommended as it allows to
achieve more reliable results.
The information required to develop the
evaluation was gathered from the websites of the BI
platforms. In addition, the installation process of each
open source version of the platforms was made and a
basic user experience of the software took place. This
allowed to confirm the information gathered from the
websites and to better evaluate some of the categories
that make part of the OSSpal methodology. Pentaho
presented the best score after applying the OSSpal
methodology. Knowage scored less than Pentaho but
it has the potential to perform better in the future.
Knowage has an “All-in-One” package for
installation that simplify the process and the core of
the platform was up and running in about half an hour.
Pentaho has more steps to achieve the same stage but
if all instructions are followed correctly, it can be
working in less than an hour.
The overall conclusion is that Pentaho is a more
mature software than Knowage in all categories and
this is the result of a much larger worldwide use and
community.
As future work, we intend to create measures
under each assessment category and to perform a
more extended used of the platforms by developing a
real case study scenario.
REFERENCES
Davenport, T. H. (2006) ‘Competing on Analytics’,
Harvard Business Review, pp. 98–107.
Deprez, J. C. and Alexandre, S. (2008) ‘Comparing
Assessment Methodologies for Free/Open Source
Software: OpenBRR and QSOS’, Lecture Notes in
Computer Science (including subseries Lecture Notes
in Artificial Intelligence and Lecture Notes in
Bioinformatics), 5089 LNCS, pp. 189–203. doi:
10.1007/978-3-540-69566-0_17.
Ferreira, T., Pedrosa, I. and Bernardino, J. (2017)
‘Evaluating Open Source Business Intelligence Tools
using OSSpal Methodology’, in Proceedings of the 9th
International Joint Conference on Knowledge
Discovery, Knowledge Engineering and Knowledge
Management, pp. 283–288. doi: 10.5220/00065164028
30288.
Knowage (2018) Knowage Report. Available at: https://
www.knowage-suite.com/site/product/enterprise-repor
ting/ (Accessed: 16 February 2018).
Lapa, J., Bernardino, J. and Figueiredo, A. (2014) ‘A
comparative analysis of open source business
intelligence platforms’, in Proceedings of the ISDOC
’14, pp. 86–92. doi: 10.1145/2618168.2618182.
Leite, N., Pedrosa, I. and Bernardino, J. (2018)
‘Comparative Evaluation of Open Source Business
Intelligence Platforms for SME’, in 13th Iberian
Conference on Information Systems and Technologies
(CISTI).
Marinheiro, A. and Bernardino, J. (2015) ‘Experimental
Evaluation of Open Source Business Intelligence Suites
using OpenBRR’, IEEE Latin America Transactions,
13(3), pp. 810–817. doi: 10.1109/TLA.2015.7069109.
OpenBRR (2005) OpenBRR White paper. Available at:
https://web.archive.org/web/20050803022846/http://w
ww.openbrr.org/docs/BRR_whitepaper_2005RFC1.pd
f (Accessed: 12 April 2018).
Petrinja, E., Sillitti, A. and Succi, G. (2008) ‘Overview on
trust in large FLOSS communities’, IFIP International
Federation for Information Processing, 275, pp. 47–56.
doi: 10.1007/978-0-387-09684-1_4.
Petrinja, E., Sillitti, A. and Succi, G. (2010) ‘Comparing
OpenBRR, QSOS, and OMM Assessment Models’, in
IFIP International Federation for Information
Processing, pp. 224–238. doi: https://doi.org/10.1007/
978-3-642-13244-5_18.
Power, D. J. (2007) A Brief History of Decision Support
Systems, DSSResources.COM. Available at: http://dss
resources.com/history/dsshistory.html.
Samoladas, I. and Gousios, G. (2008) ‘The SQO-OSS quality
model: measurement based open source software
evaluation’, Open Source Development, Communities
and Quality. OSS 2008. IFIP – The International
Federation for Information Processing, 275, pp. 237–
248. doi: 10.1007/978-0-387-09684-1_19.
Santos, M. Y. and Ramos, I. (2006) Business Intelligence :
tecnologias da informação na gestão de conhecimento.
FCA - Editora de Informática. Available at:
https://repositorium.sdum.uminho.pt/handle/1822/619
8 (Accessed: 15 July 2017).
Tereso, M. and Bernardino, J. (2011) ‘Open source business
intelligence tools for SMEs’, in 6th Iberian Conference
on Information Systems and Technologies (CISTI), pp.
1–4. Available at: http://ieeexplore.ieee.org/stamp/
stamp.jsp?tp=&arnumber=5974187.
Wasserman (2014) OSSpal Model. Available at:
http://oss.sv.cmu.edu/presentations/WeekThree2014_
Wasserman.pdf (Accessed: 12 January 2018).
Wasserman, A. I. et al. (2017) ‘OSSpal: Finding and
Evaluating Open Source Software’, in Open Source
Systems: Towards Robust Practices, pp. 193–203. doi:
10.1007/978-3-319-57735-7.
ICE-B 2018 - International Conference on e-Business
196
