
Measuring Perceptual Similarity of Syntactically Generated Pictures
Nuru Jingili
1
, Sigrid Ewert
1
and Ian Sanders
2
1
School of Computer Science and Applied Mathematics, University of the Witwatersrand, Johannesburg, South Africa
2
School of Computing, University of South Africa, Florida, South Africa
Keywords:
Perceptual Similarity, Similarity Measures, Picture Grammars, Random Context, Bag Context, Spatial Color
Distribution Descriptor.
Abstract:
This paper shows how similar pictures can be generated using random and bag context picture grammars. An
online survey was conducted to determine the similarity of the pictures generated by the picture grammars.
Respondents were asked to rank pictures in order of similarity to the query picture. They were also asked
to rank galleries of pictures from those containing pictures that are most similar to those containing pictures
that are least similar. Furthermore, respondents were required to tell us how they determined the similarity
of the pictures contained in the galleries. We then compared perceptual similarity with a chosen similarity
measure — spatial color distribution descriptor (SpCD) — to determine if they are consistent. The spatial
color distribution descriptor has provided excellent results in determining the similarity of computer-generated
pictures, and so was seen as a good similarity measure for this research. The results show that there is a good
correlation between the SpCD and perceptual similarity although in some instances humans do make different
judgements.
1 INTRODUCTION
Determining picture similarity is a crucial element in
many applications that require the comparison of pic-
tures on different aspects, like color, texture, layout,
and theme. Applications like search engines, picture
database retrieval systems, picture generators and vi-
sual password schemes are some of the applications
that may require determining the degree of similarity
of pictures (Okundaye et al., 2013; Goldberger et al.,
2003).
The problem with many picture retrieval systems
is analyzing the relationship between how humans
perceive similarity (perceptual similarity) and appro-
aches used in content based image retrieval (CBIR).
Humans judge the similarity of pictures by conside-
ring many features like color, semantics, luminance,
texture and objects in the picture (Yamamoto et al.,
1999; Zhou and Huang, 2003; Li et al., 2003; Neu-
mann and Gegenfurtner, 2006). Most CBIR systems
are based on one or more of these features. Mathema-
tically based similarity measures are capable of fin-
ding similar pictures, but people may not find those
pictures to be similar. Also, different people can have
conflicting opinions on the similarity of a given set of
pictures. Thus it is important, in some applications, to
determine if the mathematical similarity measures on
pictures in some set correspond with the human per-
ceptual similarity measures applied to the same set of
pictures.
Determining picture similarity is very important
for our research as we focus on generating similar
pictures using bag context picture grammars (BCPGs)
(Ewert et al., 2017; Mpota, 2018) and random context
picture grammars (RCPGs) (Ewert, 2009). An end
goal of our work is in generating visual passwords,
and appropriate distractors (pictures which are similar
to the password picture) for a visual password system
and it is thus necessary to evaluate if the generated
pictures are similar.
In this work we generate similar pictures using
BCPGs and RCPGs. We analyze how humans per-
ceive the similarity of these generated pictures. Lastly
we evaluate if perceptual similarity is consistent with
the chosen mathematical similarity measure, the spa-
tial color distribution descriptor (SpCD) (Chatzichris-
tofis et al., 2010). The SpCD is a compact composite
descriptor which combines color and spatial color dis-
tribution information (Chatzichristofis et al., 2010).
This color model was observed as providing better re-
trieval results for syntactically generated pictures than
color correlograms in (Okundaye et al., 2013).
244
Jingili, N., Ewert, S. and Sanders, I.
Measuring Perceptual Similarity of Syntactically Generated Pictures.
DOI: 10.5220/0006906502440255
In Proceedings of 8th International Conference on Simulation and Modeling Methodologies, Technologies and Applications (SIMULTECH 2018), pages 244-255
ISBN: 978-989-758-323-0
Copyright © 2018 by SCITEPRESS – Science and Technology Publications, Lda. All rights reserved

We conducted an online survey to determine how
humans determine the similarity of syntactically ge-
nerated pictures and to determine if the human view
of similarity is consistent with the selected mathema-
tical similarity measure. The results of the online sur-
vey are then compared with the results of applying
the SpCD to the same pictures. We used cumulative
discounted gain (DCG) to evaluate the consistency of
ranking of perceptual similarity and the SpCD.
The rest of the paper is structured as follows:
Section 2 presents the background information on
perceptual similarity, picture grammars and the spa-
tial color distribution descriptor. Section 3 presents
the results of the online survey and the spatial color
distribution descriptor in measuring the similarity of
some pictures. Section 4 presents the evaluation of
the results, and Section 5 provides the conclusion.
2 BACKGROUND
2.1 Perceptual Similarity
To understand visual perception, several researchers
have tried to support their findings of mathematical
similarity measures with human perception. For ex-
ample, (Kiranyaz et al., 2010) tried to model the hu-
man perception of color. They observed that the hu-
man eye could not distinguish close colors well or
identify a broad number of colors. Thus they sho-
wed that humans only use a few outstanding colors
to judge similarity. In their research, they “have pre-
sented a systematic approach to extract such a per-
ceptual (color) descriptor and then proposed an effi-
cient similarity metric to achieve the highest discri-
mination power possible for color-based retrieval in
general-purpose image databases”. Moreover, (Ya-
mamoto et al., 1999) conducted an experiment to eva-
luate the correlation between the similarity function
and human perception. In addition, (Okundaye et al.,
2014) conducted an online survey in which they re-
quired respondents to arrange pictures in the order of
similarity to a given picture. This was important for
their research, as the generated pictures were for a vi-
sual password system.
2.2 Picture Grammars
The pictures used in this study were generated using
syntactic methods of picture generation, in particu-
lar bag context picture grammars and random context
picture grammars. Both grammar classes are context-
free grammars with regulated rewriting. In an RCPG
each production rule has two sets of variables, the so-
called permitting and forbidding context sets, which
regulate the application of the rule during a deriva-
tion. A BCPG has a k-tuple of integers, called the
bag, which regulates the application of rules during
a derivation and changes during a derivation. Formal
definitions of BCPGs and RCPGs are given below.
2.3 Definitions
In this section, we present notation and definitions.
In particular, we define bag context picture gram-
mars and random context picture grammars. Many of
the definitions are from (Drewes et al., 2008; Ewert,
2009; Ewert et al., 2017), and have been modified
where appropriate.
2.3.1 Preliminaries
Let N =
{
0, 1, 2, . . .
}
, N
+
=
{
1, 2, . . .
}
and Z =
{
. . . , −2, −1, 0, 1, 2, . . .
}
. The sets N ∪ {∞} and Z ∪
{−∞, ∞} are denoted by N
∞
and Z
∞
, respectively.
Moreover, for k ∈ N
+
, let [k] =
{
1, 2, . . . , k
}
.
Let k ∈ N
+
. If I = [k], then elements of Z
I
∞
(which
includes Z
I
) are written as k-tuples. On Z
I
∞
, addi-
tion, subtraction, and scalar multiplication are defi-
ned componentwise in the usual way. Similarly, ≤
denotes componentwise ordering. An element q of
Z
∞
which occurs in the place of a k-tuple, denotes the
k-tuple of the appropriate size with all components
equal to q.
2.3.2 Bag Context Picture Grammars
Bag context picture grammars generate pictures using
productions of the form in Figure 1, where A is a
variable, x
11
, x
12
, . . . , x
mm
are variables or terminals
for m ∈ N
+
, and λ, µ and δ are k-tuples for some
k ∈ N
+
. The interpretation is as follows: if a deve-
loping picture contains a square labelled A and if the
bag is within the range defined by the lower limit λ
and upper limit µ of the rule, then the square label-
led A may be divided into equal squares with labels
x
11
, x
12
, . . . , x
mm
and the bag adjusted with δ.
We denote a square by a lowercase Greek let-
ter, eg., (A, α) denotes a square α labelled A. If α
is a square, then α
11
, α
12
, . . . , α
mm
denote the equal
subsquares into which α can be divided, with, eg.,
α
11
denoting the bottom left one.
Definition 1. A bag context picture grammar G =
(V
N
, V
T
, P, (S, σ), I, β
0
) has a finite alphabet V of la-
bels, consisting of disjoint subsets V
N
of variables and
V
T
of terminals. P is a finite set of production rules.
There is an initial labelled square (S, σ) with S ∈ V
N
.
Measuring Perceptual Similarity of Syntactically Generated Pictures
245

A −→
x
m1
x
m2
. . . x
mm
. . . . . . . . . . . .
x
21
x
22
. . . x
2m
x
11
x
12
. . . x
1m
(λ, µ;δ)
Figure 1: Production in BCPG.
Finally, I denotes a finite bag index set and β
0
∈ Z
I
the initial bag.
A rule in P is of the form
A → [x
11
, x
12
, . . . , x
mm
] (λ, µ;δ), m ∈ N
+
, where
A ∈ V
N
,
{
x
11
, x
12
, . . . , x
mm
}
⊆ V , λ, µ ∈ Z
I
∞
, and
δ ∈ Z
I
. The k-tuples λ and µ are the lower and upper
limits respectively, while δ is the bag adjustment.
Definition 2. A pictorial form is any finite set of non-
overlapping labelled squares in the plane. The size of
a pictorial form Π is the number of squares contained
in it, denoted |Π|. If Π is a pictorial form, we denote
by l(Π) the set of labels used in Π.
Definition 3. Let G = (V
N
, V
T
, P, (S, σ), I, β
0
) be a
BCPG, Π and Γ pictorial forms, and β, β
0
∈ Z
I
∞
.
Then we write (Π, β) =⇒ (Γ, β
0
) ∈
∏
×Z
I
∞
. There
is a derivation step from (Π, β) to (Γ, β
0
) if there is
a production A → [x
11
, x
12
, . . . , x
mm
] (λ, µ;δ) in P, Π
contains a labelled square (A, α), λ ≤ β ≤ µ, Γ = (Π\
{
(A, α)
}
) ∪
{
(x
11
, α
11
), (x
12
, α
12
), . . . , (x
mm
, α
mm
)
}
,
and β
0
= β + δ. We denote the derivation step by
(Π, β) =⇒ (Γ, β
0
). As usual, =⇒
∗
denotes the
reflexive transitive closure of =⇒.
Definition 4. The (bag context) gallery generated
by a BCPG G = (V
N
, V
T
, P, (S, σ), I, β
0
) is the set
G(G) = {Φ
|
({(S, σ)}, β
0
) =⇒
∗
(Φ, β), with l(Φ) ⊆
V
T
and β ∈ Z
I
∞
}. An element of G(G) is called a pic-
ture.
Definition 5. Let Φ be a picture in the square σ. For
any m ∈ N
+
, let σ be divided into equal subsquares,
say σ
11
, σ
12
, . . . , σ
mm
. A subpicture Ψ of Φ is any
subset of Φ that fills a square σ
i j
, with i, j ∈ [m], i.e.,
the union of all the squares in Ψ is the square σ
i j
; Ψ
is called a proper subpicture of Φ if Ψ 6= Φ.
In the following, we give a brief example of a
BCPG. Detailed examples of BCPGs and bag context
galleries can be found in (Ewert et al., 2017; Mpota,
2018).
Example 1. Consider the BCPG G
carpet
= (V
N
,-
V
T
, P, (S, σ), [8], (1, 0, 0, 0, 0, 0, 0, 0)), where V
N
=
{
S, T, U, F, C
}
, V
T
=
{
w, b, g
}
and P is the set of ru-
les in Figure 2. Terminals w, b and g represent white,
purple and green circles, respectively.
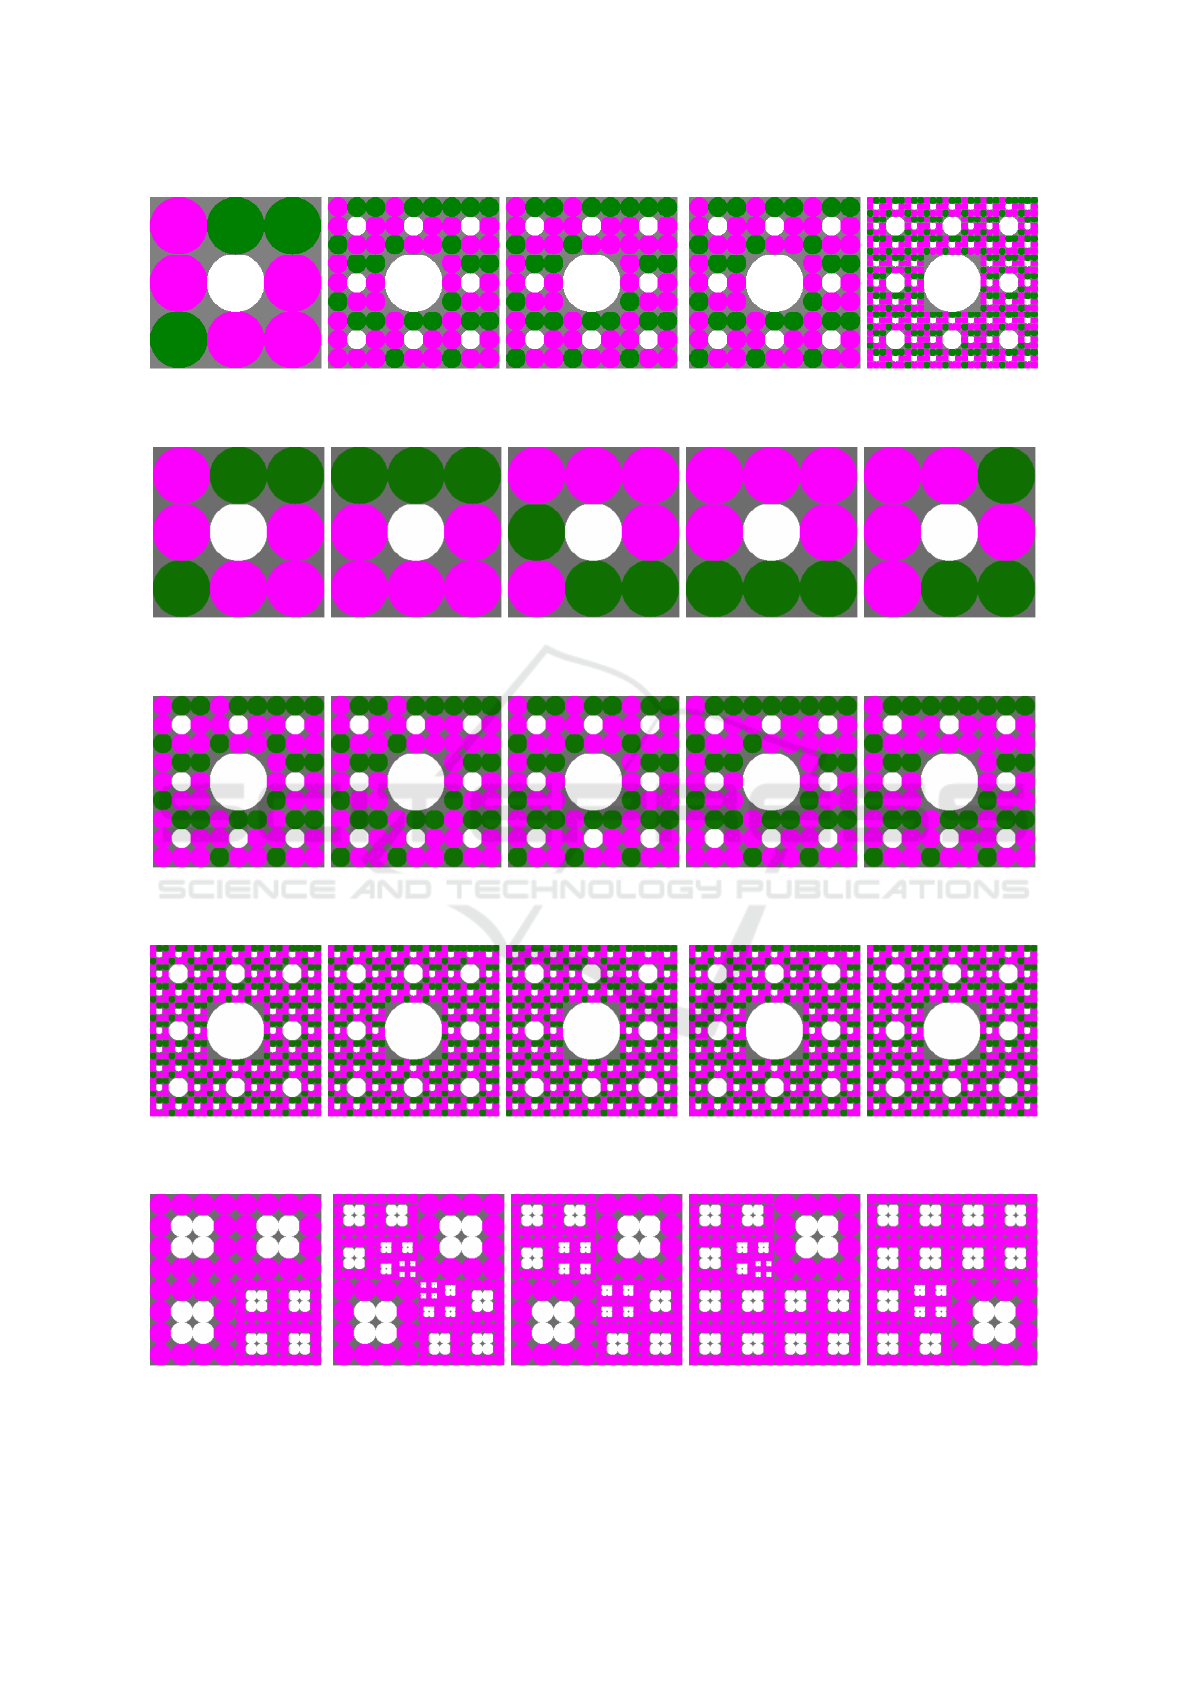
G
carpet
generates a variation on the sequence of
pictures approximating the Sierpi
´
nski carpet (Bhika
et al., 2007). The corresponding gallery contains,
amongst others, the pictures in Figures 4–7.
Rule 2 divides every square labelled S into nine
equal subsquares, eight of which are labelled T and
the central one w. All occurrences of T can turn
into U (Rule 3) and then S again (Rule 6). Therefore
the initial square is divided into increasingly smaller
subsquares. All subsquares are of the same size, apart
from those that are labelled by the terminal w. The
cycle of rules, Rules 2–3–6–2 . . . cannot be repeated
arbitrarily often. On the contrary, Rule 3 can be app-
lied maximally 72 times, as bag position 8 of the up-
per limit is set to 71. Therefore the subsquares cannot
become arbitrarily small.
Once this cycle has stopped, every label T is even-
tually turned into C, which becomes one of b, g or C
in a specific order. Consider Rules 8, 9 and 10. Rule 8
has to be applied exactly five times before Rule 9 can
be applied. Similarly, Rule 9 has to be applied exactly
three times before Rule 10 can be applied. The latter
rule resets the counters for terminals b and g (bag po-
sitions 6 and 7) to zero. Once Rule 10 has been app-
lied exactly once, Rule 8 is enabled again. This cycle
is enforced by positions 6 and 7 of the lower and up-
per limits in these rules. This ensures that, for every
white circle on the lowest level of refinement, there
are five purple and three green circles.
2.3.3 Random Context Picture Grammars
Random context picture grammars generate pictures
using productions of the form in Figure 3, where A is
a variable, x
11
, x
12
, . . . , x
mm
are variables or terminals
for m ∈ N
+
, and P and F are sets of variables. The
interpretation is as follows: if a developing picture
contains a square labelled A and if all variables of P
SIMULTECH 2018 - 8th International Conference on Simulation and Modeling Methodologies, Technologies and Applications
246

S → [T, T, T, T, w, T, T, T, T ]((1, 0, 0, 0, 0, 0, 0, 0), (∞, ∞, 0, ∞, ∞, ∞, ∞, ∞); (1)
(−1, 8, 0, 0, 0, 0, 0, 0)) (2)
T → U ((0, 1, 0, 0, 0, 0, 0, 0), (0, ∞, ∞, 0, ∞, ∞, ∞, 71); (0, −1, 1, 0, 0, 0, 0, 1))
|
(3)
F ((0, 1, 0, 0, 0, 0, 0, 0), (0, ∞, 0, 0, ∞, ∞, ∞, 0);(0, −1, 0, 1, 0, 0, 0, 0))
|
(4)
C ((0, 1, 0, 1, 0, 0, 0, 0) , ∞; (0, −1, 0, 0, 1, 0, 0, 0)) (5)
U → S ((0, 0, 1, 0, 0, 0, 0, 0), (∞, 0, ∞, ∞, ∞, ∞, ∞, ∞); (1, 0, −1, 0, 0, 0, 0, 0)) (6)
F → C ((0, 0, 0, 1, 0, 0, 0, 0), (∞, 0, ∞, ∞, ∞, ∞, ∞, ∞); (0, 0, 0, −1, 1, 0, 0, 0)) (7)
C → b ((0, 0, 0, 0, 1, 0, 0, 0), (∞, ∞, ∞, ∞, ∞, 4, ∞, ∞); (0, 0, 0, 0, −1, 1, 0, 0))
|
(8)
g((0, 0, 0, 0, 1, 5, 0, 0), (∞, ∞, ∞, ∞, ∞, ∞, 2, ∞);(0, 0, 0, 0, −1, 0, 1, 0))
|
(9)
C ((0, 0, 0, 0, 1, 5, 3, 0) , ∞; (0, 0, 0, 0, 0, −5, −3, 0)) (10)
Figure 2: Rules for grammar G
carpet
.
and none of F appear as labels of squares in the pic-
ture, then the square labelled A may be divided into
equal squares with labels x
11
, x
12
, . . . , x
mm
.
Definition 6. A random context picture grammar
G = (V
N
, V
T
, P, (S, σ)) has a finite alphabet V of la-
bels, consisting of disjoint subsets V
N
of variables and
V
T
of terminals. P is a finite set of productions of
the form A → [x
11
, x
12
, . . . , x
mm
](P ; F ) with m ∈ N
+
,
where A ∈ V
N
, x
11
, x
12
, . . . , x
mm
∈ V and P , F ⊆ V
N
.
Finally, there is an initial labelled square (S, σ) with
S ∈ V
N
.
Definition 7. For an RCPG G and pictorial forms
Π and Γ, we write Π =⇒ Γ if there is a pro-
duction A → [x
11
, x
12
, . . . , x
mm
](P ; F ) in G, Π con-
tains a labelled square (A, α), l(Π\
{
(A, α)
}
) ⊇ P and
l(Π \
{
(A, α)
}
) ∩ F =
/
0, and Γ = (Π \
{
(A, α)
}
) ∪
{
(x
11
, α
11
), (x
12
, α
12
), . . . , (x
mm
, α
mm
)
}
. As above,
=⇒
∗
denotes the reflexive transitive closure of =⇒.
Definition 8. The (random context) gallery G(G)
generated by a grammar G = (V
N
, V
T
, P, (S, σ)) is
{
Φ
|
{(S, σ)} =⇒
∗
Φ and l(Φ) ⊆ V
T
}
. An element
of G(G) is called a picture.
Examples of RCPGs and random context galleries
can be found in (Ewert, 2009). It has been shown that
every RCPG can be written as a BCPG (Ewert et al.,
2017; Mpota, 2018).
2.4 Spatial Color Distribution
Descriptor
One of the key elements in this research is to deter-
mine the similarity of the generated pictures. There
are many content based image retrieval systems that
measure the similarity of pictures based on different
features, like color, texture, content and layout. The
main feature of the pictures generated in this research
is color, and hence color descriptors were considered
more appropriate. There exist many color descriptors
for measuring similarity. We have considered several
CBIR systems and decided to use the spatial color
distribution descriptor (Chatzichristofis et al., 2010),
since (Okundaye et al., 2013) observed that the SpCD
provided better retrieval results for syntactically gene-
rated pictures than correlograms (Huang et al., 1997),
color histograms (Swain and Ballard, 1991) or other
color features. Although tree edit distance, which was
introduced in (Pawlik and Augsten, 2011), was found
to generate good results for pictures generated by tree
grammars (Okundaye et al., 2013), we chose not to
use it, as the pictures in this research were not ge-
nerated using tree grammars. There also exist many
CIBR systems that include spatial information. The
SpCD is a compact composite descriptor which com-
bines color and spatial color distribution (Chatzichris-
tofis et al., 2010). This descriptor is suitable for colo-
red pictures that contain a small number of colors and
texture regions, eg., hand-drawn sketches and colored
graphics such as the ones generated by picture gram-
mars. We calculated similarity according to this des-
criptor with the Img(Rummager) application (Chat-
zichristofis et al., 2009).
3 RESULTS
For this research, it is important to measure if per-
ceptual similarity correlates to the SpCD, because we
need to be sure that the results from the mathematical
measure reflect what people think. For this, we con-
ducted an online survey to evaluate the level of con-
sistency between perceptual similarity and the SpCD.
We obtained 408 responses through the online sur-
vey. Most of the respondents were staff members or
students from the University of the Witwatersrand, Jo-
hannesburg. Other respondents were contacts of the
Measuring Perceptual Similarity of Syntactically Generated Pictures
247

A −→
x
m1
x
m2
. . . x
mm
. . . . . . . . . . . .
x
21
x
22
. . . x
2m
x
11
x
12
. . . x
1m
(P ; F )
Figure 3: Production in RCPG.
authors.
The survey contained the following points:
Ranking of Pictures in Gallery: We showed the re-
spondents the galleries in Figures 4–10. For each
gallery a respondent had to rank the pictures in the
gallery in terms of how similar they felt the pic-
ture was to a given picture, in particular the pic-
ture with label (c) in each gallery. In the ranking,
the value 1 was given to the most similar picture
and 5 to the least similar picture. The picture (c)
was used both as the query picture and as a picture
in the gallery to check for outliers.
Similarity of Pictures in Gallery: For Figures 4–
10, we asked respondents to select the statement
that best described the similarity of the pictures in
that gallery. The statements were:
• not at all similar,
• somehow similar,
• similar,
• very similar, and
• identical.
Ranking of Galleries: For Figures 4–7 and Figu-
res 8–10, respectively, we asked respondents to
rank the galleries from the gallery with the pictu-
res that are most similar to each other to the gal-
lery with the pictures that are least similar to each
other.
Factors that Determine Similarity: We asked re-
spondents which factor they considered the most
important when determining the similarity of the
pictures in a gallery. We provided them with the
following options:
• colors present in the picture,
• distribution of the colors in the picture,
• objects in the picture,
• distribution of the objects in the picture, and
• other (specify).
3.1 Ranking of Pictures in Gallery
As stated above, picture (c) was used as the query pic-
ture in each gallery, i.e., all pictures were compared to
picture (c) to determine their similarity to it.
The results of the SpCD and the online survey are
presented in Tables 1–7. Each table is structured as
follows:
Rank: The first column presents the picture ranking
from 1 (most similar) to 5 (least similar).
SpCD: The second column presents the SpCD. It is
divided into two columns, the first giving the pic-
ture label and the second its SpCD value.
Perceptual: The third column presents the percep-
tual similarity. It is divided into two columns,
the first giving the picture label and the second
its average perceptual ranking.
The average perceptual ranking (or score) AV over
all the respondents was calculated as:
AV =
∑
n
i
w
i
x
i
∑
n
i
x
i
, (11)
where
• n is the number of ranks,
• w
i
is the weight of the rank, where the picture
that was ranked as the most similar is given the
weight of 5 and the least similar picture is given
the weight of 1, and
• x
i
is the number of responses for each possible
answer.
For the ranking according to the SpCD, the picture
with the smallest value is the most similar to the query
picture, while the picture with the largest value is the
least similar to the given picture. On the other hand,
for the ranking according to the perceptual similarity,
the picture with the largest value is the most similar
to the query picture and the picture with the smallest
value the least similar.
SIMULTECH 2018 - 8th International Conference on Simulation and Modeling Methodologies, Technologies and Applications
248
(a) (b) (c) (d) (e)
Figure 4: Gallery A: Sierpi
´
nski carpet, different refinements.
(a) (b) (c) (d) (e)
Figure 5: Gallery B: Sierpi
´
nski carpet, first refinement.
(a) (b) (c) (d) (e)
Figure 6: Gallery C: Sierpi
´
nski carpet, second refinement.
(a) (b) (c) (d) (e)
Figure 7: Gallery D: Sierpi
´
nski carpet, third refinement.
(a) (b) (c) (d) (e)
Figure 8: Gallery E: Flowers.
Measuring Perceptual Similarity of Syntactically Generated Pictures
249
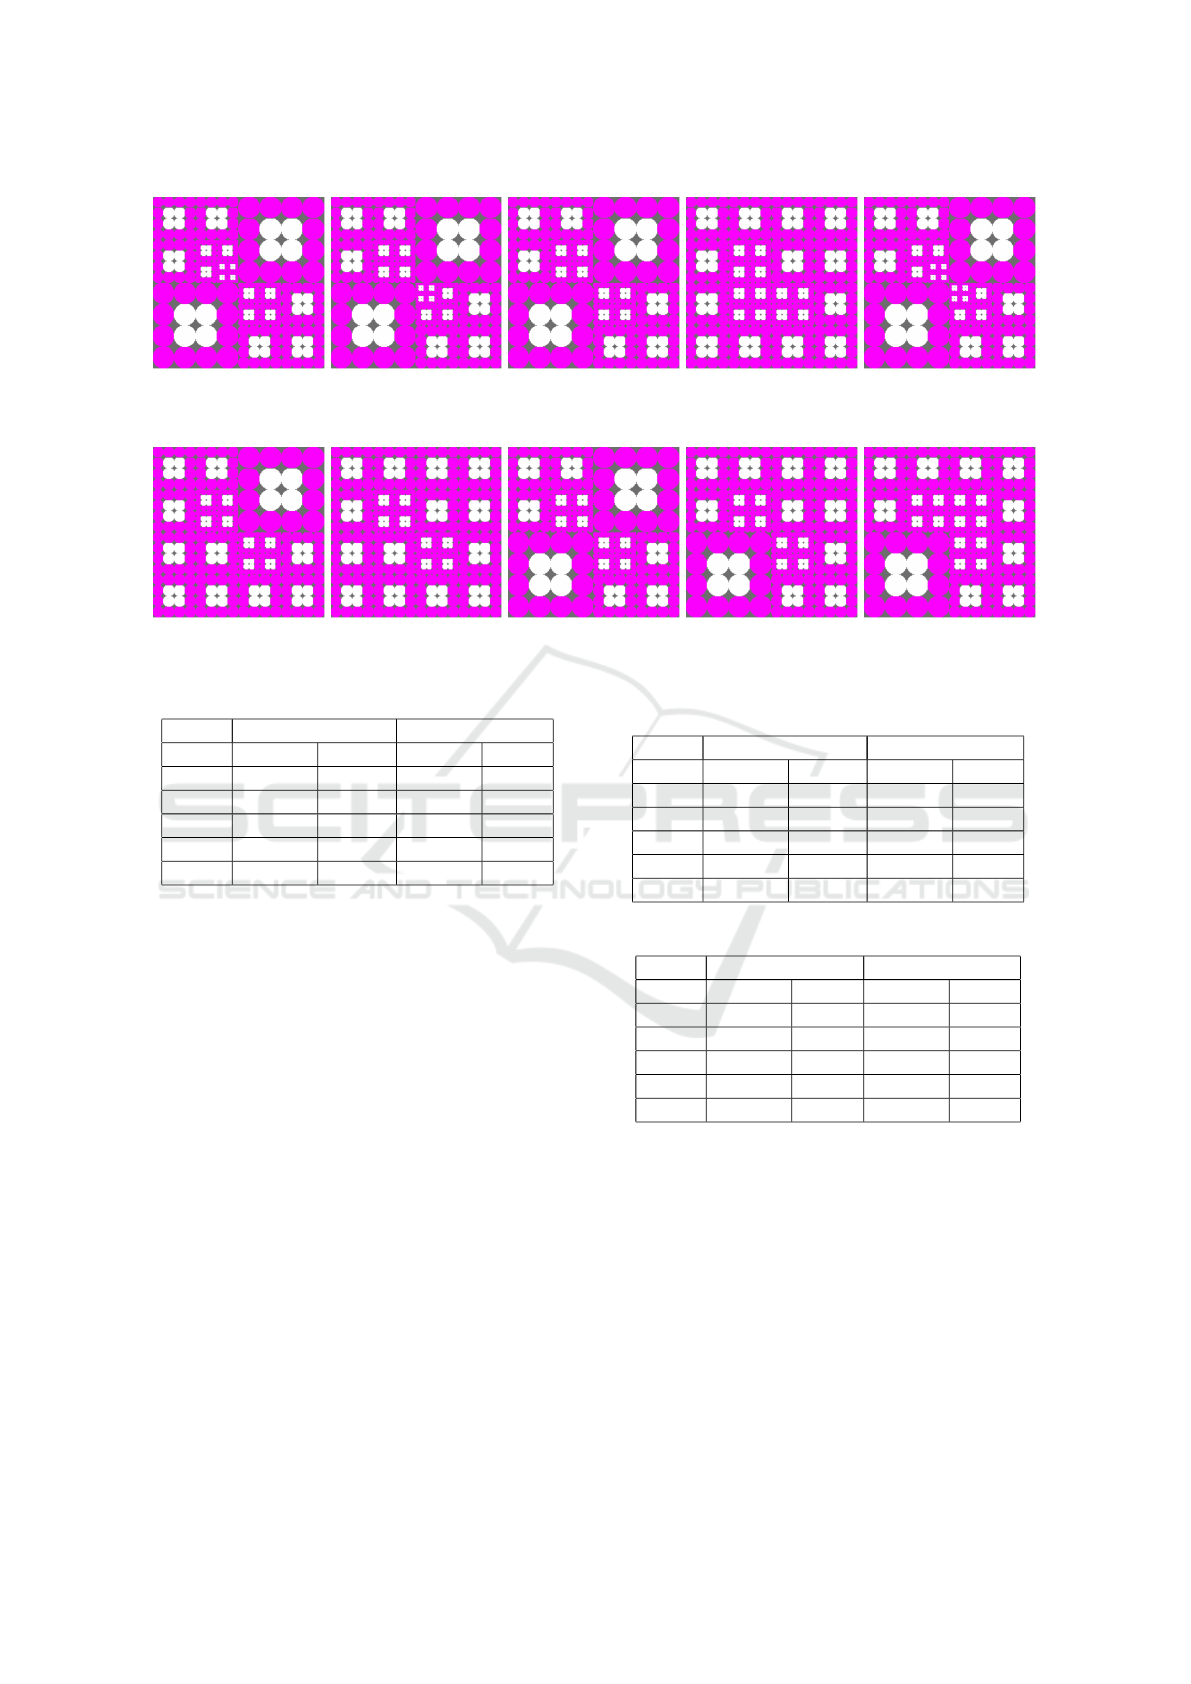
(a) (b) (c) (d) (e)
Figure 9: Gallery F: Flowers.
(a) (b) (c) (d) (e)
Figure 10: Gallery G: Flowers.
Table 1: Similarity of Figure 4(c) to pictures in Figure 4.
SpCD Perceptual
Rank Picture Value Picture Score
1 c 0 c 4.53
2 d 1.932 b 3.80
3 b 2.782 d 3.31
4 e 8.601 e 1.89
5 a 33.425 a 1.62
The SpCD values and the average perceptual ran-
king cannot be compared directly, because they use
different unit measures. We therefore compare the
ranking of the pictures by the two measures.
In the following, each of Tables 1–7 is discussed
briefly.
Consider Table 1, which gives the results for Gal-
lery A in Figure 4. For this gallery, the SpCD is to
a degree consistent with human perceptual similarity
as three of the five pictures were ranked the same for
both similarity measures.
Consider Table 2, which gives the results for Gal-
lery B in Figure 5. For this gallery, the SpCD is to
a degree consistent with human perceptual similarity.
Three of the five pictures were ranked at the same po-
sitions. There is a small score difference of 0.17 in
the perceptual similarity of the remaining two pictu-
res, implying that respondents found these pictures to
be very similar.
Consider Table 3, which gives the results for Gal-
lery C in Figure 6. For this gallery, the SpCD is to
a degree consistent with human perceptual similarity.
Both measures ranked the first picture on the same po-
sition. However, there is a difference at Ranks 2 and
Table 2: Similarity of Figure 5(c) to pictures in Figure 5.
SpCD Perceptual
Rank Picture Value Picture Score
1 c 0 c 4.79
2 d 23.437 e 3.00
3 e 30.126 d 2.83
4 a 67.653 a 2.79
5 b 73.297 b 1.59
Table 3: Similarity of Figure 6(c) to pictures in Figure 6.
SpCD Perceptual
Rank Picture Value Picture Score
1 c 0 c 4.67
2 a 2.394 b 3.51
3 b 3.426 a 3.30
4 e 4.830 d 1.83
5 d 5.291 e 1.79
3. Both measures place pictures (a) and (b) at these
ranks, but in different orders. However, the difference
of the weighted score of 0.21 suggests that respon-
dents found these pictures to be very similar. There
is a similar situation at Ranks 4 and 5. Both mea-
sures place pictures (d) and (e) at these ranks, but in
different orders. Also in this case, the difference of
the weighted score of 0.04 suggests that respondents
found these pictures to be very similar.
Consider Table 4, which gives the results for Gal-
lery D in Figure 7. It shows no correlation between
the two measures. In fact, the ranking of the pictu-
res in the online survey suggests that the respondents
SIMULTECH 2018 - 8th International Conference on Simulation and Modeling Methodologies, Technologies and Applications
250

Table 4: Similarity of Figure 7(c) to pictures in Figure 7.
SpCD Perceptual
Rank Picture Value Picture Score
1 c 0 d 4.13
2 e 0 b 3.76
3 a 0.433 c 3.29
4 b 0.433 a 2.62
5 d 0.433 e 1.39
Table 5: Similarity of Figure 8(c) to pictures in Figure 8.
SpCD Perceptual
Rank Picture Value Picture Score
1 c 0 c 4.68
2 b 0 b 3.97
3 d 0.894 a 2.51
4 a 0.907 d 2.24
5 e 1.865 e 1.63
were not able to tell the difference between the pictu-
res. For example, the respondents ranked Figure 7(c),
which is the query picture, third instead of first. This
might be because the pictures in this gallery have very
small subpictures, which might have made it difficult
for respondents to distinguish one picture from anot-
her. It is worth noting that the SpCD values for this
gallery are very small, and that the difference between
values in Table 4 is small compared to that in Tables 1,
2 and 3. Moreover, we observe that the SpCD could
not measure the difference between pictures which
are different. For example, it ranked pictures (c) and
(e) as identical, and similarly pictures (a), (b) and (d).
We assume the underlying reason is that the SpCD
cannot measure the difference between pictures that
have such small subpictures.
Consider Table 5, which gives the results for Gal-
lery E in Figure 8. For this gallery, the SpCD is to
a degree consistent with human perceptual similarity.
Three pictures were ranked the same by both measu-
res. The measures differed at Ranks 3 and 4. Ho-
wever, the difference of the weighted score of 0.27
suggests that respondents found these pictures to be
very similar.
Consider Table 6, which gives the results for Gal-
lery F in Figure 9. In this case, the SpCD is consis-
tent with human perceptual similarity as both measu-
res ranked the pictures in the same order.
Consider Table 7, which gives the results for Gal-
lery G in Figure 10. For this gallery, the SpCD is to
a degree consistent with human perceptual similarity.
Two pictures, namely pictures (c) and (b), were ran-
ked the same by both measures. Moreover, both me-
asures ranked picture (d) higher than picture (e). Ho-
wever, human perceptual similarity ranked picture (a)
higher than pictures (d) and (e) whereas the SpCD
Table 6: Similarity of Figure 9(c) to pictures in Figure 9.
SpCD Perceptual
Rank Picture Value Picture Score
1 c 0 c 4.63
2 a 0 a 3.48
3 b 0 b 3.31
4 e 0 e 2.44
5 d 1.276 d 1.31
Table 7: Similarity of Figure 10(c) to pictures in Figure 10.
SpCD Perceptual
Rank Picture Value Picture Score
1 c 0 c 4.76
2 d 0 a 3.46
3 e 0.610 d 2.95
4 a 0.625 e 1.97
5 b 0.625 b 1.81
ranked picture (a) lower than pictures (d) and (e). Mo-
reover, the SpCD assigned pictures (a) and (b) the
same values, whereas perceptual similarity did not
consider these pictures to be identical.
3.2 Similarity of Pictures in Gallery
In the second section of the survey, respondents were
shown Figures 4–10 and asked to select the statement
that best described the similarity of the pictures within
that gallery. The options were: not at all similar,
somehow similar, similar, very similar, and identical.
Consider Table 8, which shows how humans eval-
uated the similarity of the pictures within each gal-
lery. The value 1 indicates that the pictures are not
at all similar, while 5 indicates that the pictures are
identical. All the values in Table 8 are higher than 1,
which implies that the respondents found the pictures
to be similar to some degree. The highest values are
for Galleries C and D in Figures 6 and 7, which im-
plies that the respondents considered these galleries to
have the pictures that are most similar to each other.
Table 8: Perception of similarity of pictures in each gallery.
Rank Gallery Perceptual value
1 A 1.82
2 B 2.40
3 C 3.12
4 D 3.64
5 E 2.17
6 F 2.66
7 G 2.24
Measuring Perceptual Similarity of Syntactically Generated Pictures
251

Table 9: Ranking of galleries in Figures 4–7 according to
similarity of pictures in gallery.
Rank Gallery Perceptual value
1 D 3.64
2 C 3.12
3 B 2.40
4 A 1.82
3.3 Ranking of Galleries
In the third section of the survey, respondents were as-
ked to rank the galleries in Figures 4–7 and Figures 8–
10, respectively, from the gallery containing pictures
that are most similar to each other to the gallery con-
taining pictures that are least similar to each other.
Consider Table 9, which gives the results for Fi-
gures 4–7. Humans ranked Gallery D in Figure 7 hig-
hest, i.e., as the gallery with pictures that are most
similar to each other. This view correlates with the
SpCD measures for this gallery (Table 4), which are
very low (0 or 0.433), which implies that the pictures
are very similar to the query picture and each other.
Humans ranked Gallery C in Figure 6 second. This
view correlates with the SpCD measures for this gal-
lery (Table 3), which are the second lowest for the
four galleries under consideration. Humans ranked
Gallery A in Figure 4 last, i.e., as the gallery with pic-
tures that are least similar to each other. This does not
correlate with the SpCD measures for the four galle-
ries. The SpCD values are the highest for Gallery B in
Figure 5. Moreover, they differ a great deal from one
picture to another, implying that Figure 5 is the gal-
lery containing the least similar pictures. A possible
explanation for this discrepancy might be that humans
considered it important that the objects in Figure 5
have the same size, whereas the SpCD measures the
distribution of colors.
We observe that the SpCD values for Gallery A
(Table 1) differ greatly from one picture to another.
This implies dissimilarity between the pictures, but
these differences are not bigger than those for Gal-
lery B (Table 2), rather the opposite.
Consider Table 10, which gives the results for Fi-
gures 8–10. Humans ranked Gallery F in Figure 9
highest, i.e., as the gallery with pictures that are most
similar to each other. This view correlates with the
SpCD measures for this gallery (Table 6). Four pictu-
res have the value 0, which means that the SpCD me-
asure found them to be identical to the query picture.
The pictures are not identical, but this result shows
that both measures found these pictures to be very si-
milar. Humans ranked Gallery G in Figure 10 second.
This view correlates with the SpCD measures for this
gallery (Table 7), which are the second highest for the
Table 10: Ranking of galleries in Figures 8–10 according to
similarity of pictures in gallery.
Rank Gallery Perceptual value
1 F 2.66
2 G 2.24
3 E 2.17
three galleries under consideration. Humans ranked
Gallery E in Figure 8 third. This view correlates with
the SpCD measures for this gallery (Table 5), which
are the highest for the three galleries under considera-
tion.
3.4 Factors that Determine Similarity
In the last section of the survey, respondents were as-
ked which factor was most important to them when
determining the similarity of the pictures in a gallery.
Table 11 shows the factors that respondents conside-
red important, and the percentage of respondents for
each factor.
4 EVALUATION
Only one gallery, namely Gallery D in Figure 7, sho-
wed no correlation at all between the SpCD and per-
ceptual similarity in ranking the pictures. This gal-
lery was treated as an outlier as humans failed to rank
the picture which was used as the query picture cor-
rectly. One gallery, namely Gallery F in Figure 9,
had the same ranking for both the SpCD and percep-
tual similarity. For four galleries, namely the galleries
A–C and E (Figures 4–6 and 8), the correlation was
high, in that there were more pictures that were ran-
ked the same by both measures than pictures that were
not. In the remaining gallery, Gallery G in Figure 10,
there were more pictures that were ranked differently
by both measures than pictures that were ranked the
same.
It is important to evaluate the effectiveness of the
SpCD in representing perceptual similarity. Such
an evaluation will aid us in determining whether or
not the SpCD is consistent with perceptual similarity
and direct the future research. In this evaluation, we
use cumulative discounted gain (DCG) (J
¨
arvelin and
Kek
¨
al
¨
ainen, 2000), which evaluates the ranking of do-
cuments. The key feature in DCG is that highly rele-
vant documents should be ranked higher than the less
relevant ones. Since, in this survey, the main focus
was on the ranking of pictures, cumulative discoun-
ted gain was deemed to be the best method to evaluate
the consistency between perceptual similarity and the
SpCD. We furthermore present the evaluation by the
SIMULTECH 2018 - 8th International Conference on Simulation and Modeling Methodologies, Technologies and Applications
252
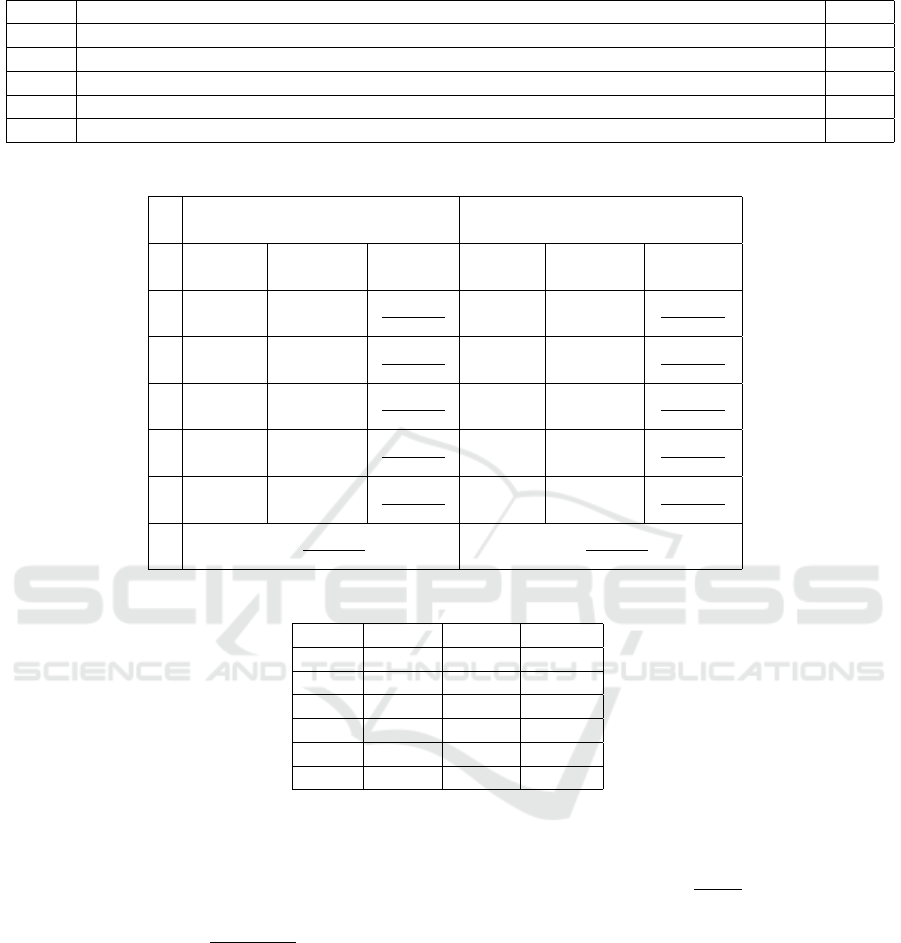
Table 11: Most important factor when determining similarity of pictures.
Rank Factor %
1 Distribution of the objects in the picture 46.46
2 Distribution of the colors in the picture 28.54
3 Objects in the picture 14.39
4 Colors present in the picture 6.31
5
Other: symmetry; both distribution of colors and objects in the picture; subshapes; patterns
4.29
Table 12: DCG calculation for Table 1.
SpCD (DCG) Perceptual (iDCG)
i Picture rating(i) DCG Picture rating(i) iDCG
1 c 5
5
log
2
(1+1)
c 5
5
log
2
(1+1)
2 d 3
3
log
2
(1+2)
b 4
4
log
2
(1+2)
3 b 4
4
log
2
(1+3)
d 3
3
log
2
(1+3)
4 e 2
2
log
2
(1+4)
e 2
2
log
2
(1+4)
5 a 1
1
log
2
(1+5)
a 1
1
log
2
(1+5)
DCG =
∑
5
i=1
rating(i)
log
2
(i+1)
= 10.138 iDCG =
∑
5
i=1
rating(i)
log
2
(i+1)
= 10.269
Table 13: NDCG results.
Table DCG iDCG NDCG
1 10.138 10.269 0.987
2 10.138 10.269 0.987
3 10.095 10.269 0.983
5 10.200 10.269 0.993
6 10.269 10.269 1.000
7 10.006 10.269 0.974
normalized cumulative discounted gain (NDCG) (Le
and Smola, 2007), which normalizes the values to lie
between 0 and 1, to aid the comparison.
The cumulative discounted gain for a given query
is
DCG =
n
∑
i=1
rating(i)
log
2
(1 + i)
, (12)
where
• n is the number of ranks,
• i is the rank of a picture from 1 (most similar to
the query picture) to 5 (least similar), and
• rating (i) is the value assigned to a picture accor-
ding to its perceptual similarity, from 5 (most si-
milar) to 1 (least similar).
The ideal cumulative discounted gain (iDCG) for
a given query is the DCG according to the perceptual
ranking.
The normalization (NDCG) is calculated by divi-
ding the DCG by the iDCG, i.e.,
NDCG =
DCG
iDCG
. (13)
For example, Table 12 gives the DCG calculation
for Table 1.
Table 13 presents the DCG and NDCG values for
Tables 1–7, except for the outlier Table 4. The average
NDCG is 0.987. The closer the NDCG value is to 1,
the higher the correlation between the ranking of the
pictures by the SpCD and by human perception.
5 CONCLUSION
In this paper we show how similar pictures can be ge-
nerated by bag context picture grammars and random
Measuring Perceptual Similarity of Syntactically Generated Pictures
253

context picture grammars. We then present the results
of an online survey that we conducted to determine
how humans determine the similarity of syntactically
generated pictures. We applied the spatial color distri-
bution descriptor to the same images and we present
results which compare the human view of similarity
to the selected mathematical similarity measure.
The humans seemed to have very different opini-
ons regarding the similarity of pictures. A reason may
be that different people compare pictures using diffe-
rent measures, some placing more emphasis on color
while others place more emphasis on objects. Ho-
wever, the majority of respondents agreed on the si-
milarity of individual pictures compared to the query
picture. Most respondents found the given galleries
of pictures to contain similar pictures which is very
important as this research is about the generation of
similar pictures. When comparing the results of the
survey with the results of the spatial color distribu-
tion descriptor similarity measure, perceptual simila-
rity seemed to correlate to the spatial color distribu-
tion descriptor measure. This implies that the spatial
color distribution descriptor can be used to judge the
similarity of pictures generated by bag context picture
grammars and random context picture grammars.
ACKNOWLEDGEMENT
This work is based upon research supported by the
National Research Foundation (NRF). Any opinion,
findings and conclusions or recommendations expres-
sed in this material are those of the authors and the-
refore the NRF does not accept liability in regard the-
reto.
REFERENCES
Bhika, C., Ewert, S., Schwartz, R., and Waruhiu, M. (2007).
Table-driven context-free picture grammars. Interna-
tional Journal of Foundations of Computer Science,
18(6):1151–1160.
Chatzichristofis, S. A., Boutalis, Y. S., and Lux, M. (2009).
Img(Rummager): An interactive content based image
retrieval system. In Proceedings of the Second Inter-
national Workshop on Similarity Search and Applica-
tions, SISAP ’09, pages 151–153, Washington, DC,
USA. IEEE Computer Society.
Chatzichristofis, S. A., Boutalis, Y. S., and Lux, M. (2010).
SpCD — spatial color distribution descriptor — A
fuzzy rule based compact composite descriptor ap-
propriate for hand drawn color sketches retrieval. In
ICAART 2010 - Proceedings of the International Con-
ference on Agents and Artificial Intelligence, volume
1 - Artificial Intelligence, pages 58–63.
Drewes, F., du Toit, C., Ewert, S., van der Merwe, B., and
van der Walt, A. (2008). Bag context tree grammars.
Fundamenta Informaticae, (86):459–480.
Ewert, S. (2009). Random context picture grammars: The
state of the art. In Drewes, F., Habel, A., Hoffmann,
B., and Plump, D., editors, Manipulation of Graphs,
Algebras and Pictures, pages 135–147. Hohnholt,
Bremen.
Ewert, S., Jingili, N., and Sanders, I. (2017). Bag context
picture grammars. Under review.
Goldberger, J., Gordon, S., and Greenspan, H. (2003).
An efficient image similarity measure based on ap-
proximations of KL-divergence between two Gaus-
sian mixtures. In Proceedings of the Ninth IEEE Inter-
national Conference on Computer Vision, pages 487–
493. IEEE.
Huang, J., Kumar, S., Mitra, M., Zhu, W.-J., and Zabih, R.
(1997). Image indexing using color correlograms. In
Proceedings of the 1997 IEEE Computer Society Con-
ference on Computer Vision and Pattern Recognition,
pages 762–768. IEEE Computer Society.
J
¨
arvelin, K. and Kek
¨
al
¨
ainen, J. (2000). IR evaluation met-
hods for retrieving highly relevant documents. In Pro-
ceedings of the 23rd Annual International ACM SIGIR
Conference on Research and Development in Informa-
tion Retrieval, SIGIR ’00, pages 41–48, New York,
NY, USA. ACM.
Kiranyaz, S., Birinci, M., and Gabbouj, M. (2010). Per-
ceptual color descriptor based on spatial distribution:
A top-down approach. Image and Vision Computing,
28(8):1309–1326.
Le, Q. V. and Smola, A. J. (2007). Direct optimization of
ranking measures. CoRR, abs/0704.3359.
Li, B., Chang, E., and Wu, Y. (2003). Discovery of a percep-
tual distance function for measuring image similarity.
Multimedia Systems, 8(6):512–522.
Mpota, L. (2018). Generating similar images using bag con-
text picture grammars. Master of Science Disserta-
tion, University of the Witwatersrand, Johannesburg,
School of Computer Science and Applied Mathema-
tics.
Neumann, D. and Gegenfurtner, K. R. (2006). Image retrie-
val and perceptual similarity. ACM Transactions on
Applied Perception (TAP), 3(1):31–47.
Okundaye, B., Ewert, S., and Sanders, I. (2013). Deter-
mining image similarity from pattern matching of ab-
stract syntax trees of tree picture grammars. In Pro-
ceedings of the Twenty-Fourth Annual Symposium of
the Pattern Recognition Association of South Africa,
pages 83–90. PRASA, RobMech, AfLaT.
Okundaye, B., Ewert, S., and Sanders, I. (2014). Perceptual
similarity of images generated using tree grammars.
In Proceedings of the Annual Conference of the South
African Institute for Computer Scientists and Informa-
tion Technologists (SAICSIT 2014), pages 286–296.
ACM.
Pawlik, M. and Augsten, N. (2011). RTED: A robust al-
gorithm for the tree edit distance. Proceedings of the
VLDB Endowment, 5(4):334–345.
SIMULTECH 2018 - 8th International Conference on Simulation and Modeling Methodologies, Technologies and Applications
254

Swain, M. J. and Ballard, D. H. (1991). Color indexing. In-
ternational Journal of Computer Vision, 7(1):11–32.
Yamamoto, H., Iwasa, H., Yokoya, N., and Takemura, H.
(1999). Content-based similarity retrieval of images
based on spatial color distributions. In Proceedings of
the 10th International Conference on Image Analysis
and Processing, pages 951–956. IEEE.
Zhou, X. S. and Huang, T. S. (2003). Relevance feedback in
image retrieval: A comprehensive review. Multimedia
Systems, 8(6):536–544.
Measuring Perceptual Similarity of Syntactically Generated Pictures
255
