
Variation of the EEG-Energy in a Second Language Class
Freddy L. Bueno-Palomeque
1
, Efr
´
en L. Lema-Condo
1
, Susana E. Castro-Villalobos
1,2
,
Luis J. Serpa-Andrade
1
and Esteban F. Ordo
˜
nez-Morales
1
1
Grupo de Investigaci
´
on en Ingenier
´
ıa Biom
´
edica GIIB-UPS, Universidad Polit
´
ecnica Salesiana, Cuenca, Ecuador
2
Departamento de Idiomas, Universidad Polit
´
ecnica Salesiana, Cuenca, Ecuador
Keywords:
Electroencephalographic Signals, Active Attention, Correlation, Signal Energy, Alpha Waves, Beta Waves.
Abstract:
The attention, concentration, and anxiety of the students are fundamental in the learning process of a second
language. This study proposes to register EEG signals during a second language class to quantify the energy
level of the EEG signal and associate it with the attention level along the time. Data was registered while
attending to a level 1 English language through 12 minutes. The signals were filtered using a wavelet transform
Symlet 6 to analyze two frequency bands: Alpha (8-16 Hz) and Beta (16-32 Hz). The results revealed an
increment in the energy on the electrodes AF3, AF4, F3, and F4 in the Alpha and Beta bands between 37.25 and
43.41% of the students, and a decrement between 25.49 and 43.13%. Finally, when analyzing the electrodes
T7 y T8, there were an increment of the energy in 35.30% of the students and decrements between 39.22 and
47.60% of theirs.
1 INTRODUCTION
The knowledge and domain of English as a second
language in Ecuador has presented a slight impro-
vement in the last year according to the English Pro-
fiency Index (EPI) presented by English First (EF)
in 2017, locating it in the 55th position, and consi-
dering it as a low domain category of the language
(First, 2017). The attention, concentration, memory,
and anxiety of the students is fundamental in the lear-
ning of a second language process; however, the made
efforts by the teachers to keep the students’ attention
during a class are quantified and related to each ot-
her using traditional tools as questionnaires, visual
manual reports, or monitoring the students behavior
through the use of information and communication
technologies (ICTs). Monitoring a class through vi-
deo recordings can provide information about the
students-teacher interaction with the finality of trai-
ning and preparing a teacher for a determined class
(Jamil et al., 2015); nevertheless, the behavior in a
class does not provide evidence of the attention level
that each student presents in the class.
The analysis of electroencephalographic signals
(EEG) recorded in people subjected to different ex-
ternal stimuli can reveal important information about
the neural processes involved in a learning process. A
physiological EEG signal can be recorded second by
second, accurately showing changes in attention, fa-
tigue or mental workload in practical work or study
environments (Berka et al., 2007). Determining the
level of attention of a user using EEG signals has a
wide range of applications such as the improvement
of a brain computer interface or from the perspective
of learning, for the development of linguistic skills,
where the attention given to a class is a fundamental
element of the process (Cohen et al., 1990; Aliakba-
ryhosseinabadi et al., 2017). In particular, the lear-
ning of a second language has been analyzed from
different perspectives, such as the influence of age on
learning (Kroll and Tokowicz, 2005), or the applica-
tion of emotions recognition systems, from another
perspective, seeking to reduce anxiety based on lan-
guage for better development of a conversation in the
class environment (Chen and Lee, 2011).
The use of a commercial and portable EEG sy-
stem is presented in (Poulsen et al., 2017), where the
inter-subject correlation of the signals generated by
observing a video in a real class is analyzed, demon-
strating that this method can be used in a commer-
cial system as biofeedback for the tutor. The imple-
mentation of neurofeedback on children with atten-
tion deficit is presented in (Kim et al., 2014) through
the analysis of the relationship between the relative
spectrum of Beta/Theta. Despite the fact that no sig-
nificant changes were observed in the EEG signal, the
effects of the neurofeedback treatment could be evi-
denced.
Bueno-Palomeque, F., Lema-Condo, E., Castro-Villalobos, S., Serpa-Andrade, L. and Ordoñez-Morales, E.
Variation of the EEG-Energy in a Second Language Class.
DOI: 10.5220/0006895800410045
In Proceedings of the 6th International Congress on Neurotechnology, Electronics and Informatics (NEUROTECHNIX 2018), pages 41-45
ISBN: 978-989-758-326-1
Copyright © 2018 by SCITEPRESS – Science and Technology Publications, Lda. All rights reserved
41

Figure 1: Diagram of the analysis proposal of EEG energy behavior with the passing of time.
Characterizing an EEG signal based on its fre-
quency, it is possible to establish the relation between
Alpha and Beta frequency bands and the subject’s at-
tention. Beta waves are associated with active thin-
king, active attention, solving critical problems, or fo-
cusing on the outside world, while Alpha waves are
associated with an effortless alert state and creativity
(Nidal and Malik, 2014). To examine the variation of
an EEG signal in a learning process, this study propo-
ses to analyze it during the development of a second
language class as a tool to identify the level of atten-
tion that a student has throughout the class, associa-
ting it with the energy level of the EEG signal.
2 MATERIALS AND METHODS
The data used in this study were obtained from 51 he-
althy male volunteers, with an age between 18 and
22 years (mean age 19.2 years) previously informed
about the objectives and scopes of the study. A data-
base of 51 EEG signals with a duration of 12 minutes
each was recorded, under the condition of open eyes
while attending a Level 1 English class for university
students based on the European common framework.
At the end of the class the students had to answer a
written standarized test according to the topics stu-
died. The EEG signals were recorded using an EMO-
TIV EPOC hardware (14 channels) and OPENVIBE
software, and then the signal analysis was developed
with MATLAB software. A 6-order Butterworth low
pass filter with a lower cutoff frequency of 1Hz and
a higher cutoff frequency of 45Hz was applied to the
stored EEG data. The artifacts higher and lower to ±
200 uV which werre detected in the signal were remo-
ved manually. The sampling frequency of the signals
was 128Hz and a Wavelet Sym 6 (Lema-Condo et al.,
2017) was applied with 5 levels of decomposition in
order to obtain four EEG bands distributed as follows:
Beta (16-32) Hz, Alpha (8-16) Hz, Theta (4-8) Hz and
Delta (0-4) Hz.
The location of 14 electrodes of the EMOTIV
EPOC equipment based on the 10/20 system is ob-
served in the Figure 1. Out of 14 electrodes, 6
have been considered: F3, F4, AF3, AF4, T7,
and T8. The average of 51 signals of 12 minu-
tes was calculated for every electrode (e.g., for AF3
X1
AF3
[n],X2
AF3
[n].....X51
AF3
, n representing each
element of the corresponding signal):
X
AF3
[n] =
1
51
51
∑
i=1
Xi
AF3
[n] (1)
and the energy analysis was performed with the Par-
seval Theorem:
AF3[n] =
N
∑
n=1
|X
AF3
[n]|
2
(2)
where AF3[n] is the energy of AF3, fragmenting
X
AF3
[n] into segments of 300 ms (N=38 samples). Fi-
nally, a linear regression was applied, and its slope
was obtained in order to identify the trend of Beta and
Alpha waves.
3 RESULTS
The correlation was calculated between the signals
and the time throughout of the 12 minutes of class
ranging from -1 as a negative relationship to 1 as a
positive relationship. Figure 2 shows the energy level
in the left hemisphere (F3, AF3, T7) on the Alpha and
Beta waves. The calculated correlation values were
statistically significant (p<0.05) in different percen-
tages on each electrode (Table 1).
Table 1: Statistically significance (p<0.05) of the calculated
correlation of Beta vs time and Alpha vs time.
Frequency AF3 F3 T7
Alpha 67% 45% 75%
Beta 51% 59% 63%
Similarly, the correlation between Alpha vs Beta
waves was calculated in order to interpret the relati-
onship of these two variables using the criterion sta-
blished in (Nidal and Malik, 2014); figure 3 repre-
sents its correlation value. The quadrant I (Q I) shows
NEUROTECHNIX 2018 - 6th International Congress on Neurotechnology, Electronics and Informatics
42
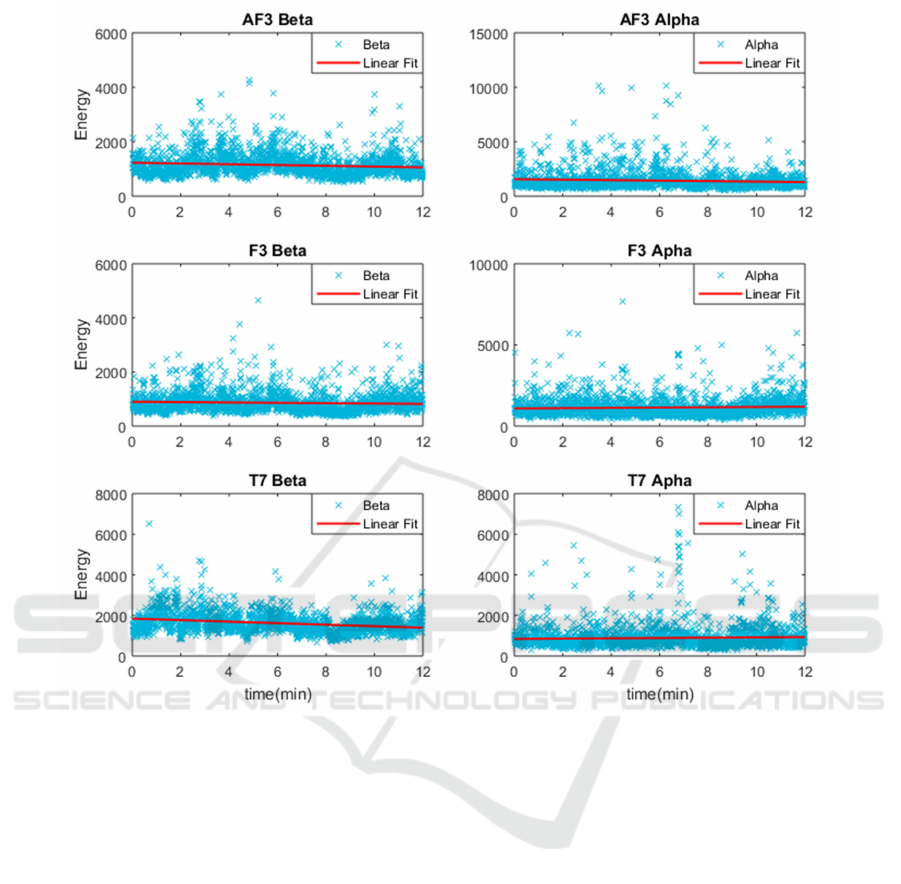
Figure 2: Energy and linear regression on electrodes AF3, F3, and T7, Beta and Alpha waves.
that the person has active attention, considering the
values of Beta waves and quiet according to the Alpha
waves. Quadrant II (Q II) indicates that the person
would be careful with respect to Beta but concerned
about Alpha. Also, quadrant III (Q III) shows that the
person is worried and stressed, finally quadrant IV (Q
IV) shows that the person is distracted with respect to
Beta but relaxed with reference to Alpha.
The correlation results of Alpha and Beta waves
are shown as a percentage in each quadrant in the Ta-
ble 1. Considering the relation of Alpha and Beta wa-
ves with different attention states, the Q I represents
an ideal learning scenario; the student would have
active attention and would be relaxed. Q II represents
a student segment who are not relaxed in class, possi-
bly due to lack of comprehension in a determine point
of the class. Q III represents the student worst scena-
rio because the student doesn’t pay attention and also
is stressed. Q IV show a student’s loss of attention;
however, he is relaxed. Taking in account that Q I
is the best learning scenario; the analysis showed in
this study would allow to the educator obtain biofeed-
back about the student’s attention level, which give
him the opportunity to take an adequate decision to
improve the class progress. It is important to observe
that adapting the methodology of teaching throughout
the class it is possible to move the student’s attention
to Q I. The results show that in terms of electrodes F3,
F4, AF3, and AF4, a larger number of students are in
the Q I; however, they are rounding the point of zero
correlation. This could be considered as a very slight
difference; however figure 2 allows to see through the
linear regression to tendency along the time, in order
to increase the evidence of energy change, more time
registered would be necessary in future studies. The
second bigger student’s group are in the Q III, oppo-
site to I. Electrodes T7 and T8, on the other hand,
show a major percentage of students in the Q III, fol-
lowed by the Q I.
Correlation of the signals energy with the time al-
lows to observe how the energy changes throughout
the time, considering Alpha and Beta waves. The
Variation of the EEG-Energy in a Second Language Class
43
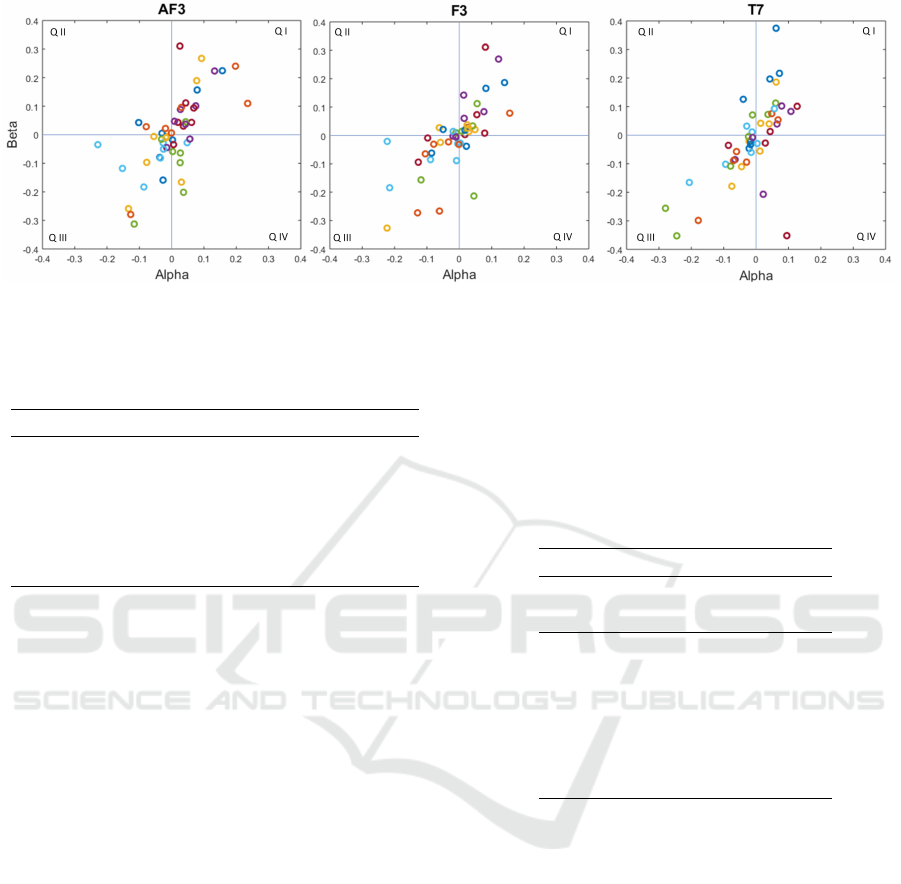
Figure 3: Correlation between Alpha and beta and the position of each patient in the specific quadrant. Each circle represents
a student.
Table 2: Percentages of student’s location considering the
correlation of Beta vs time and Alpha vs time.
Elect. Q I(%) Q II(%) Q III(%) Q IV(%)
AF3 37.25 11.76 33.33 17.64
AF4 43.13 11.76 35.29 09.80
F3 43.13 07.84 43.13 05.88
F4 37.25 23.52 25.49 13.72
T7 35.29 07.84 47.05 09.80
T8 35.29 13.72 39.21 11.76
percentage of students with a correlation upper to 0
is presented in the Table 3. Moreover, the same ta-
ble shows the slopes of the linear regression, where
the Beta waves are reduced with the passage of time,
while the Alpha waves in F3 y T8 are increased. The
results of the tests in a scale from 0.00 to 10.00 evi-
denced that 56.86 % of the students obtained a score
≥ 7.00. This percentage could be represented by the
students in the quadrants Q I, Q II, and Q IV, taking
into account the data in Table 2 and that the students
in this quadrants could increase their attention along
the time.
4 CONCLUSIONS
This study proposes to identify a student’s attention
level in an English class as a second language, ana-
lyzing EEG signals. The classes were specially de-
veloped for this experiment and the volunteers had a
similar level of knowledge about the second language.
Considering just the energy field of the EEG signal, it
is possible to see an important reduction of the atten-
tion since the beginning of the class until the ending
of it (12 minutes after) on the Alpha and Beta waves.
As a limitation of this study, it is possible to mention
that just 6 electrodes were analyzed in the energy am-
bit taking in account Alpha and Beta waves. Finally,
the proposes of this study is a technical analysis of the
signals energy throughout the time and it is assumed
the relation between Alpha and Beta waves with the
relax level and the active attention respectively (Nidal
and Malik, 2014).
Table 3: Slope of the linear regression and percentage of the
students with a correlation > 0 (left hemisphere).
Score >7.00 = 56.86 [%]
Electrode Slope
Corr. > 0 [%] [uV
2
/min]
AF3 Alpha 54.90 -22.99
AF3 Beta 49.01 -14.79
F3 Alpha 49.01 09.43
F3 Beta 50.98 -06.82
T7 Alpha 45.09 08.25
T7 Beta 43.13 -39.12
This study proposes to analyze Alpha and Beta
waves of a EEG signal as a biofeedback tool in the
process of estimating the attention level during an
academic class. Throughout the class, the results re-
vel a decrement of the energy in the Beta waves on the
electrodes AF3, AF4, F3, F4, T7 y T8. These results
are associated to a loss of students’ active attention
during the period of class. Alpha waves on the ot-
her hand, show an energy increment on the electrodes
AF4, F3 y T7 and a decrement on AF3, F4, T8.
REFERENCES
Aliakbaryhosseinabadi, S., Kamavuako, E. N., Jiang, N.,
Farina, D., and Mrachacz-Kersting, N. (2017). Clas-
sification of eeg signals to identify variations in atten-
tion during motor task execution. Journal of Neuros-
cience Methods, 284:27–34.
NEUROTECHNIX 2018 - 6th International Congress on Neurotechnology, Electronics and Informatics
44

Berka, C., Levendowski, D. J., Lumicao, M. N., Yau, A.,
Davis, G., Zivkovic, V. T., Olmstead, R. E., Tremou-
let, P. D., and Craven, P. L. (2007). Eeg correlates
of task engagement and mental workload in vigilance,
learning, and memory tasks. Aviation, space, and en-
vironmental medicine, 78(5):B231–B244.
Chen, C.-M. and Lee, T.-H. (2011). Emotion recognition
and communication for reducing second-language
speaking anxiety in a web-based one-to-one synchro-
nous learning environment. British Journal of Educa-
tional Technology, 42(3):417–440.
Cohen, A., Ivry, R. I., and Keele, S. W. (1990). Attention
and structure in sequence learning. Journal of Expe-
rimental Psychology: Learning, Memory, and Cogni-
tion, 16(1):17.
First, E. (2017). Ef english proficiency index-a compre-
hensive ranking of countries by english skills. Techni-
cal report, Retrieved 2017-01-28, from http://www. ef.
se/epi.
Jamil, F. M., Sabol, T. J., Hamre, B. K., and Pianta,
R. C. (2015). Assessing teachers skills in detecting
and identifying effective interactions in the classroom:
theory and measurement. The Elementary School
Journal, 115(3):407–432.
Kim, S.-K., Yoo, E.-Y., Lee, J.-S., Jung, M.-Y., Park, S.-
H., and Park, J.-H. (2014). The effects of neurofeed-
back training on concentration in children with atten-
tion deficit/hyperactivity disorder. International Jour-
nal of Bio-Science and Bio-Technology, 6(4):13–24.
Kroll, J. F. and Tokowicz, N. (2005). Models of bilingual
representation and processing: Looking back and to
the future. na.
Lema-Condo, E. L., Bueno-Palomeque, F. L., Castro-
Villalobos, S. E., Ordo
˜
nez-Morales, E. F., and Serpa-
Andrade, L. J. (2017). Comparison of wavelet trans-
form symlets (2-10) and daubechies (2-10) for an elec-
troencephalographic signal analysis. In Electronics,
Electrical Engineering and Computing (INTERCON),
2017 IEEE XXIV International Conference on, pages
1–4. IEEE.
Nidal, K. and Malik, A. S. (2014). EEG/ERP Analysis:
Methods and applications. Crc Press.
Poulsen, A. T., Kamronn, S., Dmochowski, J., Parra, L. C.,
and Hansen, L. K. (2017). Eeg in the classroom: Sy-
nchronised neural recordings during video presenta-
tion. Scientific Reports, 7.
Variation of the EEG-Energy in a Second Language Class
45
