
The Impact of Psychological and Demographic Parameters on Simulator
Sickness
Stephan Schweig
1
, Magnus Liebherr
2
, Dieter Schramm
1
, Matthias Brand
2
and Niko Maas
1
1
University of Duisburg-Essen, Department of Mechatronics, Duisburg, Germany
2
University of Duisburg-Essen, Department of General Psychology: Cognition, Duisburg, Germany
Keywords:
Driving Simulator, Simulator Sickness, Aging, Mental Abilities, Mental Capacity, Adaption.
Abstract:
In a world, which is characterized by technical progress, virtual environment technologies become increasingly
relevant. In this context, simulators are used as a cost and time efficient methods for investigating innovative
developments, training effects, but also the influence of individual attributes such as the process of aging.
Although the simulator technologies have been greatly developed in recent years, they are not able to perfectly
replicate the real world, which causes problems of system adaptation and simulator sickness. In the paper at
hand, we will focus both, the time of adaptation to the virtual environment and the phenomenon of simulator
sickness under the aspect of mental abilities and the process of aging, based on a driving simulator study with
414 participants.
1 INTRODUCTION
Within a previous study, Sahami, Jenkins, and Sayed
(Sahami et al., 2009) described the adaptation to a
driving simulator as the process by which drivers ad-
just their existing driving skills to the simulator so that
they can effectively control the simulated vehicle and
drive it through the simulated environment. A key
question in this context belongs to the time it takes
until humans adapt to virtual environments in order to
observe ”realistic” behavior. Previous studies mostly
used a pre-defined period of time to practice from 5 to
15 min (Horberry et al., 2006) or in some case 30 min
to several hours (van Winsum et al., 1999). An excep-
tion is the study conducted by O’Neill, Krueger, Van
Hemel, McGowan, and Rogers (O’Neill et al., 1999),
in which the participants were asked to practice two
full days before starting the experiment. In contrast,
Bass, Charlton and Bastin (Baas et al., 2000) used a
very short practice time of around 2 min in examine
truck drivers fatigue and fitness of duty. Along with
a pre-defined period of time, pre-defined distances
(Lewis-Evans and Charlton, 2006), or the subjective
feeling of comfort of the participants (Takayama and
Nass, 2008) are also frequently used. Nevertheless,
such approaches do not ensure that adaptation has in-
deed occurred. One approach to determine the time of
adaptation comes from McGehee, Lee, Rizzo, Daw-
son, and Bateman (McGehee et al., 2004). Their re-
sults show that drivers adapt within approximately
240s after starting the simulator scenario. Further-
more, McGehee et al. (McGehee et al., 2004) re-
ported an age-related increase in the steering variabil-
ity of older drivers, but no effect on adaptation rates.
In the context of steering adaptation pattern, Sahami
and Sayed (Sahami and Sayed, 2010) discussed the
processes of motor-cognitive skills, cognitive-mental
abilities, and the aspect of physiological transfer as
responsible for the time humans need to adapt to vir-
tual environments. Closely related to each other and
discussed as result of a lack of adaptation, simula-
tor sickness is described as a phenomenon including
symptoms such as headache, sweating, dry mouth,
drowsiness, disorientation, vertigo, nausea, dizziness,
and vomiting (Brooks et al., 2010b), which are sim-
ilar to those of motion sickness but typically less in
their appearance (Kennedy et al., 1993). Previous
studies reported experiences with simulator sickness
in 80% to 95% of participants and a drop-out rate of
5% to 30% (Stanney et al., 2002). In this context,
Balk, Bertola and Inman (Balk et al., 2013) discussed
nausea and nausea-related symptoms as most likely
described symptoms to fail to complete simulations.
Regarding sex-related differences in the occurrence
of simulator sickness, Garcia, Baldwin and Dworsky
(Garcia et al., 2010) reported a lower level of sim-
ulator sickness in males compared to females as a
function of fixed-base versus rotating base platform,
Schweig, S., Liebherr, M., Schramm, D., Brand, M. and Maas, N.
The Impact of Psychological and Demographic Parameters on Simulator Sickness.
DOI: 10.5220/0006837300910097
In Proceedings of 8th International Conference on Simulation and Modeling Methodologies, Technologies and Applications (SIMULTECH 2018), pages 91-97
ISBN: 978-989-758-323-0
Copyright © 2018 by SCITEPRESS – Science and Technology Publications, Lda. All rights reserved
91

which is in accordance with previous studies (Freund
and Green, 2006). In the context of age-related differ-
ences there is a common agreement that older adults
tend to be more susceptible to simulator sickness than
younger participants (Brooks et al., 2010b). These
findings are explained by Domeyer, Cassavaugh, and
Backs (Domeyer et al., 2013) based on the fact of a
lack of experience with simulated environmentsin the
elderly. Mullen, Weaver, Riendeau, Morrison, and
B´edard (Mullen et al., 2010) compared older adults
who failed to complete a simulated drive because of
simulator sickness and those who completed the sim-
ulation by using onroad drivingperformance,the Use-
ful Field of View test, the Attention Network Test,
and the Trail Making Test (A). Based on their results
the authors suggested that cognitive differences are
not associated with dropping out because of simulator
sickness. In contrast, Kawano et al. (Kawano et al.,
2012) reported a relation between visuospatial func-
tion and the onset of simulator sickness. For exam-
ple, Rizzo et al. (Rizzo et al., 2003) reported a 2.4
times higher simulator sickness rate for cognitively
impaired drivers than for their healthy counterparts.
A quantitative relationship between subjective sim-
ulator sickness and objective physiological measure-
ments of the central and autonomous nervous systems
has been reported by Min, Chung, Min and Sakamoto
(Min et al., 2004).
In the past, numerous theories tried to give a better
understanding regarding the cause of simulator sick-
ness. The most widely accepted theory – the sen-
sory conflict theory (Reason and Brand, 1975) – as-
sumes a conflict between or within sensory systems
responsible for the occurrence of simulator or mo-
tion sickness. This is in accordance with more re-
cent studies, which reported a discrepancy between
vestibular signals and other, primarily visual, infor-
mational inputs in simulator sickness (Kennedy et al.,
1993). In contrast, Riccio and Stoffregen (Riccio
and Stoffregen, 1991) suppose that congruent infor-
mation from sensory systems is unusual even in nor-
mal everyday tasks. Furthermore, it is assumed that
simulator or motion sickness occurs when people are
placed in novel environment in which effective ways
to maintain balance have not been learned (Duh et al.,
2004). Another theory comes from Treisman (Treis-
man, 1977). The evolutionary theory describes the
cause of simulator sickness based on the fact the hu-
man species has not had sufficient time to adapt to the
relatively new modes of transportation and therefore
the body responds to conflicts in sensory information
(Money and Cheung, 1983). The Neural Mismatch
model – introduced by Reason (Reason, 1978) – de-
scribes the existence of a conflict between sensory in-
formation and one’s own experiences of a motion en-
vironment as responsible for the occurrence of simu-
lator or motion sickness.
As reported above, the occurrence of simulator
sickness is directly linked to the aspect of adapta-
tion. This becomes also evident in the consideration
of studies, which reporting decreased simulator sick-
ness symptoms with repeated exposure within and be-
tween days. For example, Domeyer, Cassavaugh and
Backs (Domeyer et al., 2013) reported fewer simu-
lator sickness symptoms of participants who expe-
rienced a two-day delay between an initial acclima-
tion to the driving simulator. This reduction has been
shown to persist up to a month or longer (Hu and
Stern, 1999). Within eight trials Mourant, Rengara-
jan, Cox, Lin, and Jaeger (Mourant et al., 2007) re-
ported an increase in simulator sickness from trial one
to five and a decrease from five to eight. Furthermore,
the authors pointed out the relevance of the environ-
ments used in the simulator.
Based on the previous findings, we hypothesize
an effect of the process of aging on the occurrence
of simulator sickness, the time of adaptation as well
as mental abilities. Gender related differences of the
time spent in the simulator are supposed. Regarding
the time spent in the simulator, we further assume dif-
ferences between the group who adapt to the simula-
tor and those who do not.
2 EXPERIMENTAL PROCEDURE
2.1 Participants
In total, 414 people (mean age = 61.69 SD = 12.66
years, ranging from 25 to 89 years, 153 women) par-
ticipated in the study at hand. All participants have
a driving licence and are still actively driving a car.
The 20 people aged from 25 to 50 represent a con-
trol group compared to the 50+ target group. After a
medical check, participants were excluded when they
reported neurological or cardio-vascular diseases but
also impairments in the ability to see or hear. Further-
more, people above 60 were tested by the DemTect-
Test and excluded even when they showed first signs
of dementia (DemTect<9). The study was performed
in accordance with the ethical standards laid down in
the Declaration of Helsinki. All participants provided
written informed consent prior to the experiment and
were informed that they could end participation at any
time without reprisal.
SIMULTECH 2018 - 8th International Conference on Simulation and Modeling Methodologies, Technologies and Applications
92
2.2 Mental Abilities
2.2.1 D2 Test of Attention
The d2 Test is proposed as reliable measure of at-
tention and concentration (Brickenkamp, 1962). The
test is a one-page paper-and-pencil test, consisting
of 14 rows, each with 47 p and d characters (Brick-
enkamp and Zillmer, 1998). The characters have one
to four dashes that are configured individually or in
pairs above and/or below each letter. Participants are
asked to cross out all d with two dashes, regardless
of whether the dashes are above/below the d, or one
above and one below the d. Thus, a p with one or two
dashes and a d with more or less than two dashes are
distracters. For each row the time is limited to 20 sec-
onds in which participants should cancel out as many
targets as possible. No pauses are allowed between
trials. In agreement with previous studies, (Bates and
Lemay, 2004) showed that the d2 Test is an internally
consistent and valid measure of visual scanning accu-
racy and speed.
2.2.2 Trail Making Test (B)
The Trail Making Test (TMT) was originally de-
veloped as a component of the Army Individual
Test Battery and requires a variety of mental abil-
ities such as cognitive alternation/flexibility, inhibi-
tion/interference control, working memory, mental
tracking, and attentional set-shifting. Within part B
of the TMT, participants should alternately connect
12 letters (A-K) and 13 numbers (1-13) on a page of
paper. For example, the first number 1 is followed
by the first letter A, followed by the second number 2
then second letter B and so on. The time for complet-
ing the task is recorded. Errors are directly pointed
out by the examiners. Therefore, error-correction in-
fluences the time to complete a trail (Lezak, 1995).
Since its development, the test has been shown as a
robust measurement of intelligence (Waldmann et al.,
1992), neurological impairments (Reitan and Wolf-
son, 2004), but also declines related to the process of
aging (Wahlin et al., 1996).
2.2.3 Leistungspr¨ufsystem (German Intelligence
Test Battery) LPS-4
The Leistungspr¨ufsystem was developed by Horn
(Horn, 1983) in order to measure individuals’ level
of intelligence. The LPS-4 is one out of fourteen
sub-tests summarized in the Leistungspr¨ufsystem and
measures inferential thinking. Participants are faced
with 40 lines of numbers and letters on one page of
paper. They are asked to cross out the number or let-
ter that does not fit in the logical order of each line.
The difficulty increases from line 1 to line 40. The
time to complete the test is limited to eight minutes.
2.3 Driving Simulator
For the determination of the connections between
mental performance, age, adaptation time and simu-
lator sickness the static driving simulator of the chair
of mechatronics was used. It consists of a close-to-
production vehicle of the compact class, which has
been extended by force feedback components for the
simulation of forces and torques. Among these, in
particular, the steering is to be mentioned, which rep-
resents one of the most important bi-directional in-
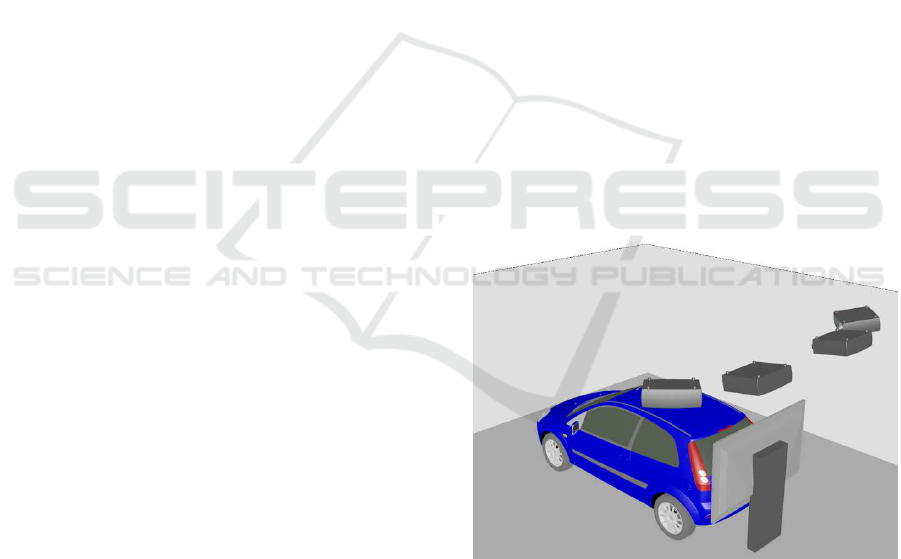
terfaces between driver and vehicle. The simulator
is located in a rectangular ”cave” (Figure 1) on the
ground without a movement platform. The simulated
vehicle environment is projected on the caves walls.
The field of view of the driver outside the vehicle in
this arrangement is 180
◦
and thus includes the entire
vehicle front. The side mirrors of the vehicle are rep-
resented by screens, which also serve the visual rep-
resentation of the vehicle environment. In addition,
behind the rear window of the vehicle, a monitor is
placed, which is used for both the rear view and for
the reflection of the image in the interior mirror.
Figure 1: Driving simulator cave.
The driver inputs are read by means of the vehi-
cle CAN bus and used as inputs of a complete vehicle
simulation (Maas et al., 2014), which simulates a re-
alistic driving behavior. An electric car is simulated,
which results in an automatic gearing and very low
noise emissions. Furthermore, road users are repre-
sented in the vehicle environment who interact with
the simulated (EGO) vehicle (Maas, 2017).
Subjects are therefore in a simulation environment
whose usability is physically not different from a se-
The Impact of Psychological and Demographic Parameters on Simulator Sickness
93
ries car and thus has a very high degree of reality. The
visualization as well as the missing movement of the
vehicle on the other hand represent a strong simplifi-
cation to the reality. Thus, both a high degree of im-
mersion, as well as a sufficient deviation from reality
is given, which (as shown above) serves as a possible
cause of the simulator sickness.
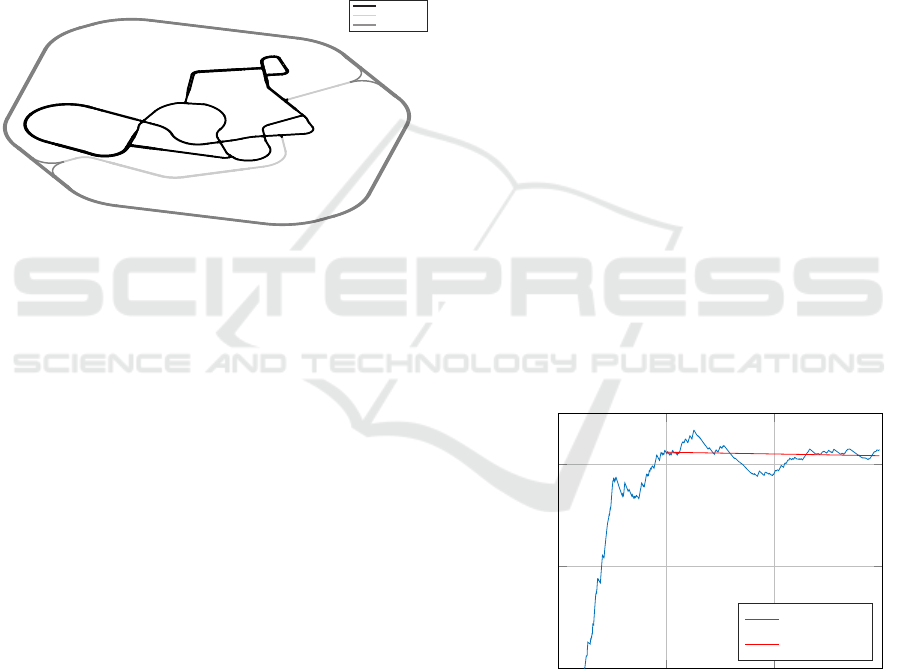
The presented road scenario (Figure 2) includes
an area of 3 x 3 km and consists of inner-city areas,
rural routes as well as highways. With a total length
of over 70 km, which are merged into several loops,
the impression of an infinite scenario without dead-
ends is created, which further supports the realistic
impression.
PSfrag replacements
inner city
freeway
country road
Figure 2: Driving simulator road scenario.
2.4 Procedure
Before starting, participants gave informed consent
after carefully reading the instructions. They were in-
formed that they could end participation at any time
without reprisal. Afterwards all participants under-
went a medical examination with main focus on the
suitability for driving in the simulator. Vision and
hearing but also cardio-vascular impairments (blood
pressure and electrocardiogram) were tested. Further-
more, participants were asked for a history of neuro-
logical, psychological, and orthopedic disorders. Af-
ter the medical examination, participants performed
the neuropsychological test battery. People above 60
started with the DemTect-Test. Afterwards all par-
ticipants completed the identical test sequence start-
ing with the d2 Test for attention and concentration,
followed by the Trail Making Test (B), and part four
of the Leistungspr¨ufsystem. Before starting with the
driving simulator participants had 5 to 15 minutes to
rest. Afterwards, they were instructed to the driving
simulator. Participants were informed that they can
stop driving at any time in case they feel sick or they
want to cancel for another reason. Next to technical
instructions (e.g., that it is a vehicle with automatic
transmission) participants were asked to choose inde-
pendently how and where to drive, within the virtual
scenario, without following a preceding car or a pre-
defined route. Maximum driving time in the simula-
tor was 25 minutes, as 20 minutes of driving time is
planned for the following tests on the subject of assis-
tance systems.
2.5 Data Analysis
Numerous data were recorded during the trip. Using
Joshi’s algorithm (Joshi et al., 2017), the index of per-
formance (IOP) was calculated from the data. This in-
dex contains numerous criteria that provide informa-
tion on driving performance. The track deviationindi-
cates how precisely the driver manages to drive in the
middle of the road. In addition, the steering behav-
ior and activity of the pedals are evaluated. The IOP
increases rapidly during unconventional driving, e. g.
in the case of permanently large steering movements
in order to keep the vehicle on track or alternately
pushing the accelerator and brake pedals to their end
position. As soon as the participant had adapted the
system, the IOP stagnated or decreased (e.g. Figure
3). Otherwise, the IOP continued to rise (e.g. Figure
4). The temporal progressions of the IOPs were calcu-
lated from the stored data and examined for gradients.
All calculation of IOPs and their gradients were per-
formed automatically with MATLAB and displayed
graphically. In order to take into account the distance
travelled and the individual traffic situations (traffic,
traffic lights, etc.), the determination of the adaptation
time was carried out by hand.
0
500
1,000
1,500
0
1
2
Time [s]
IOP (avg)
IOP adapted driving
IOP (avg)
gradient
Figure 3: Example average IOP of a well driving partici-
pant.
2.6 Statistical Analysis
Statistical analyses were carried out using SPSS
Statistics 24.0 for Windows. Homogeneity of vari-
ance was tested by using Levene’s test. The calcula-
SIMULTECH 2018 - 8th International Conference on Simulation and Modeling Methodologies, Technologies and Applications
94
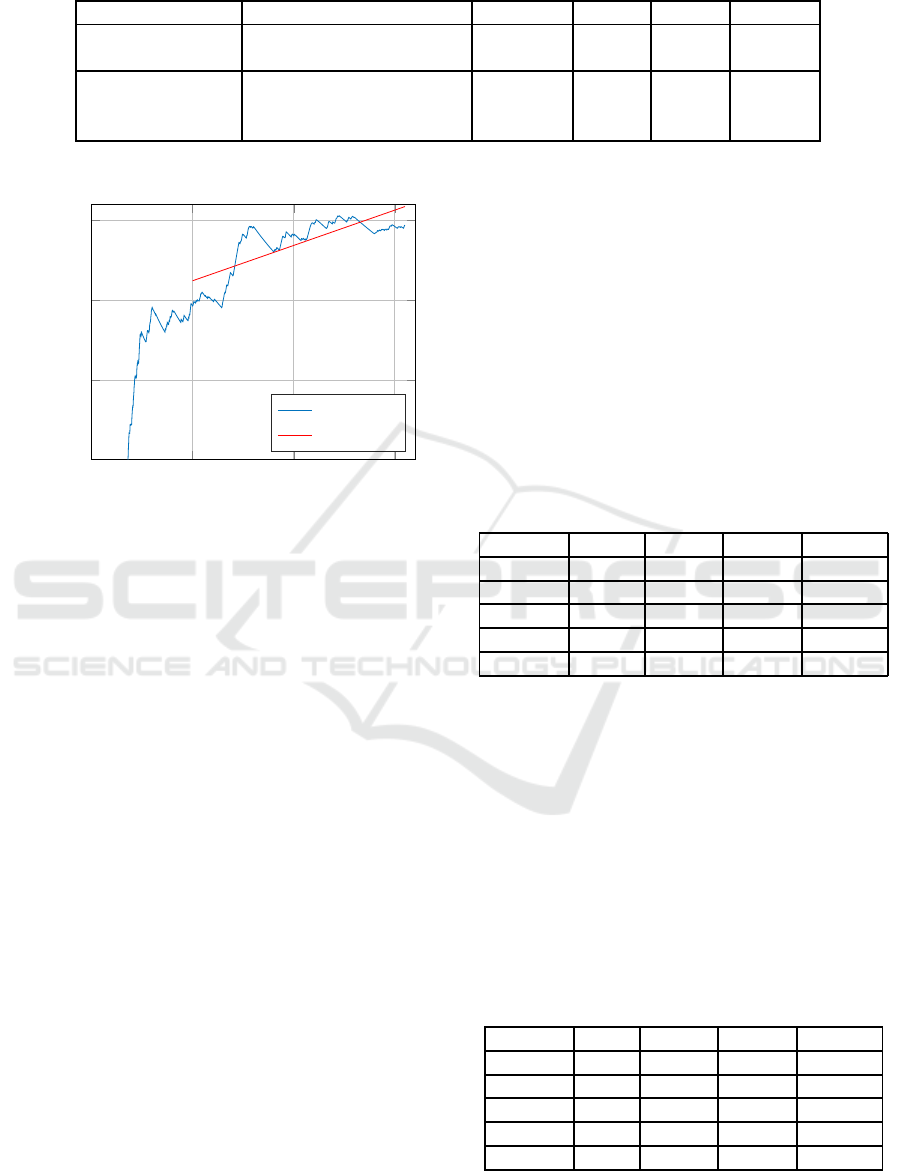
Table 1: Mental ability.
Domain Test M SD Range
Driving simulator Time within the simulator [seconds] 1127.5 492.91 19-1716
Time of adaption [seconds] 549.97 280.68 53-1205
Mental abilities D2 [errors] 158.81 40.15 50-284
TMT (B) [seconds] 83.29 34.33 28-255
LPS-4 [number] 25.19 4.14 11-38
0
500
1,000
1,500
0
0.5
1
1.5
Time [s]
IOP (avg)
IOP non-adapted driving
IOP (avg)
gradient
Figure 4: Example average IOP of a bad driving participant.
tion of relationships between two variables was made
by means of Pearson’s correlations. T-test for inde-
pendent samples was used to investigate gender as
well as group (people who adapt to the system vs.
not adapt to the system) differences regarding the time
spent in the simulator. Effect size was tested by Co-
hen’s d.
3 RESULTS
Results indicated a mean time in the simulator of
1127.5±492.91 seconds, ranging from 19 to 1716
seconds. Ninety participants adapted to the system
within an average time of 549.97±280.68 seconds
(ranging from 53-1205 seconds). Mental ability was
represented by the D2, TMT(B), and LPS-4. D2 show
a mean error rate of 158.81±40.15. Participants com-
pleted the TMT(B) in 83.29±34.33 seconds and iden-
tified 25.19±4.14 errors in the LPS-4 (see Table 1).
Based on a sample size of 414 people (mean age
= 61.69 SD = 12.66 years, 153 women), findings re-
vealed significant correlations between age and the
time within the simulator as well as mental abilities
(tested by the D2, TMT, and LPS-4). No relation
was identified between mental abilities and the time
spent in the simulator. The single components of
mental ability correlated significant with each other
(see Table 2). Furthermore, results show a gender-
related effect in the occurrence of simulator sickness,
by indicating significantly less time in the simulator in
women (M = 995.65 seconds SD 510.80) compared to
men (M = 1204.79 seconds SD = 466.01) (T(295.4) =
4.152, p <0.001, d = .428).
In most cases of premature abortion, the partic-
ipants complained of dizziness and nausea. A sur-
vey of participants based on Kennedy (Kennedy et al.,
1993) with similar modifications to Brooks (Brooks
et al., 2010a) was conducted after the study. The re-
sults have not yet been fully evaluated. The symptoms
did not appear immediately on all participants, but in
some cases minutes to hours after the study.
Table 2: Correlations of all participants.
2 3 4 5
1 Age -.103* .351** .475** -.387**
2 Time - -.054 -.069 .052
3 D2 - .470** -.429**
4 TMT - -.522**
5 LPS-4 -
*p ≤ .050 **p ≤ .010
Only 90 participants (mean age = 60.36 SD =
14.39 years, ranging from 25 to 89 years) out of the
414 showed an adaptation to the simulator system.
Here, results indicate no significant correlation be-
tween aging and the time of adaptation. A significant
mild correlation is shown between the performance of
the D2 and the time of adaptation. Results, regarding
mental abilities as well as the relations between single
tests for mental ability – as shown in the total sample
– are replicated in this smaller sample size (see Table
3).
Table 3: Correlations of participants who have adapted the
driving simulator.
2 3 4 5
1 Age -.150 .315** .461** -.364**
2 Time - -.222* -.051 .009
3 D2 - .401** -.352**
4 TMT - -.599**
5 LPS-4 -
*p ≤ .050 **p ≤ .010
In addition, people who adapted to the system
The Impact of Psychological and Demographic Parameters on Simulator Sickness
95

(M = 1395.12, SD = 287.90) have spent significantly
longer in the simulator compared to those who did
not (M = 1053.16, SD = 512.17) (T(259.1) = -8.220,
p <0.001, d = .823).
4 CONCLUSIONS
The present study investigated the correlations be-
tween mental abilities, age, driving simulator adap-
tion and simulator sickness. Derived from the results,
shown in the previous section, it can be stated that:
• Age has an effect on both, mental abilities and
probability of simulator sickness occurrences,
• mental abilities do not have a significant effect on
simulator sickness occurrences,
• the gender can have an effect on simulator sick-
ness occurrences and
• adapting to the simulator leads to a smaller prob-
ability of simulator sickness occurrences.
5 OUTLOOK
Starting from the point of the general influences on
simulator sickness described here, further possible
parameters can be identified in future work. Among
these properties, the properties of the virtual scenario
should be taken into account in particular. In this con-
text, it should be investigated to what extent the adap-
tation to challenging driving tasks correlates with the
cognitive workload.
Another challenging option is the consideration of
the subjective adaptation time. By determining this
parameter, existing algorithms can be extended or re-
placed by objectifiable methods.
The evaluation and analysis of the questionnaire
on symptoms, time, duration and intensity of the sim-
ulator sickness promises to provide interesting data
for future experiments.
Further tests with a modified simulator provide
comparative data and allow systematic improvement
of the simulations.
ACKNOWLEDGEMENTS
The studies presented here were carried out within the
framework of the research project ”ALFASY - Alters-
gerechte Fahrerassistenzsysteme”. This project was
funded by the European Regional Development Fund
(ERDF).
REFERENCES
Baas, P. H., Charlton, S. G., and Bastin, G. T. (2000). Sur-
vey of new zealand truck driver fatigue and fitness for
duty. Transportation Research Part F: Traffic Psy-
chology and Behaviour, 3(4):185 – 193. Fatigue and
Transport (I).
Balk, S. A., Bertola, M. A., and Inman, V. W. (2013).
Simulator sickness questionnaire: twenty years later.
Driving Assessment 2013: Proceedings of the 7th In-
ternational Driving Symposium on Human Factors in
Driver Assessment, Training, and Vehicle Design.
Bates, M. E. and Lemay, E. P. (2004). The d2 test of at-
tention: construct validity and extensions in scoring
techniques. Journal of the International Neuropsycho-
logical Society, 10(3):392–400.
Brickenkamp, R. (1962). Test d2: Aufmerksamkeits-
Belastungs-Test. Verlag f¨ur Psychologie Hogrefe.
Brickenkamp, R. and Zillmer, E. (1998). The d2 test of
attention. Hogrefe.
Brooks, J. O., Goodenough, R. R., Crisler, M. C., Klein,
N. D., Alley, R. L., Koon, B. L., Logan, W. C., Ogle,
J. H., Tyrrell, R. A., and Wills, R. F. (2010a). Simu-
lator sickness during driving simulation studies. Acci-
dent Analysis & Prevention, 42(3):788 – 796. Assess-
ing Safety with Driving Simulators.
Brooks, J. O., Goodenough, R. R., Crisler, M. C., Klein,
N. D., Alley, R. L., Koon, B. L., Logan Jr, W. C.,
Ogle, J. H., Tyrrell, R. A., and Wills, R. F. (2010b).
Simulator sickness during driving simulation studies.
Accident Analysis & Prevention, 42(3):788–796.
Domeyer, J. E., Cassavaugh, N. D., and Backs, R. W.
(2013). The use of adaptation to reduce simulator
sickness in driving assessment and research. Accident
Analysis & Prevention, 53:127–132.
Duh, H. B.-L., Parker, D. E., and Furness, T. A. (2004).
An independent visual background reduced simulator
sickness in a driving simulator. Presence: Teleopera-
tors & Virtual Environments, 13(5):578–588.
Freund, B. and Green, T. (2006). Simulator sickness
amongst older drivers with and without dementia. Ad-
vances in Transportation Studies.
Garcia, A., Baldwin, C., and Dworsky, M. (2010). Gen-
der differences in simulator sickness in fixed-versus
rotating-base driving simulator. In Proceedings of
the Human Factors and Ergonomics Society Annual
Meeting, volume 54, pages 1551–1555. SAGE Publi-
cations Sage CA: Los Angeles, CA.
Horberry, T., Anderson, J., and Regan, M. A. (2006). The
possible safety benefits of enhanced road markings: a
driving simulator evaluation. Transportation Research
Part F: Traffic Psychology and Behaviour, 9(1):77–
87.
Horn, W. (1983). Leistungspr¨ufsystem : L-P-S. Verl. f¨ur
Psychologie, Hogrefe, G¨ottingen [u.a.].
Hu, S. and Stern, R. M. (1999). The retention of adapta-
tion to motion sickness eliciting stimulation. Aviation,
space, and environmental medicine, 70(8):766–768.
Joshi, S. S., Maas, N., and Schramm, D. (2017). A ve-
hicle dynamics based algorithm for driver evaluation.
SIMULTECH 2018 - 8th International Conference on Simulation and Modeling Methodologies, Technologies and Applications
96

In Intelligent Systems and Control (ISCO), 2017 11th
International Conference on, pages 40–44. IEEE.
Kawano, N., Iwamoto, K., Ebe, K., Aleksic, B., Noda, A.,
Umegaki, H., Kuzuya, M., Iidaka, T., and Ozaki, N.
(2012). Slower adaptation to driving simulator and
simulator sickness in older adults aging clinical and
experimental research. Aging clinical and experimen-
tal research, 24(3):285–289.
Kennedy, R. S., Lane, N. E., Berbaum, K. S., and Lilien-
thal, M. G. (1993). Simulator sickness questionnaire:
An enhanced method for quantifying simulator sick-
ness. The international journal of aviation psychol-
ogy, 3(3):203–220.
Lewis-Evans, B. and Charlton, S. G. (2006). Explicit and
implicit processes in behavioural adaptation to road
width. Accident Analysis & Prevention, 38(3):610–
617.
Lezak, M. D. (1995). Neuropsychological Assessment. Ox-
ford University Press, USA.
Maas, N. (2017). Konzeptionierung, Auslegung und Um-
setzung von Assistenzfunktionen f¨ur die
¨
Ubergabe der
Fahraufgabe aus hochautomatisiertem Fahrbetrieb.
PhD thesis, Universit¨at Duisburg-Essen.
Maas, N., Hesse, B., Koppers, M., and Schramm, D. (2014).
Simulator setup according to use case scenarios-a
human-oriented method for virtual development. In
Mechatronic and Embedded Systems and Applications
(MESA), 2014 IEEE/ASME 10th International Con-
ference on, pages 1–6. IEEE.
McGehee, D. V., Lee, J. D., Rizzo, M., Dawson, J., and
Bateman, K. (2004). Quantitative analysis of steer-
ing adaptation on a high performance fixed-base driv-
ing simulator. Transportation Research Part F: Traffic
Psychology and Behaviour, 7(3):181–196.
Min, B.-C., Chung, S.-C., Min, Y.-K., and Sakamoto, K.
(2004). Psychophysiological evaluation of simulator
sickness evoked by a graphic simulator. Applied er-
gonomics, 35(6):549–556.
Money, K. E. and Cheung, B. S. (1983). Another function
of the inner ear: facilitation of the emetic response to
poisons. Aviation, space, and environmental medicine.
Mourant, R. R., Rengarajan, P., Cox, D., Lin, Y., and Jaeger,
B. K. (2007). The effect of driving environments on
simulator sickness. In Proceedings of the Human Fac-
tors and Ergonomics Society Annual Meeting, vol-
ume 51, pages 1232–1236. Sage Publications Sage
CA: Los Angeles, CA.
Mullen, N. W., Weaver, B., Riendeau, J. A., Morrison,
L. E., and B´edard, M. (2010). Driving performance
and susceptibility to simulator sickness: Are they re-
lated? American Journal of Occupational Therapy,
64(2):288–295.
O’Neill, T., Krueger, G., Van Hemel, S., McGowan, A.,
and Rogers, W. (1999). Effects of cargo loading and
unloading on truck driver alertness. Transportation
Research Record: Journal of the Transportation Re-
search Board, (1686):42–48.
Reason, J. T. (1978). Motion sickness adaptation: a neu-
ral mismatch model. Journal of the Royal Society of
Medicine, 71(11):819.
Reason, J. T. and Brand, J. J. (1975). Motion sickness. Aca-
demic press.
Reitan, R. M. and Wolfson, D. (2004). The trail making test
as an initial screening procedure for neuropsychologi-
cal impairment in older children. Archives of Clinical
Neuropsychology, 19(2):281–288.
Riccio, G. E. and Stoffregen, T. A. (1991). An ecologi-
cal theory of motion sickness and postural instability.
Ecological psychology, 3(3):195–240.
Rizzo, M., Sheffield, R. A., Stierman, L., and Dawson, J.
(2003). Demographic and driving performance factors
in simulator adaptation syndrome. Proceedings of the
Second International Driving Symposium on Human
Factors in Driver Assessment, Training and Vehicle
Design, pages 201–208.
Sahami, S., Jenkins, J., and Sayed, T. (2009). Methodology
to analyze adaptation in driving simulators. Trans-
portation Research Record: Journal of the Trans-
portation Research Board, (2138):94–101.
Sahami, S. and Sayed, T. (2010). Insight into steering adap-
tation patterns in a driving simulator. Transportation
Research Record: Journal of the Transportation Re-
search Board, (2185):33–39.
Stanney, K. M., Kingdon, K. S., and Kennedy, R. S. (2002).
Dropouts and aftereffects: examining general accessi-
bility to virtual environment technology. In Proceed-
ings of the Human Factors and Ergonomics Society
Annual Meeting, volume 46, pages 2114–2118. SAGE
Publications Sage CA: Los Angeles, CA.
Takayama, L. and Nass, C. (2008). Driver safety and in-
formation from afar: An experimental driving simula-
tor study of wireless vs. in-car information services.
International Journal of Human-Computer Studies,
66(3):173–184.
Treisman, M. (1977). Motion sickness: an evolutionary hy-
pothesis. Science, 197(4302):493–495.
van Winsum, W., De Waard, D., and Brookhuis, K. A.
(1999). Lane change manoeuvres and safety margins.
Transportation Research Part F: Traffic Psychology
and Behaviour, 2(3):139–149.
Wahlin, T.-B. R., B¨ackman, L., Wahlin,
˚
A., and Win-
blad, B. (1996). Trail making test performance in a
community-based sample of healthy very old adults:
effects of age on completion time, but not on accuracy.
Archives of Gerontology and Geriatrics, 22(1):87–
102.
Waldmann, B. W., Dickson, A. L., Monahan, M. C., and
Kazelskis, R. (1992). The relationship between intel-
lectual ability and adult performance on the trail mak-
ing test and the symbol digit modalities test. Journal
of Clinical Psychology, 48(3):360–363.
The Impact of Psychological and Demographic Parameters on Simulator Sickness
97
