
Iron Value Classification in Patients Undergoing Continuous
Ambulatory Peritoneal Dialysis using Data Mining
Catarina Peixoto
1
, Hugo Peixoto
2
, José Machado
2
, António Abelha
2
and Manuel F. Santos
2
1
Department of Informatics, University of Minho, Campus Gualtar, Braga 4710, Portugal
2
Algoritmi Center, University of Minho, Campus Gualtar, Braga 4710, Portugal
Keywords: Data Mining, Continuous Ambulatory Peritoneal Dialysis, Weka, Classification Algorithms.
Abstract: In this article, Data Mining classification techniques are employed, in order to classify as normal or not-
normal the iron values from a patients’ blood analysis. The dataset used is relative to patients that were
subjected to Continuous Ambulatory Peritoneal Dialysis (CAPD) treatment. Weka software was used for
testing several classification algorithms into such data set. The main purpose is finding the best suitable
classification algorithm, with a pleasing performance in classifying the instances of the data, whereas
preserving low rate of false positives. The IBk algorithm achieved the best performance, being able to
correctly classify 97.39% of the instances.
1 INTRODUCTION
This paper presents Data Mining techniques applied
into a dataset collected from a hospital. Several
classification algorithms were applied and their
performance was evaluated. Also, it is described
properly the dataset used and the changes that were
made, in order to achieve a better prediction of the
iron value – what was, in this case, the methodology
structure chosen. In that way, firstly it is presented a
section of Background, where concepts like Artificial
Intelligence, Machine Learning (applied with Weka
software), and Data Mining are explained. It is
followed by the section of Materials and Methods,
which explains all the procedure involved as well as
the results that were achieved. Then, there is the
section of Discussion, which is compared the results
obtained from the different algorithms that were used.
At last, there is a section of Conclusion.
In this article, a data set of patients’ blood
analysis, subject to CAPD treatment, was studied,
aiming to classify its iron value as a normal or not
normal value. A normal value must belong to the
range of values that the hospital defined as normal
values, otherwise, they would be considered as a not-
normal value.
A previous study revealed that some patients
presented some considerable lack of knowledge about
the indications of their prescribed therapy. In result of
that, higher levels of non-compliance to the therapy
are present, ultimately leading to iron deficiency, a
major threat in peritoneal dialysis patients (Vychytil,
1999). This manuscript, its intended to be able to
predict the iron value, from older blood analysis
results, in order to alert a patient to be more aware of
the indications of the CAPD treatment, that somehow
the patient isn’t following them correctly.
Therefore, it would be very useful to the patients’
health being able to classify in advance an iron value,
considering the previous analysis of the patient. For
that, it will be necessary to apply and study Data
Mining techniques, a process of machine learning that
is able to find unknown patterns and relationships in
a large dataset, proportioning accurate predictions.
2 BACKGROUND
2.1 Artificial Intelligence
Artificial Intelligence (AI) can be defined as the
attempt of executing human intelligent processes
through machines. In that way, it is needed to
understand how the human brain works and how
humans proceed when facing a problem, in order to
learn with such overcomes and be able to develop
intelligent software and systems (Nilsson, 2014).
Peixoto, C., Peixoto, H., Machado, J., Abelha, A. and F. Santos, M.
Iron Value Classification in Patients Undergoing Continuous Ambulatory Peritoneal Dialysis using Data Mining.
DOI: 10.5220/0006820802850290
In Proceedings of the 4th International Conference on Information and Communication Technologies for Ageing Well and e-Health (ICT4AWE 2018), pages 285-290
ISBN: 978-989-758-299-8
Copyright
c
2019 by SCITEPRESS – Science and Technology Publications, Lda. All rights reserved
285

AI has two the main purposes: creating expert
systems and implement human intelligence in
machines. Relatively to the first one, such systems
should exhibit intelligent behavior and the ability to
learn, demonstrate, explain, and advise its users. The
second one involves the creation of systems that
understand, think, learn, and behave like humans
(Nilsson, 2014). In addition, it is important to realize
that AI is present in very different areas with very
different goals and approaches. For example, AI plays
a crucial role in strategic games such as chess, poker,
etc., where the machine has the capability of thinking
in a large number of possible positions based on
heuristic knowledge. In addition to this, certain
intelligent systems are capable of hearing and
understand the language in terms of sentences and
their meanings while a human talk to those (Nilsson,
2014).
At the end, it can be concluded that AI can have
the following functions: solving problems, pattern
recognition, classification, learning, induction,
deduction, building analogies, optimization,
surviving in an environment, language processing,
knowledge and much more (Silva, 2016, Hutter,
2005).
2.2 Machine Learning
Machine learning is one subfield of Artificial
Intelligence. It hugely relies on mathematical
algorithms that improve learning through experience,
in an attempt to build systems that learn from past
data, conceding predictions and recognition of
patterns (Hutter, 2005, Hamet, 2017).
There are three types of machine learning
algorithms:
Unsupervised: the capability of finding
patterns.
Supervised: algorithms of classification and
regression that have in consideration the
previous data.
Reinforcement learning: use of sequences of
rewards and punishments to create a strategy
to operate in a certain problem space
(Hamet, 2017).
Machine learning is growing through the time,
bringing new discoveries and utilities into different
areas such as science and engineering. For instance,
by resorting to machine learning techniques, now it is
possible to measure the detailed molecular state of an
organism.
In that way, the main goal of machine learning is
to infer a functional relationship between a set of
attributes variables and associated response or target
variables in order to predict the response for any set
of attributes, where such response can be the result of
classification, clustering or projection (Rogers,
2017).
2.3 Data Mining
Data Mining is a process that tries to discover
unknown, unexpected, interesting relevant patterns
and relationships in data that may be used to make
valid and accurate predictions, by using a large
variety of data analysis methods (Stubee, 2014). Data
Mining involves techniques from different disciplines
such as database technology, statistics, machine
learning, high-performance computing, pattern
recognition, neural networks, data visualization,
information retrieval, image and signal processing,
and spatial data analysis (Han, 2000, Esteves, 2017).
This process tries to achieve useful knowledge
through huge amounts of data, in a process of
extraction of new information. Such knowledge can
be used in applications of business management,
production control, market analysis, engineering
design, medicine, science exploration, etc. (Han,
2000).
Data Mining is the analysis of data sets aiming to
find unsuspected relationships and to summarize the
data in new ways that are understandable and useful
to the data owner. For that, several methods are used,
including linear equations, rules, clusters, graphs, tree
structures, and recurrent patterns in time series (Hand,
2010).
Such processes require the use of large datasets. If
only small data sets were used, we would obtain
instead a classical discussion of exploratory data
analysis, practiced by statisticians (Hand, 2010).
In that way, it can be concluded that Data Mining
is used to identify potential problems and to discover
similarities between current and previous situations,
in order to improve the understanding of relevant
factors and associations as well as discovering non-
obvious features in the data (Cortès, 2000).
Data Mining is used in different areas in order to
make easier discovering unknown and significant
information to an organization. Following there are
some examples of research works, which used such
process of learning.
The paper "Real-time Decision Support using
Data Mining to Predict Blood Pressure Critical
Events in Intensive Medicine Patients" has the main
purpose of predicting the probability of a patient
having a blood pressure critical event by using Data
Mining classification techniques (Portela, 2015).
HSP 2018 - Special Session on Healthy and Secure People
286

Then, there’s the article developed by a student
from the University of National and World Economy
that aims to predict student performance, based on
their personal characteristic. For that, it was tested
well-known data mining classification algorithms,
and then each algorithms’ performance was analyzed
and compared (Kabakchieva, 2012).
To conclude, in (Chauhan, 2013) Chauhan tries to
classify the network traffic into normal and
anomalous to detect intrusions, by testing several
classification algorithms (J48, BayesNet, Logistic,
SGD, etc.) in order to find out the best suitable
algorithm available.
2.4 Machine Learning with Weka
Software
Weka has got a collection of several machine learning
algorithms for Data Mining tasks. Such algorithms
can be directly applied to the data set that is intended
to be studied. Weka comprehends tools for data pre-
processing, classification, regression, association
rules, and visualization (Weka, 2011).
For this study, it was tested some of the top
classification machine learning algorithms available
in Weka. A classification algorithm has the main
purpose of analyzing a given data set and assigning
each instance to a particular class, in this case,
determine if such instance belongs to the normal or
not normal values group.
Classification is a process that involves two
phases: first, it is created a model by applying
classification algorithm on training dataset, then the
extracted model is tested against a predefined test
dataset to measure the model trained performance and
accuracy (Nikam, 2015).
The k-Nearest Neighbors (KNN) algorithm can be
used in classification and regression predictive
problems, however, it is usually used for
classification problems. It is an algorithm that stores
all instances and classifies the new ones by using a
distance metric like Euclidean function. Each new
instance is assigned to the class most common
amongst its K nearest neighbors measured by a
distance function. Weka’s default setting is K=1, in
that case, such instance is simply assigned to the next
neighbor (Hand, 2010).
This algorithm has the advantage of being able to
generalize whenever it is required to classify an
instance, ensuring no loss of information as it can
occur with the other learning techniques. In addition,
previous investigators concluded that KNN can
achieve more accurate results than those of the
symbolic classifiers (Akanbi, 2015). KNN
corresponds to IBk in the Weka algorithms collection.
Decision Tree algorithm support either
classification and regression problems. It works by
creating a tree to evaluate an instance of data, starts at
the trees’ root and moves through the roots until it can
be made a prediction of such instance – the process
repeats for each clause (Stubee, 2014).
Decision Trees can generate automatically several
rules, which are conditional statements that explain
how it was achieved the building of the respective
tree.
However, decision trees sometimes present
performance problems due to the larger size of the
tree, being oversized and probably it is going to
classify badly the instances (Ali, 2005). In this study,
it was used the REPTree algorithm, a decision tree
algorithm.
Support Vector Machine (SVM) algorithm plots
each data item as a point in the n-dimensional space
(n matches with the number total of features) and the
value of each feature is a coordinate value. Then, it is
attempted to find the hyperplane that allows
differentiating the classes of the data set. In that way,
it can be concluded that such algorithms effort in
classifying instances to groups by using linear models
to implement nonlinear class boundaries. So, it is an
optimization process as it only considers those data
instances from the training data set that are closer to
the line that best separates the classes (Stubee, 2014,
Brownlee, 2017). This algorithm was developed for
numerical input variables, although it converts
automatically nominal values into numerical values.
3 MATERIALS AND METHODS
This paper studies a dataset from a Portuguese
hospital and has information about blood analysis
from patients who are submitted into CAPD
treatment. For this Data Mining Process, was used the
Cross Industry Standard Process for Data Mining
(CRISP-DM) Methodology. This process model is
divided into six phases: Business Understanding,
Data Understanding, Data Preparation, Modelling,
Evaluation and Deployment (Chapman, 2000).
3.1 Business Understanding
This paper focuses on the prediction of the iron value
from patients’ blood analysis, by having in
contemplation five other values: calcium, chlorides,
creatinine, ferritin, and urea. It was realized that these
values are directly associated with the kidney
Iron Value Classification in Patients Undergoing Continuous Ambulatory Peritoneal Dialysis using Data Mining
287

function, an anomaly value of one of these means a
possible failure of the kidney. In that way, this
prediction will help patients that are submitted into
CAPD treatment to have a better perception of the
treatments’ efficiency. In addition, being able to
predict this value will allow the doctors to alert a
patient in case of detecting a not normal iron value,
which means that the patient is not following
correctly the indications of this treatment.
3.2 Data Understanding
Each data instance consists of a set of eight variables:
gender, age and calcium, chloride, ferritin, urea
values, and the iron classification.
The target variable iron has two possible values:
normal or not normal. In Figure 1 is possible to
analyze the data distribution of this variable on the
dataset studied, which is observed that 1150 instances
(23%) are classified as a not normal iron value.
Figure 1: Data distribution of the target variable Iron's
value.
3.3 Data Preparation
Normalization of data is required to make variables
comparable to each other. It is much more
problematic trying to find relations and patterns in
data when it is being compared instances in different
scales of measurement. In that way, normalization
consists in transforming all values into a standard
scale, that is confining the values between 0 and 1
(Analytictech, 2010). In this case, it was normalized
all values from the data, except the column to be
classified. To normalize a value, it is necessary to
know the maximum and minimum value from the
column where the value belongs, and then it is made
a division between the subtraction of the value with
the maximum and the subtraction of the maximum
with the minimum.
In order of improving the Data Mining results, it
was made oversampling of the data set, in this case, it
was duplicated the rows. In cases where there is few
amount of target variables, it is useful to oversample
the target variable (Deutsch, 2010). The data set used
had more patients with not-normal iron values than
with normal values, so oversampling it was necessary
to have a better performance of the classification,
having a dataset with a total of 4972 instances.
3.4 Data Modelling
The followed phase consisted in the implementation
of the Data Mining Models (DMM) into Weka. This
dataset was applied to several classification
algorithms, although only three achieved a
satisfactory performance: k-Nearest Neighbors (IBk),
Decision Tree (REPTree) and Support Vector
Machines (SMO).
Each Data Mining (DM) technique used data for
training and testing, which was used Cross-
Validation for the last one, using 10 folds (the rest of
the data was used for the training). It was only
considered the scenario of all attributes, in the way
that when it was tested only one or different
combination of attributes it was achieved a worst
performance, classifying incorrectly more instances.
Also, the main purpose it is to evaluate and verify that
these values from a blood analysis are directly
proportional with the iron, meaning that an alteration
of the iron value implies different values of the other
attributes – mentioned above.
3.5 Evaluation
Each classified output presents the number of True
Positives (TP), False Positives (FP) and False
Negatives (FN). In that way, with these values, it is
possible to calculate the precision, recall, relative
absolute error and the percentage of instances that
were correctly classified. Equations 1 and 2 show
how Precision and Recall were calculated. The
precision is the fraction of true positives among the
retrieved instances (true positives and false positives),
while recall results from the division between true
positives and the total amount of relevant instances -
sum of true positives and false negatives. In that way,
a higher value of precision or recall implies a better
performance. However, having false positives
influences more negatively the performance (in this
case) than false negatives, which means its intended
having a better value in precision than in recall.
Precision = TP/(TP+FP)
(1)
Recall = TP/(TP+FN)
(2)
Table 1 shows TP Rate, FP Rate, and relative absolute
error.
HSP 2018 - Special Session on Healthy and Secure People
288
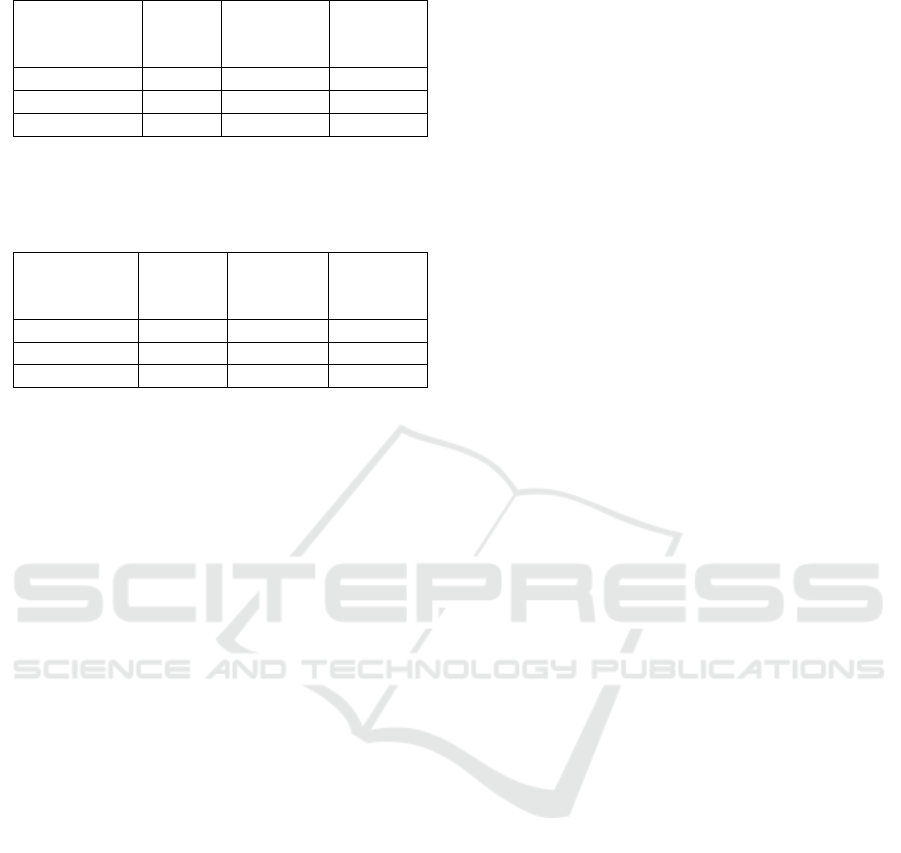
Table 1: Results of the IBk, REPTree and SMO algorithms.
Algorithms
TP
Rate
FP Rate
Relative
absolute
error
IBk
0.974
0.061
7.41%
REPTree
0.825
0.421
62.85%
SMO
0.769
0.769
65.03%
Table 2 shows the values for precision, recall and
the percentage of correctly classified instances.
Table 2: Results of the IBk, REPTree and SMO algorithms.
Algorithms
Precision
Recall
Correctly
classified
instances
IBk
0.974
0.974
97.39%
REPTree
0.813
0.825
78.38%
SMO
0.591
0.769
76.87%
4 DISCUSSION
As it is shown in the previous section, the IBk
algorithm was the one that presented a better
performance, having correctly classified 97.39% of
the instances and having the better true positives rate,
which implies a low rate of false positives. With this
algorithm, it was also achieved good results in
precision and recall.
By applying REPTree algorithm it was achieved a
percentage of 78.39% instances correctly classified,
with a relative absolute error of 7.41%. It had a better
performance than the SMO algorithm, which had
only 76.87% of instances correctly classified and
presented the bigger rate of false positives (0.769).
Such low performance can be the result of predicting
nominal instances, and as it was said before this
algorithm was ideally developed for numerical input
variables.
IBk presented a better performance than the
REPTree algorithm that could be due to the fact of
IBk being able to generalize whenever it is required
to classify an instance. As well as, REPTree can have
performance issues when it is created an oversize tree
and that can lead to a bad classification.
5 CONCLUSIONS
The major obstacles of this work were the data
preparation phase pointed in section 3.3, as it was
necessary to determine what to select from the
original data set, in order to eliminate null values and
information that could affect the performance of a
machine learning algorithm.
Data Mining classification techniques allowed to
classify as normal or not normal an iron value from a
patients’ blood analysis. Such ability may be useful
to the patients’ health because as mentioned before,
some of the patients do not follow the indications of
the CAPD treatment. So, it will make a significant
impact being able to predict the classification of the
iron value, by having in consideration other values
from the blood analysis. Also, this process of Data
Mining can be considered simple to implement and
can evaluate the performance of different
classification algorithms without a lot of effort.
In this study, it can be concluded that IBk
algorithm was the one with a better performance. It
was able to classify correctly 97.39% of the instances,
having a low rate of false positives.
ACKNOWLEDGEMENTS
This work has been supported by Compete: POCI
-01-0145-FEDER-007043 and FCT within the
Project Scope UID/CEC/00319/2013. This work is
also supported by the Deus ex Machina (DEM):
Symbiotic technology for societal efficiency gains -
NORTE-01-0145-FEDER-000026.
REFERENCES
Vychytil, A., Haag-Weber, M., 1999. Iron status and iron
supplementation in peritoneal dialysis patients. Kidney
International, Vol. 55, Suppl. 69.
Nilsson, N. J., 2014. Principles of artificial intelligence.
Morgan Kaufmann.
Silva, A., Vicente, H., Abelha, A., Santos, M., Machado,
M., Neves, João, Neves, José, 2016. Length of Stay in
Intensive Care Units – A Case Base Evaluation, in
Frontiers in Artificial Intelligence and Applications,
New Trends in Software Methodologies, Tools and
Techniques, IOS Press, Volume 286.
Hutter, M., 2005. Universal Artificial Intelligence:
Sequential Decisions Based on Algorithmic
Probability.
Hamet, P., Tremblay, J., 2017. Artificial intelligence in
medicine, Metabolism Journal.
Rogers, S., Girolami, M., 2017. A First Course in Machine
Learning, Chapman & Hall, 2
nd
edition.
Stubee, A., Coleman, S., 2014. A Practical Guide to Data
mining for Business and Industry.
Han, J., Kamber, M., 2000. Data Mining: Concepts and
Techniques.
Esteves, M., Vicente, H., Machado, J., Alves, V., Neves, J.,
2017. A Case Based Methodology for Problem Solving
Iron Value Classification in Patients Undergoing Continuous Ambulatory Peritoneal Dialysis using Data Mining
289

aiming at Knee Osteoarthritis Detection, in Soft
Computing and Data Mining, in Recent Advances on
Soft Computing and Data Mining, Advances in
Intelligent Systems and Computing, Springer, Volume
549.
Hand, D., Mannila, H., Smyth, P., 2001. Principles of Data
Mining, MIT Press, Cambridge, MA.
Cortès, Ulises, 2000. Artificial intelligence and
environmental decision support systems, Applied
intelligence 13.1, 77-91.
Portela, F., Santos, M., Abelha, A., Machado, J., Martins,
F., Silva, A., 2015. Real-time Decision Support using
Data Mining to predict Blood Pressure Critical Events
in Intensive Medicine Patients, Ambient Intelligence for
Health, Lecture Notes in Computer Science Volume
9456.
Kabakchieva, D., 2012. Student Performance Prediction by
Using Data Mining Classification Algorithms,
International Journal of Computer Science and
Management Research, Volume 1, Issue 4.
Chauhan, H., Kumar, V., Pundir, Pilli, E., 2013. A
Comparative Study of Classification Techniques for
Intrusion, International Symposium on Computational
and Business Intelligence.
Machine Learning Group at the University of Waikato,
2011. Weka 3: Data Mining Software in Java.
http://www.cs.waikato.ac.nz/ml/weka/ Retrieved May
30, 2017.
Nikam, S., 2015. A Comparative Study of Classification
Techniques in Data Mining Algorithms. Oriental
Journal of Computer Science & Technology.
Akanbi, O., Amiri, I., Fazeldehkordi, E., 2015. A Machine
Learning Approach to Phishing Detection and Defense,
Elsevier.
Ali, S., Smith, K., 2005. On learning algorithm selection
for classification, Elsevier.
Brownlee, J., 2016. How to use Classification Machine
Learning Algorithms in Weka, Machine Learning
Mastery. http://machinelearningmastery.com/use-
classification-machine-learning-algorithms-weka/
Retrieved May 30, 2017.
Chapman, P., Clinton, J., Kerber, R., Khabaza, T., Reinartz,
T., Shearer, C., & Wirth, R., 2000. CRISP-DM 1.0
Step-by-step data mining guide.
Analytictech, 2010. Normalizing Variables, International
Center for Research, University of Kentucky
http://www.analytictech.com/ba762/handouts/normali
zation.htm. Retrieved May 28, 2017.
Deutsch, G., 2010. Overrepresentation, “SAS”-
Oversampling. http://www.data-mining-blog.com/tips-
and-tutorials/overrepresentation-oversampling/
Retrieved May 27, 2017.
HSP 2018 - Special Session on Healthy and Secure People
290
