
Colour Codes Method Digitalization in edX E-learning Platform
Laura Dzelzkaleja
1,2
and Zanis Timsans
1
1
Riga Technical University, Faculty of E-sudy Technologies and Humanities, Kronvalda str.1, Riga, Latvia
2
Riga Technical University, Cesis Affiliate, Piebalgas str.3, Cesis, Latvia
Keywords: Colour Codes, edX E-learning Platform, Learning Analytics, Learning Evaluation, E-learning Software, Open
Code, IBM SPSS Modeler.
Abstract: Evaluation and improvement of the e-learning process are getting more and more attention. There are tools
and methods available, but none of them is a solution to everything. A new Colour code method for
understanding students’ learning process has been introduced in the previous papers. The method uses three
colour codes: red for "problem", yellow for "work in progress" and green for "job done", and previous research
in classroom showed that this system works. The next step was taken to implement the method in the
computer-based learning management system (LMS). For this purpose, edX learning platform was chosen. In
this paper, an overview of edX learning platform and e-learning course evaluation methods and strategies is
given, as well as a description of method and implementation. The main conclusions are that edX platform is
suitable for the new tool and code block generation, as well as for sharing this code with others; the colour
buttons worked as predicted, the data are gathering and gives an insight of which learning items get the most
attention by learners, rating by the usage of colour buttons. 45% of students that attended e-learning course at
least once, used colour buttons as well. The most used button was the green button “done” (67.2% of all
pushes), the second largest was orange “process” (25.4%), but the least used was red “problem” button (7.4%).
Mostly the codes were used in online tests (75%), but some part went to peer assessment (9%), informative
learning materials (8%) and homeworks (5%).
1 INTRODUCTION
Organizations nowadays focus very much on the
production and distribution of information and
knowledge, in what has been termed the Knowledge
Age (Soares, 2013). Especially important it gets in the
education field which is all about knowledge.
E-learning is also one of the areas that attracts the
most research and development funding. If this
investment is to be maximised, it is imperative that
we generate robust models for the evaluation of e-
learning and tools which are flexible in use but
consistent in results. Student examination is a
powerful indicator of the effectiveness of e-learning,
it is not the only one (Attwell, 2006).
Possibility to evaluate and improve the learning
process is getting more and more topical. It is spoken
a lot about the educational system and change of
paradigms. New and digital age based educational
paradigms are emerging (e.g., connectivism
(Siemens, 2005)). But the question about how to find
out, what improvements are needed in the learning
process and content, is still actual.
It is always hard to make changes in the existing
system, especially in such an inert system as
education. And change is difficult, complex, and
risky because it has unintended side effects. Effects
of change ricochet through systems via interactions
between its parts (Mitra, 2008). That is why people
are intuitively rather cautious with any kind of change
in the educational field because the consequences are
often not observed right away and too many other
systems depend on the educational system to
experiment with it blindly since knowledge is the
chief resource in our economy (Drucker, 2000).
In order to improve educators possibilities to
make improve the quality of a learning course, a new
Colour code system was introduced in previous
research in a face-to-face learning environment. The
system is meant for understanding students’ learning
process dynamics and find the black spots more
quickly.
Dzelzkaleja, L. and Timsans, Z.
Colour Codes Method Digitalization in edX E-learning Platform.
DOI: 10.5220/0006806601650172
In Proceedings of the 10th International Conference on Computer Supported Education (CSEDU 2018), pages 165-172
ISBN: 978-989-758-291-2
Copyright
c
2019 by SCITEPRESS – Science and Technology Publications, Lda. All rights reserved
165

2 COLOUR CODE TOOL
IMPLEMENTATION IN A
LEARNING PLATFORM
The method could be referred as a Benchmarking
model by Attwell (2006). “There have been several
attempts to generate sets of criteria for quality
assuring e-learning. However, these tend to be
skewed towards proposing quality standards for e-
learning systems and software which often disregard
key variables in the wider learning environment or are
based on criteria associated with evaluating
traditional learning processes (and which disregard
the technology) or criteria associated with measuring
learner achievement through traditional pedagogies.
An additional problem is that the designers of these
benchmarking systems are often locked into a
particular model of e-learning which limits their
transferability” (Attwell, 2006).
2.1 Colour Code Method
A new approach, presented in the authors’ previous
papers (Dzelzkaleja (2016), Dzelzkaleja (2017)) for
continuously evaluating learning process in real time
was presented. In this paper, the method is further
analysed with the data gained from the first
experimental observations.
The main principle of the method is as follows:
there are three colour codes which are used by a
learner to show the teacher the progress in every
moment of the learning process.
“Red” is used to show that the task is not clear
or difficulties have appeared during the
process, some assistance is needed (in the form
of tutour or some extra learning materials);
“Orange” is used whenever the task is being
done and everything is clear – no need for
assistance;
“Green” is used when the learner has finished
the task or isn’t doing anything.
The colours have been chosen based on the
traffic-lights colour coding, since these colours are
recognizable for almost every person andgives and
opportunity to intuitivelly guess the meaning of the
buttons – red as a something that slows down or stops,
green s something that allows you to go the next place
and is connected to pleasurable associations, and
orange (yellow in some cases) being something in the
middle of both previous.
In case of distant learning, the codes need to be
installed so that the learner could click on the
appropriate colour on the screen conveniently in
every moment of the learning process.
There are other widely used methods for getting a
feedback. A nice example of giving a feedback are
voting systems expressing sentiment such as “like”
and “dislike” which is already a popular way of
showing your opinion of a picture, video, text etc. in
social media platforms. Coursera learning platform
offers possiblity to rate each learning object with
“like” (thumbs up symbol) and “dislike” (thumbs
down symbol), as well as report a problem (flag
symbol), visually they are represented with a dark
contour with no filling. In the case of such voting
systems, students have to make a decision whether
they like or dislike the material, and it can be
connected to extra cognitive pressure, since there are
only too possibilities to chose from and nothing in the
middle. In Moodle there is a block available, that
provides a possibility for a teacher and the student to
follow the progress of the student with the help of a
colourful Progress Bar, that shows how much of the
course materials are already viewed or completed and
identifies students at risk of completing the course.
The proposed Colour code method in this paper
differs from already available methods because it
doesn’t ask from the user to make a decision whether
they like every single learning item, but just ask to
record, when and how their learning situation
changes. So basically, it is meant to provide
continuous data rather than discrete data. For
example, it can show that from time x till time y the
student has been in the learning process, from time y
till time w the student struggles with a problem, in
time y the student presses “Done” button and from
time y till time z the student has a break, in the
moment z the student presses “In process” button and
starts another learning session until time a etc.
2.2 edX Learning Platform
The Internet and related web technologies do offer
great solutions for presenting, publishing and sharing
learning content and information, as is the case in
many other areas. Special software called Learning
Management System (LMS) is generally used in most
institutions providing web-based learning.
Nowadays, various LMS are used as a supporting tool
in electronic education. A great number of LMSs,
both commercial and open source, are widely used for
educational and training purposes. Most universities
combine the forms of learning, using one of the
commercial or open-source LMSs. They tend to use
CSEDU 2018 - 10th International Conference on Computer Supported Education
166

products such as Claroline, Fle3, ILIAS, MS Class
Server, WebCT, Eden, Enterprise Knowledge
Platform, LearningSpace, eAmos, eDoceo, Uniforms,
uLern, Aspen, Oracle iLearnin, NETOPIL School and
Moodle (Balogh, 2013).
edX learning platform is not among the most
popular learning platforms in the world Toren (2015),
Mauri (2017), Burns (2014), Laurinavicius (2017),
Getting Smart (2017), nevertheless, its influence is
growing and is mentioned in research articles like de
Lera, (2012) and Banday (2014). edX was launched
only in the spring of 2012 by Massachusetts Institute
of Technology (MIT) and Harvard University and is
supported by Google. Despite the short time of
existence, in the end of 2016, it had already ~ 10
million users (Goulart, 2016). In comparison Moodle,
which is the biggest LMS, have about 122 million
users (Moodle, 2016) and Coursera learning platform,
that has the biggest course catalogue amongst MOOC
providers, has 23 million registered users. So edX is
coming in as a powerful player.
EdX provides university-level courses and the
topics are mostly associated with science (Fenton,
2015 ). In 2015 Riga Technical University launched
their own open source edX learning platform in which
the Colour code method was initially deployed.
The strengths of edX according to Fenton (2015)
is a large catalog of online higher education courses;
enroll in either self-paced or timed classes, ranging
between four and twelve weeks; open source platform
(Open edX) enables developers to build and share
assessment modules, so it is possible to make changes
to the appearance of the learning platform, and to add
an additional functionality in form of “xBlocks”
which are components of edX architecture and
connects different sources (Open edX , 2017)
students may audit or pursue Honor Certificates both
for a fee or for free; video transcripts available.
Weaknesses of this platform are that students have
little contact with their professors; outside the
sciences, edX catalogue has gaps; discussion forums
are comparably less convenient (Fenton, 2015 ).
As a not-for-profit open source platform, edX
encourages developers to contribute to their Open
edX initiative, and, thanks to that access, developers
have made edX course assessment, while still
imperfect, the most versatile currently available. Its
courses are supplied by some of the world's most
prestigious institutions, including UC Berkeley,
Boston University, as well as both founding
institutions. But edX is not meant as a replacement of
a traditional university. While participants can audit
classes and earn proof of enrollment for free, edX
does not offer the credentialing of a traditional
university. Typically, learners are adults interested in
sciences, but that is expanding, thanks to a high
school initiative and professional education program
(Fenton, 2015).
To call edX courses "online courses" is somewhat
misleading. EdX courses possess features of online
education, including discussion forums (often
moderated by faculty and teaching assistants);
machine-graded multiple-choice assessments; self
and peer assessments; and, of course, video lectures
(typically divided into segments of twenty minutes or
less). However, unlike an online course at my home
institution, edX courses usually do not require
prerequisites, and anyone can join at any time before
the course ends. This open invitation can be a boon,
as it invites all sorts of non-traditional students with
different perspectives; however, by the same token, it
also means that instructors cannot take for granted
certain levels of competency (Fenton, 2015 ).
2.3 E-learning Course Assessment and
Evaluation
Some summary on assessment, evaluation and
feedback can be found in previous work (Dzelzkaleja
(2016), Dzelzkaleja (2017)). We found EU
handbook Evaluating E-learning A Guide to the
Evaluation of E-learning (Attwell, 2006) as a very
comprehensive, structured and useful guide towards
evaluating a course.
The evaluation methods and tools differ widely.
What they do have in common is that they recognise
the importance of evaluation and many propose that
evaluation should be an integral part of any e-learning
initiatives or development. In this regard, they tend to
lean toward a management model of evaluation; the
primary aim of the evaluation is to provide feedback
to influence e-learning implementation and future
development (Attwell, 2006).
Firstly, there are many online data gathering
instruments for assessing, typically, the user interface
characteristics of software (e.g. student perception
questionnaires) and secondly, there are devices to
record and analyze usage by duration and frequency
of log-in, pages accessed, user profile etc. The next
question that logically arises is - why do we need
another evaluation method in e-learning platform?
The reason is that the available assessment and
evaluation methodologies do not provide enough
information about the reasons of user behaviour in the
real time constantly, many of these are sophisticated
in their design and ingenuity but lack guidance on
interpretation and analysis (Attwell, 2006).
Colour Codes Method Digitalization in edX E-learning Platform
167
We will try to sum up the assessment and
evaluation possibilities available in different learning
platforms and what type of data is available from
them. Let us divide data into two parts: 1) data
connected to user grades and course curricula
acquisition; and 2) data connected with course
quality, learner satisfaction and user behaviour in the
course.
With the 1st set of data, it is more or less clear
because it is easy to track and follow learners’ test
results. However, the 2nd set of data demands some
specific knowledge in programming and (big) data
analysis, that not every course developer has, and
usually the course developers and learners don’t have
an access to the raw data. So there is a need for user-
friendly data visualisations. Some good examples,
where this is available, is Google Analytics Tool.
Another drawback for the 2nd set of data is that
only a limited number of data types is gathered, and
that data may not reflect the reasons of user behaviour
or do not show the patterns of the behaviour
comprehensively enough. So complementary data
gathering is being researched broadly in recent years.
Technologies like eye movement tracking, facial
expression recognition, voice tonality recognition,
pose and gesture recognition have been tested and
implemented. But these often demand to use a
computer built-in camera, which means some loss of
privacy and may leave users feeling uncomfortable,
in some cases an additional equipment is needed such
as eye tracking hardware and software which also can
be costly (Landowska, (2017), Rezende (2017)).
It leaves us with mainly two lower cost and easier
to implement possibilities: a) research mouse
movement patterns on the screen and/or b) implement
additional data gathering opportunities on the screen.
In the first case, mouse movement analysis can offer
us possibilities to make course visual design
accordingly and to make several different visual
designs for the course according to the learner’s type.
But this kind of design is hard to duplicate from
course to course. In the second case, there is a need to
implement additional blocks for feedback gathering
on the screen.
2.4 Description of Method and
Implementation
The Colour code method acts in a similar way to
voting systems - giving the user possibility to express
its process evaluation by clicking the appropriate
button but in addition, it also attaches chunks of
valuable metadata with each click.
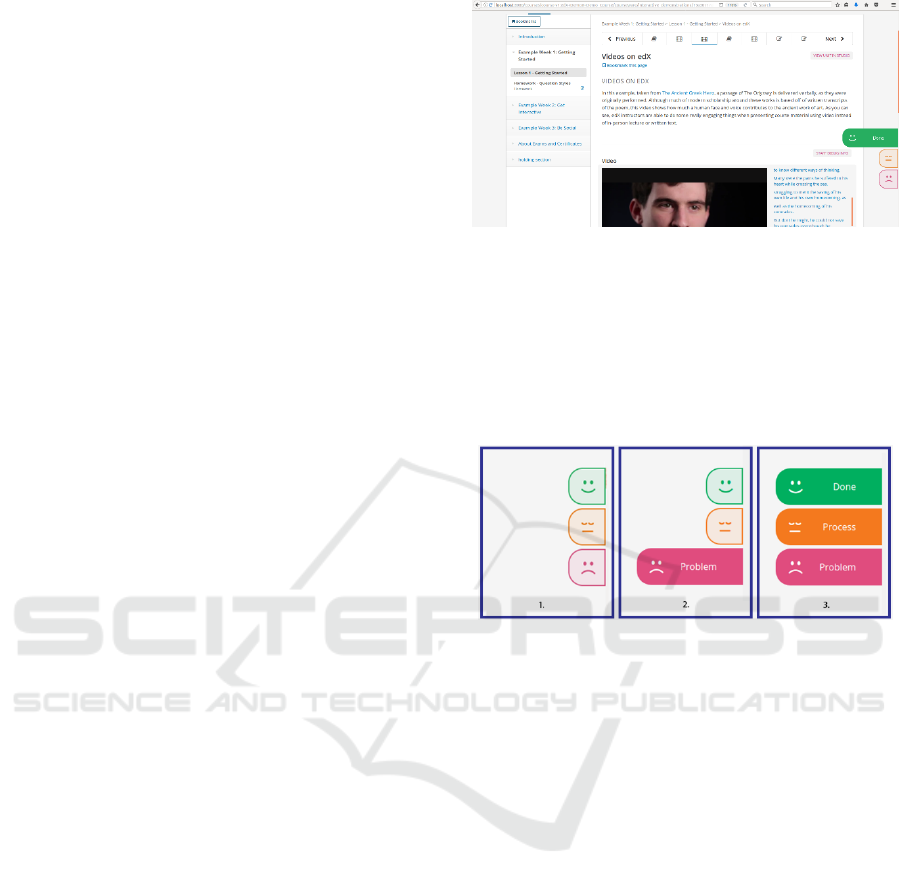
Figure 1: Screenshot of EdX with buttons.
The set of colour coded buttons are fixed on the
screen in the same place at all times and is visible only
at course content (Figure 1). When appropriate button
is clicked information of the current state is recorded
and sent to a database where all the data is gathered
(Figure 3).
Figure 2: Button states.
The visual and interactive design of the buttons is
based on basic principles of user interaction and
experience design guidelines, thus implementing
associated colours and playful animation to
encourage more frequent interactions from users
(Figure 2). Buttons are equipped with an anti-spam
feature as well as feedback message letting the user
know if click was recorded successfully.
As mentioned previously, data gathered from this
method is complementary to already existing user
data in edX platform. The type of the button pushed
records the process stage at the current time (Done,
Process, Problem (Figure 2)), and can be subject to
change during the learning process. With every click
of the button wide range of other parameters is
recorded. These parameters are as follows: 1) what
type of button is clicked, 2) time when it’s clicked, 3)
username, 4) course name, 5) course id, 6) section
title that is currently being viewed, 7) video timer (if
it’s available), and 8) page URL.
Scripting languages, such as javascript, HTML
and CSS, and programming languages, such as
Python, have been used to develop the plug-in.
Currently, it is not a ready-made solution and is in its
early stages of development. The finished product
CSEDU 2018 - 10th International Conference on Computer Supported Education
168
will be packed into edX xBlock, which will be
available then to anyone, as it will be open-source.
Current set-up requires jQuery code injection into
edX document object model (DOM) which then
renders buttons and communicates with a database.
Python programming language was used to set up the
database server.
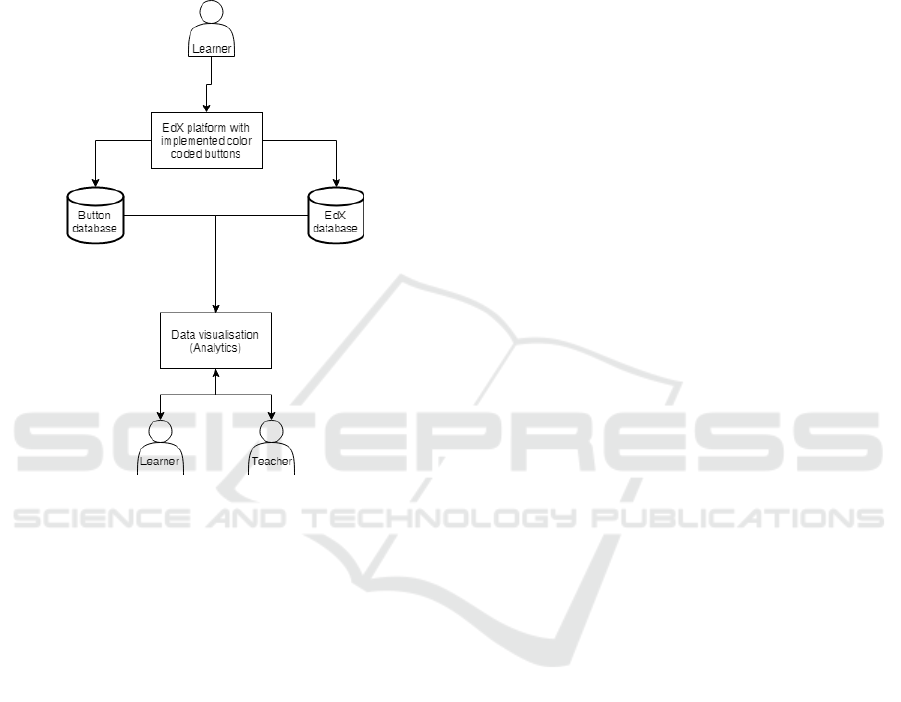
Figure 3: System diagram.
edX has a built-in data analytics feature, but it is
not sufficient enough and this is why Colour coded
method has been implemented.
A research of Schumacher (2018) shows that one
of the most desirable features that students expect
from learning analytics is a production of
personalized analyses of their learning activities. And
Colour code method is aiming to do just that.
As it is seen in Figure 3, there are two separate
databases for collecting learner’s behavioural data
from the platform. Both databases are separated in
order to not temper with EdX core setup. Both EdX
and colour coded button method have adapted
MySQL database, thus all data can be exported in
different formats and analysed with chosen data
analysis tool.
In this paper, a colour code button block
implementation in edX is presented and tested. The
next step is to convert the data into visually appealing
and understandable form for both learners and course
developers. This would engage learners to use the
codes more often since they will be able to see the
changes and patterns of their behaviour in their
profile. For course developers, however, this
information will immediately give a feedback on the
quality of course material and student’s learning pace
as well as help to uncover possible issues associated.
3 RESULTS AND DISCUSSION
In this particular paper, a preliminary data analysis
was done, using IBM SPSS Modeler. This is a tool
that allows to process a big amount of raw data from
a database and predict the future events with a help of
models.
As an experimental group was chosen Riga
Technical University 1st Bachelor course students. The
learning subject was Entrepreneurship. Registered
students’ number was 106, they were split into groups,
but the learning curricula was the same for all. The
experiment took part in the autumn of 2017 and the
database was active and started to record from October
19. The last data were mined from December 14.
Learning form was blended learning - some part
of the course material was to be acquired through edX
learning platform. In the beginning of the course, the
learners were introduced to the edX learning
platform, since it was a new platform for them,
together with the Colour code method, and were
asked to use the buttons voluntarily to help the
research. For this experiment group, there weren’t a
personalized data visualizations of their activities
available in edX since this experiment was mainly
targeted to test the system, debug it, see how the data
is gathered in the database and get a feedback from
students afterwards.
The experiment is still continuing, but there are
some preliminary results available. First of all, the
system works as it should - the colour buttons are
there and the data is gathered when a colour button is
pressed. Quantitative data were gathered during the
experiment. After the data were gathered and primary
data processing was made, qualitative analysis was
made as well.
Not all of the students used the buttons: 34 valid
student IDs were recorded, and it is 32% of all 106
students. It should be noted as well that 31 of all the
students haven’t logged in the online course at all, so
the actual proportion of those who used buttons and
logged in the course was 45% of all 75 students who
used course at least once.
The green button “done” was pushed the most
times (67.2% of all pushes), the second largest was
orange “process” (25.4%), but the least, to our
surprise, red “problem” button was pushed (7.4%).
Graphically it is displayed in Figure 4.
Colour Codes Method Digitalization in edX E-learning Platform
169
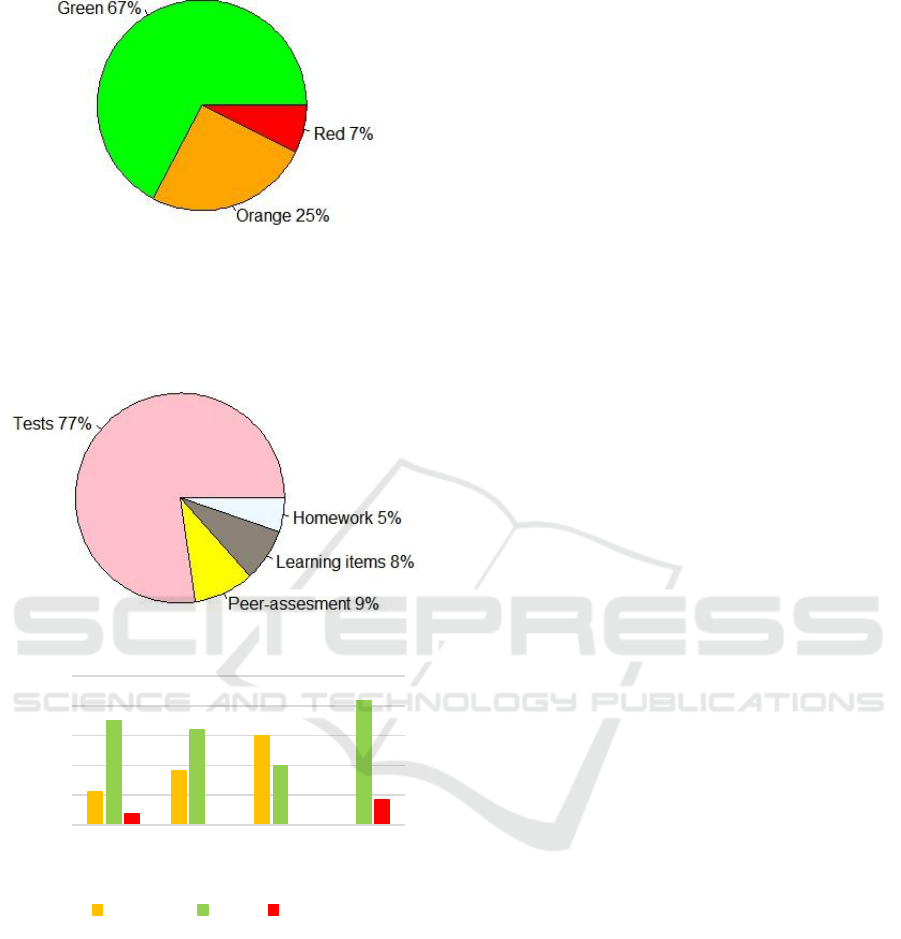
Figure 4: Proportion of pushed colours.
Mostly the codes were used in online tests (75%),
but some part went to peer assessment (9%),
informative learning materials (8%) and homework
(5%), as Figure 5 shows.
Figure 5: Code usage by learning material type.
Figure 6: Buttons pushed in different learning material
types.
If we analyse the gathered data about button pushes
by learning material type (Fig.6.), it can be seen that in
tests, peer review tasks and homework “Done” green
button has been pushed the most, but it differs for
learning items (meant the informative materials, not
tests, homework and peer-review), and the biggest
proportion here is orange “In process” button, “Done”
being only the second and no problem button pushed
at all. It can be seen that the “Problem” button hasn’t
been pushed in the Peer review tasks as well. Buti n the
Homework no “In process” data has been recorded.
Partly the low activity in e-learning platform
could be explained by the fact that it was a blended
learning subject, and the edX learning platform was
new to the learners.
Despite thr fact that buttons were used mostly in
tests, the colours were distributed quite similar
throughout all of the course material types. It could
mean that students perceive the possibility to push the
green “done” button as a reward - a symbol of work
being done. The reasons for red being pushed so little
could be one of three: 1) good quality of the
course/nothing better to compare to, 2) feeling that
there’s no point of pushing red, because tutor would
probably not react/the student feels it’s his/her
responsibility to understand and 3) fear from the tutor
getting angry for judging/fear of getting caught not
pushing the buttons (could explain the high activity
of pushing buttons in tests). These are just a few ideas
that could be useful explaining the results and need a
further research to reveal the true reasons for this.
4 CONCLUSIONS
There are many online data analysis instruments for
assessing available, typically, the user interface
characteristics (e.g. student perception questionnai-
res) and there are devices to record and analyze usage
by duration and frequency of log-in, pages accessed,
user profile etc. But the available assessment and
evaluation methodologies do not provide enough
information about the reasons of user behaviour in the
real time constantly, many of these tools are
sophisticated in their design and ingenuity but lack
guidance on interpretation and analysis.
edX learning platform is not among the most
popular learning platforms in the world but has some
important strong parts, and its influence is growing.
Open source platform Open edX enables developers
to build and share assessment modules, so it is
possible to make changes to the appearance of the
learning platform and to add an additional
functionality in form of “xBlocks” which are
components of edX architecture and connects
different sources. edX encourages developers to
contribute to their Open edX initiative, and, thanks to
that combined efforts, edX platform has growing
number of new features and functions.
The Colour code method acts in a similar way to
voting systems - giving the user possibility to express
its process evaluation by clicking the appropriate
button, but, in addition, it also attaches chunks of
valuable metadata with each click. The Colour code
method, while still imperfect, is very versatile. In order
0%
20%
40%
60%
80%
100%
Tests Peer
review
Learning
items
Homework
In process Done Problem
CSEDU 2018 - 10th International Conference on Computer Supported Education
170

to offer this method for a wider audience of edX users,
it has to go through severe tests and trials with possible
changes and technical upgrades to the current version.
Researchers are aware that current data gathering
approach may not be enough and that even more
advanced content marking approaches are needed.
Data analysis connected to course quality, learner
satisfaction and user behaviour in the course demands
some specific knowledge in programming and (big)
data analysis, that not every course developer has, and
usually the course developers and learners don’t have
an access to the raw data. So there is a need for user-
friendly and easy to interpret data visualisations
solution for both learners and course developers. This
would engage learners to use the codes more often
since they would be able to see the changes and
patterns of their behaviour in their profile. For course
developers, however, this information would
immediately give a feedback on the quality of course
material and student’s learning pace as well as help to
uncover possible issues associated.
The experiment is still continuing, but there are
some preliminary small data set available. The
conclusion is that system works as it should - the
colour buttons are there and the data is gathered when
a colour button is pressed. As mentioned in the
discussion, only part of the students used learning
platform and colour codes. The green button “done”
was pushed the most times (67.2% of all pushes), the
second largest was orange “process” (25.4%), but the
least - red “problem” button (7.4%). Mostly the codes
were used in online tests (75%), but some part went
to peer assessment (9%), informative learning
materials (8%) and homework (5%).
More research is to be made on this to analyse,
what is the correlation between students using the
learning platform and codes - whether they use codes
whenever they use the platform, or only partly.
Another interesting question arises - whether course
design correlates to the codes used for different
learning item types: for example, if 70% of learning
materials in the platform are videos, then will the
codes be used 70% on videos.
In this preliminary analysis descrete data was
analysed – how many pushes and why. In the future
it planned to deepen the analysis so that the time
parameters would be included and some conclusions
about session lengths could be drawn.
ACKNOWLEDGEMENTS
This research has been developed symbiotically with
a support of grant from the European Regional
Development Fund (ERFD/ERAF) project
“Technology Enhanced Learning E-ecosystem with
Stochastic Interdependences - TELECI”, Project
No.1.1.1.1./16/A/154, and international European
Project funded under the FLAG-ERA Joint
Transnational Call (JTC) 2016 FuturICT 2.0. Special
thanks to Jānis Kapenieks (jun.) for allowing to
experiment in his learning course and all the help.
REFERENCES
Attwell, G. (Ed.). (2006). Evaluating E-learning A Guide to
the Evaluation of E-learning (Vol. 2). Bremen,
Germany: Perspektiven-Offset-Druck. Retrieved from
http://www.pontydysgu.org/wp-content/uploads/2007/
11/eva_europe_vol2_prefinal.pdf.
Balogh, Z. M. (2013, Oct. 7.-9.). Assessment tools and
techniques for e-learning evaluation: Usage analysis
and survey sampling. Science and Information
Conference (SAI), 38-44.
Banday, M. T. (2014, March 20). Applications of e-Learning
in Engineering Education: A Case Study. Procedia -
Social and Behavioral Sciences, 123, 406-413.
Burns, M. (2014, December 8). Choosing An Online
Learning Platform: Which Makes Sense? Retrieved
from E-learning industriy: https://elearningindustry.
com/choosing-online-learning-platform-makes-sense.
de Lera, E. A. (2012, Oct 5). Designing Innovative Open
Spaces for Learning: The Case of the Open University
of Catalunya. Procedia - Social and Behavioral
Sciences, 55, 1000-1008.
Drucker, P. (2000). Putting more now into knowledge.
Forbes, 165 (11). Retrieved from http://tsulib.troyst.
edu.
Dzelzkaleja, L. K. (2016). Real-time Color Codes for
Assessing Learning Process. International Conference;
Meaning in Translation: Illusion of Precision, 11-13
May. 231, pp. 263-269. Riga: Procedia - Social and
Behavioral Sciences.
Dzelzkalēja, L. (2017). Real Time Color Codes in a
Classroom. Proceedings of 9th International
Conference on Computer Supported Education, 21-23
April, (pp. 111-117.). Portugal, Porto.
Fenton, W. (2015, May 29). edX. Retrieved from PC:
https://www.pcmag.com/article2/0,2817,2484806,00.a
sp.
Getting Smart, S. (2017, June 8). Smart List: 30 High-
Quality Learning Platforms Getting Smart Staff.
Retrieved from Getting smart: http://www.getting
smart.com/2017/06/smart-list-30-learning-platforms/
Goulart, J. (2016, Dec 29). Year in Review: edX in 2016.
Retrieved from edX: https://blog.edx.org/year-review-
edx-2016?track=blog.
Landowska, A. B. (2017). Limitations of Emotion
Recognition from Facial Expressions in e-Learning
Context. Proceedings of 9th International Conference
on Computer Supported Education, 21-23 April. Porto.
Colour Codes Method Digitalization in edX E-learning Platform
171

Laurinavicius, T. (2017, Feb. 22). 10 Platforms You Can
Use To Host Your Online Courses. Forbes. Retrieved
from https://www.forbes.com/sites/tomaslaurinavicius/
2017/02/22/host-your-online-courses/#446f20b463be.
Mauri, J. (2017, May 23). Learning Platforms: The
Ultimate Pocket Guide. Retrieved from E-learning
industry: https://elearningindustry.com/learning-plat
forms-ultimate-pocket-guide.
Mitra, A. G. (2008). Knowledge Reuse and Agile
Processes: Catalysts for Innovation. New York:
Information Science Reference.
Moodle. (2016, Dec.). Moodle Statistics. Retrieved from
https://moodle.net/stats/
Open edX. (2017). Retrieved from XBlocks:
https://open.edx.org/xblocks.
Rezende, W. J. (2017). Use of Augmented Reality to
Support Education - Creating a Mobile E-learning Tool
and using it with an Inquiry-based Approach.
Proceedings of 9th International Conference on
Computer Supported Education, 21-23 April. Porto.
Schumacher, C. I. (2018, Jan). Features students really
expect from learning analytics. Computers in Human
Behaviour, 78, 397-407.
Siemens, G. (2005, August 10). Connectivism: Learning as
Network-Creation. Retrieved January 22, 2017, from E-
learning space Web site: http://www.elearnspace.org/
Articles/networks.htm.
Soares, D. C. (2013). Discovering collaborative
knowledge-intensive processes through e-mail mining.
Journal of Network and Computer Applications, 36,
1451–1465.
Toren, A. (2015, October 6.). 6 Cloud-Based Learning
Platforms That Can Help Educate Your Workforce.
Enterpreneur. Retrieved from https://www.entre
preneur.com/article/251156.
CSEDU 2018 - 10th International Conference on Computer Supported Education
172
