
Minimum Collection Period for Viable Population Estimation from
Social Media
Samuel Lee Toepke
Private Engineering Firm, Washington DC, U.S.A.
Keywords:
Population Estimation, Volunteered Geographic Data, Twitter, Amazon Web Services, Social Media, Collec-
tion Period, Enterprise Architecture, Botometer.
Abstract:
Using volunteered geographic information for population estimation has shown promise in the fields of urban
planning, emergency response and disaster recovery. A high volume of geospatially enabled Tweets can be
leveraged to create population curves and/or heatmaps delineated by day of week and hour of day. When
making these estimations, it is critical to have adequate data, or the confidence of the estimations will be
low. This is especially pertinent to disaster response, where Tweet collection for a new city/town/locale may
need to be rapidly deployed. Using previously leveraged data removal methods, temporal data quantity is
explored using sets of data from increasingly longer collection periods. When generating these estimates, it is
also necessary to identify and mitigate data from automated Twitter bots. This work examines the integration
of a modern, web services based, Twitter bot assessment algorithm, executes data removal experiments on
collected data, describes the technical architecture, and discusses results/follow-on work.
1 INTRODUCTION
Smart devices, e.g. tablets, smart phones, wearables,
etc. continue to grow in popularity, and are acces-
sible to a large percentage of the world’s population
(Poushter, 2016). Smart phones expose the user to
a pervasive Internet connection, and a rich suite of
sensors. Access to the global navigation satellite sys-
tem (GNSS) is a common smart phone functional-
ity; coupled with a social media service, it is possible
for the user to create volunteered geospatial informa-
tion (VGI) (Aubrecht et al., 2016). VGI includes lati-
tude/longitude, and the actual content of the data e.g.
an image, text, sensor reading, etc. This data is use-
ful for many tasks including environmental sensing,
population estimation, urban planning, event detec-
tion (Doulamis et al., 2016), etc.
It has been shown that VGI from social media ser-
vices can be used to supplement population estima-
tions in an urban area at high spatiotemporal resolu-
tion (Sinnott and Wang, 2017) (Liang et al., 2013).
The estimations can be readily visualized using a
heat map overlaid on a geospatial information system
(Wood et al., 2007), or by using population curves
over time of week/day. This is especially useful in
the domain of emergency response and disaster re-
covery; when precisely directing resources/response
to those affected is of paramount concern. Often,
when a disaster occurs, it is necessary for first re-
sponders to set up in an area where no social media
data collection has previously taken place. If collec-
tion/processing code for social media feeds pertinent
to the geographic area is deployed immediately, it is
critical to know how much confidence a user can ap-
ply to the collected data. Generally, attaining more
data will lead to a more complete picture; but how
much data is enough before one can make a popula-
tion estimation with confidence? When is it safe to
discard data, as it is no longer adding value to the end
product, but taking up bandwidth, storage space and
processing power?
Under the assumption that the estimation will
eventually become saturated, e.g. having more data
points no longer adds resolution to the end result; pre-
vious work (Toepke, 2017) has focused on data re-
moval experiments using publicly available Twitter
data. Using a full data set as the objective measure,
Tweets were randomly removed in increasing steps
of 10%, and the error between each resulting curve
and the full data was calculated. Results showed a re-
silience to loss, with resulting curves still providing
useful insight into population movement throughout
the day. This current work focuses on leveraging the
previously utilized experimentation framework, and
138
Toepke, S.
Minimum Collection Period for Viable Population Estimation from Social Media.
DOI: 10.5220/0006803901380147
In Proceedings of the 4th International Conference on Geographical Information Systems Theory, Applications and Management (GISTAM 2018), pages 138-147
ISBN: 978-989-758-294-3
Copyright
c
2019 by SCITEPRESS – Science and Technology Publications, Lda. All rights reserved

repeating the data removal experiments, but using in-
creasing amounts of data for each set of experiments.
The first run includes 1 week of data, and the last run
includes 8 weeks of data, with the data set increasing
in 1 week steps. Previous work only used the experi-
mental framework on one static set of data, which was
approximately five months worth of collected Tweets.
Determining how much data is required for a con-
fident estimation in a given geospatial area is chal-
lenging. Comparison of the generated VGI estima-
tions against an objective measure would greatly in-
crease confidence; unfortunately, baselines with ade-
quate spatiotemporal resolution are not readily avail-
able. Some of the leading population estimation
projects include LandScan (Rose and Bright, 2014)
from Oak Ridge National Labs and Urban Atlas from
the Joint Research Centre at the European Commis-
sion (Batista e Silva et al., 2013). To provide a mea-
sure, both products fuse disparate sets of input data
e.g. census tracts, commune boundaries, soil seal-
ing layers, land cover, slope, etc. With a resolu-
tion of approximately 30 mˆ2 for Landscan (including
day/night models) and approximately 10 mˆ2 (Coper-
nicus, 2017) for Urban Atlas, both products are high
quality, but lack the required spatiotemporal resolu-
tion for adequate comparison.
One solution would be to find a constrained
geospatial area, e.g. a corporate/university
campus that implements active security to all
rooms/locations/spaces/etc. With a large enough
social media user-base as well as cooperation from
the owners, the objective human presence data
could be compared against models attained through
social media aggregation, with the goal of creating a
confidence measure.
For the purposes of this population representation,
it is critical to have human-generated data. One of the
ways manipulation of social media can negatively af-
fect the estimation is through the use of Twitter bots
(Subrahmanian et al., 2016). Twitter bots are coded
by humans, and use Twitter to push an agenda; pop-
ular goals include advertising, responding to other
bots’ keywords to increase re-Tweets, humor, etc. Ir-
relevant of the bot’s purpose, if code is generating
geospatially enabled Tweets, then the Tweets should
be removed from the dataset as they don’t represent
a human presence. A web services based bot detec-
tion framework will be leveraged on a subset of the
Tweets collected to ascertain whether the data was
human generated. The bot detection functionality is
implemented as a proof of concept, and will need to
be extended further.
This work will discuss the results of the data re-
moval experiments using sets of data with increas-
ing quantity, explore the bot-ness of the accounts in
the data set, delineate architectural details and present
follow-on work.
2 BACKGROUND
Within recent years, many free social media services
have been created which allow for the generation of
VGI. Each of the most popular services focus on
different niches, e.g. Facebook is a full social en-
vironment, Instagram is ideal for posting pictures,
Foursquare is a location finding service, and Twitter
allows for the end-user to post textual messages called
Tweets. Twitter exposes a powerful application pro-
gramming interface (API), that allows developers and
researchers access to public Twitter data. Using any
compatible programming language, an interested per-
son can query the APIs for Tweets of interest, Tweets
from a specific user, Tweets in a given area, etc. and
retrieve an immense amount of data (Poorthuis et al.,
2014).
Social media services are effectively utilized by
users with modern smart phones. Today’s devices
have advanced GNSS units that can provide inex-
pensive location reporting with reasonable precision
(Dabove and Manzino, 2014). With these technolo-
gies in place, they become powerful tools, especially
in the case of facilitating disaster response (Caragea
et al., 2011) (Khan et al., 2017). Despite the pop-
ularity of the services/devices, it is necessary to un-
derstand that full adoption has not been implemented.
There are subsets of the population that do not gener-
ate social media data, e.g. the very young/old, tech-
nology non-adopters, those who face socio-economic
challenges, etc. (Li et al., 2013). The combination of
social media based population estimations with tra-
ditional methods can be beneficial towards the goal
of creating a more complete operating picture, even
in data-constrained small areas. (Lin and Cromley,
2015) (Anderson et al., 2014).
One of the primary benefits of VGI, the ability
to attain data from untrained sources at low/no cost
(See et al., 2016), also introduces risks that must be
mitigated. Ideally, the contributor is human and non-
malicious; unfortunately, impetus exists to contribute
purposefully incorrect data. Especially in the case of
using social media to respond to disasters, erroneous
data can contribute to innocuous pranks, interference
with the movement of supplies, or to maliciously fa-
cilitate further disaster (Lindsay, 2011).
Recent research includes developing ways to clas-
sify Twitter accounts based on a combination of mark-
ers. BotOrNot, a system to evaluate social bots (Davis
Minimum Collection Period for Viable Population Estimation from Social Media
139
et al., 2016), was created and deployed such that end-
users can gain insight into bot-like behavior for a
Twitter account. BotOrNot (from here on referred to
by its current name, Botometer) is utilized on this in-
vestigation’s Twitter data as a proof of concept.
To classify an account, Botometer requires the fol-
lowing input:
• User Information, including id and username.
• Tweet Timeline, a full list of the user’s Tweets,
and associated information.
• Mentions, a list of the user’s Tweets, and associ-
ated information, where another Twitter account
is mentioned in the text of the Tweet.
Using various models and machine learning tools,
Botometer returns scores about the following features
for an account (Varol et al., 2017):
• User: considers the metadata of a user’s account.
• Friend: evaluates interconnections between
friends of the user.
• Network: checks how retweets and mentions in-
teract with each other.
• Temporal: includes analysis of when Tweets are
made as well as frequency of Tweets.
• Content and language: looks for natural language
components in each Tweet text.
• Sentiment: evaluates the attitude/feeling of Tweet
content.
The service also returns an aggregate score
considering the Tweet text is written in English,
or a universal score, which removes the con-
tent/language/sentiment considerations. Exploration
of Botometer as applied to this Twitter data is fur-
ther discussed in the following architecture and re-
sults sections.
The Lisbon Metropolitan Area and five major
cities in the United States of America (US) are the
geospatial areas of interest for this work. Lisbon was
picked to supplement previous work, in which the rea-
sons for the US cities are fully described (Toepke,
2017). The cities are as follows:
• San Diego, California (CA).
• San Francisco, CA.
• San Jose, CA.
• Portland, Oregon (OR).
• Seattle, Washington (WA).
3 ARCHITECTURE
The VGI utilized in this project is retrieved several
times an hour from the public Twitter API using web
service calls, from a cloud-based enterprise system.
The Search API (Twitter, 2017) is utilized extensively
for the North American cities, and the infrastructure
is fully described in (Toepke, 2017).
Querying the Search API presents a number of
challenges:
• Rate-limiting of requests: for each Twitter devel-
oper account, only 180 requests are permitted in-
side of a fifteen minute window.
• Maximum limit on returned Tweets from each re-
quest: with a current limit of 100 Tweets. Thus
for each fifteen minute window, a maximum of
18,000 Tweets can be retrieved.
• Circular geospatial query: instead of a quadran-
gle, the geospatial queries are defined as a func-
tion of circle-center (latitude/longitude), and ra-
dius in either miles or kilometers.
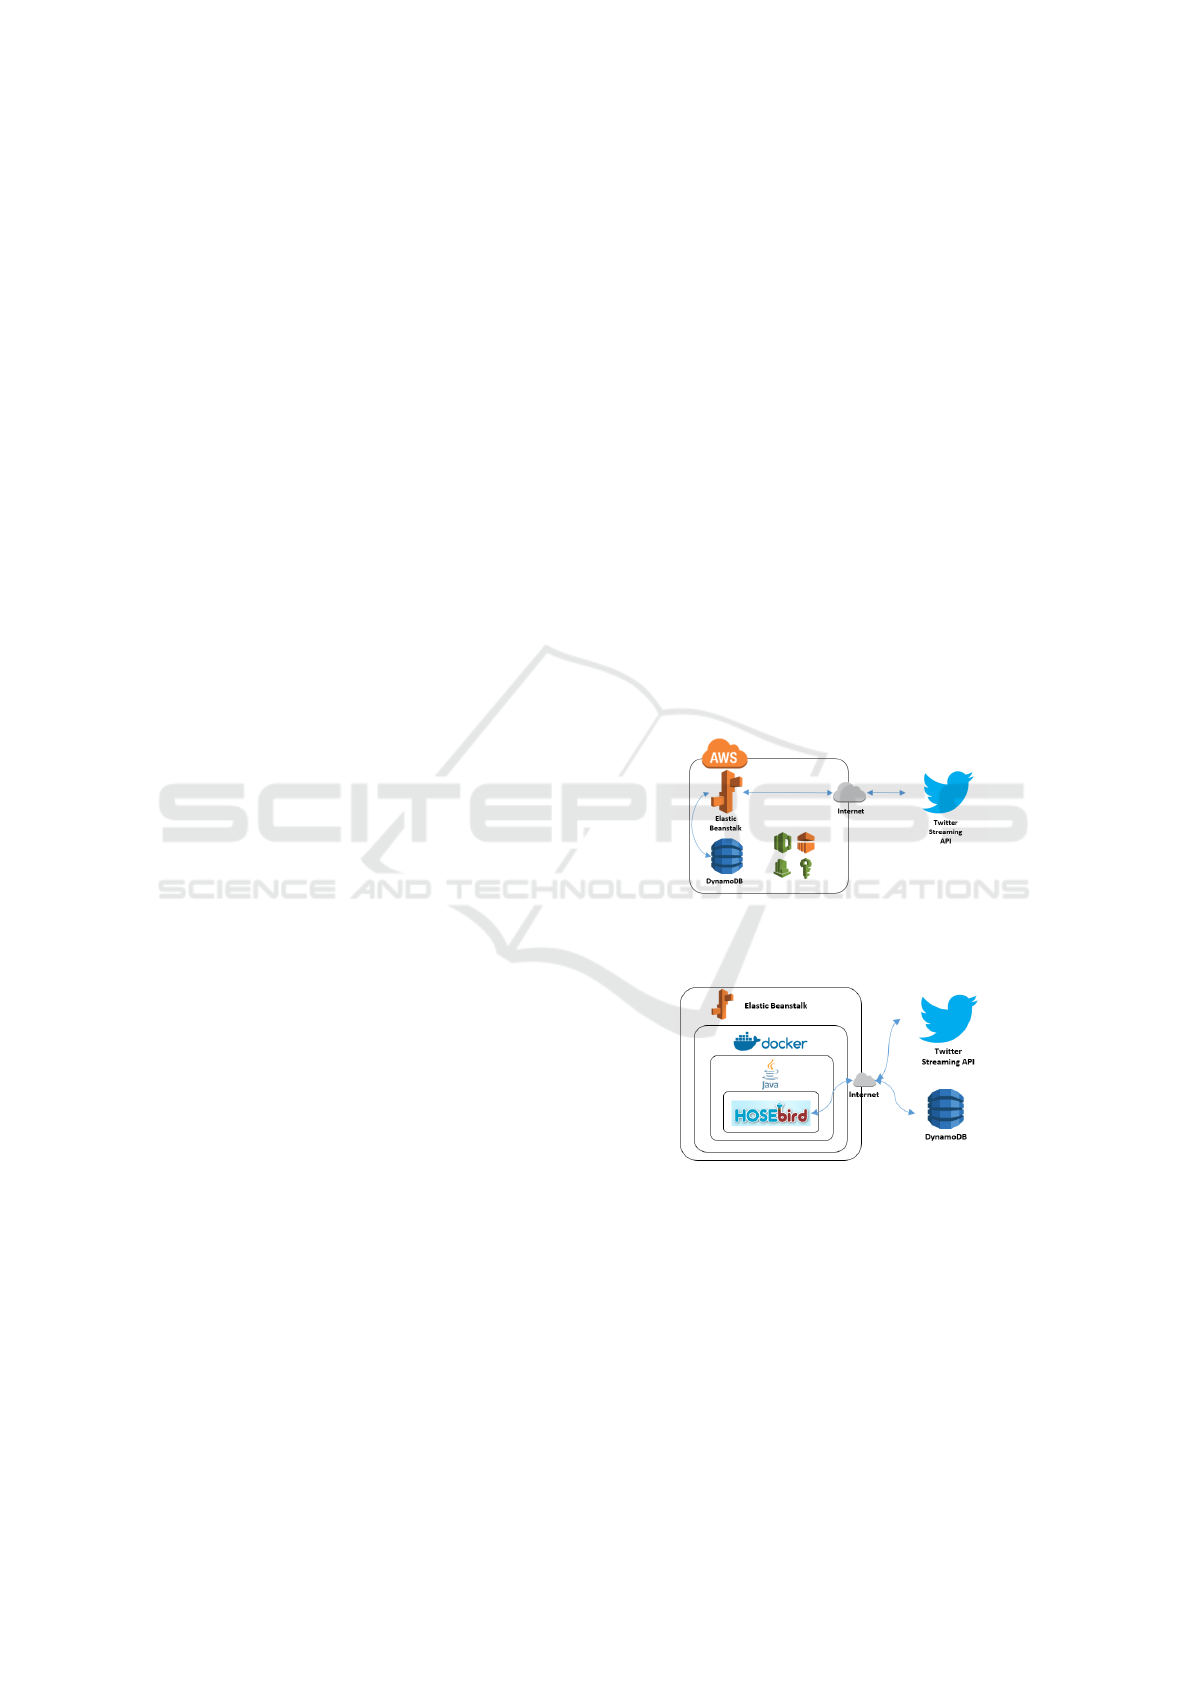
Figure 1: AWS Twitter Streaming Query/Storage Architec-
ture.
Figure 2: Software Layers for Streaming Query/Storage.
These limitations create an optimization problem,
where a developer attempts to cover the maximum
amount of geographic area, while minimizing the pos-
sibility of lost Tweets. The circular query-area with
limited maximum response is especially challenging;
to fully cover an area, overlap in the queries is un-
avoidable, with duplicate results being filtered out on
the developer’s end before database insertion. It is
also important to ensure the queries don’t saturate,
e.g. if a developer chose the center of the circle to
GISTAM 2018 - 4th International Conference on Geographical Information Systems Theory, Applications and Management
140

be a downtown area, then made the radius 3 miles,
one would get back 100 Tweets for every request; but
many Tweets would be lost in the response from the
Twitter API. Each circular query has to be made small
enough such that a reasonable amount of Tweets are
returned below the limit.
With trial and error, a set of queries for the
US cities was “dialed-in” such that they consistently
cover an area, while returning an inundation of ap-
proximately 30% on average. This low average re-
duces the geospatial area that can be covered, but pro-
tects against a large burst of Tweets during a special
event. Nonetheless, there is a maximum amount of
queries that can exist per time period per developer
account, so this is not a holistic solution.
To resolve these limitations, Twitter also makes
available a Streaming API, which once connected to,
will continuously push Tweets to the consumer. The
Streaming API can be configured to return Tweets
from multiple geospatial areas, which is convenient
for this use case, as only one solution needs deployed
for multiple areas of interest.
Implementing software for the Streaming API re-
quires a different architecture than the Search API.
As long as the consumer has the processing power to
process Tweets, and the network connection remains
alive, the Twitter API will continue to return data.
This requires creating a solution that is fully avail-
able, properly sized, and resilient to software fail-
ures as well as the eventual disconnections that occur
when using web services. Architecture blueprint can
be seen in Figure 1. Software layers can be seen in
Figure 2.
The solution for the Streaming API was designed
as follows:
• Amazon Web Services (AWS) Elastic Beanstalk
(ELB): an orchestration product that provides a
server-as-a-service. Current support for environ-
ments includes Java, Python, PHP, .NET, Ruby,
NODE.js and Docker. ELB manages all the back-
end server provisioning, networking, fail-over,
updates, security, etc., allowing the end-user to
focus on the code to be deployed. (Amazon.com,
2017)
• Docker: containerization software that allows for
repeatable packaging and deployment of execu-
tion environments as well as code. A Docker-
file for Ubuntu 14.04 was created with all up-
dates, necessary permissions, ancillary packages,
and built source code.
• Java: a high-level, object oriented programming
language which was used to create the code that
makes the connection to the Twitter API, and pro-
cess Tweets.
• Cron: a job scheduler used in UNIX/Linux, and
is configured in the Docker container to begin the
Java code when the container is first started. The
custom Java software remains up indefinitely, un-
less a catastrophic error occurs. Using GNU’s
‘flock’ command, the Cron job runs every minute,
looking to see if the Java code has stopped execu-
tion, if so, it restarts the code.
• Hosebird Client: an open-source Java library
which manages the ongoing connection to the
Twitter Streaming API. The library securely
makes the connection, passes geospatial query pa-
rameters, takes action on the incoming Tweets,
and intelligently reconnects to the service in the
case of a network connection break. (Client,
2017)
• AWS DynamoDB: a NoSQL datastore-as-a-
service that is used for Tweet storage. Like ELB,
DynamoDB abstracts the database, and prevents
the end-user from spending time on underlying
administration details.
• AWS CodeCommit, AWS Identity and Access
Management, AWS CloudWatch and AWS Elas-
tic MapReduce (EMR) are used for version con-
trol, security, monitoring, and data export, respec-
tively.
The architecture was implemented and is cur-
rently being used to download Tweets from the Lis-
bon Metropolitan Area. Once the Tweets have
been collected from all cities, they are exported
from DynamoDB to a local machine for processing.
The export functionality uses AWS EMR, big-data-
frameworks-as-a-service, to rapidly copy data from
DynamoDB to a text file. The resulting Tweets are
then used in a number of data removal experiments,
of differing time periods, for each city, to ascertain
a minimum viable length of time for data collection.
The last step in processing, creating visualizations
from the data, is completed using GNU Octave (Eaton
et al., 2007), an open-source MATLAB alternative.
A subset of all collected Tweets is used for the
data removal experiments; the Tweets are for all
cities, published in May/June 2017. Arbitrary months
were chosen, with the amount of Tweets being ap-
propriate for integration with Botometer considering
time/API constraints.
The authoring research team deployed Botometer
as a representational state transfer web service, and
presents an API through the Mashape API Market-
place (Mashape, 2017). The endpoint is web acces-
sible by any compatible programming language, and
requires a Mashape API key for access. Another con-
straint is that for each account that is being queried,
Minimum Collection Period for Viable Population Estimation from Social Media
141

the Twitter API must be queried several times to build
content for the Botometer request. Careful considera-
tion of rate-limiting was required when designing the
architecture, as the Twitter API currently only allows
180 requests per 15 minute window.
To facilitate easy data manipulation, a Post-
greSQL database was used with the PostGIS ex-
tensions to execute geographic queries. A custom
Python script, leveraging Botometer’s suggested li-
brary, botometer-python (GitHub, 2017), was used
to collect/populate the bot classification information
over a span of several days.
4 POPULATION REMOVAL
EXPERIMENTS
RESULTS/OBSERVATIONS
The experimental data consists of geospatially en-
abled posts from the Twitter API occurring from
2017-05-01 00:00:00 (GMT) to 2017-06-26 00:00:00
(GMT) for a total of 179,598 Tweets, from six cities,
published from 30,007 unique Twitter accounts. Pub-
licly available web service APIs were used to down-
load the data in a JavaScript Object Notation (JSON)
format.
While the collected dataset is much larger and
available, Tweets starting in May 2017 and going
for eight weeks are sufficient for this work. Also of
note, the Lisbon data collection code started collect-
ing Tweets as of 2017-04-16 14:38:07 (GMT), and its
area of interest is larger than that of the U.S. cities.
The average query area for each U.S. city is approxi-
mately 3.26 kmˆ2, and the query area for Lisbon is ap-
proximately 691.61 kmˆ2. The size of the query areas
in the U.S. cities were designed such that they cover
the downtown core areas adequately, while minimiz-
ing REST API calls. Lisbon has a much larger area of
interest because it was the initial test case for leverag-
ing Twitter’s Streaming API.
The raw Tweet count for the different cities varies,
and can be seen in Table 1, and visualized in Figure
3.
Table 1: Total Tweet Count Per City, 2017-05-01 to 2017-
06-26.
City Tweet Count
San Jose, CA 14,975
San Francisco, CA 18,797
Portland, OR 31,848
Lisbon, Portugal 31,854
San Diego, CA 33,163
Seattle, WA 40,271
Figure 3: Total Tweet Count Per City, 2017-05-01 to 2017-
06-26.
For each city, the data is broken up into different
days of the week, and then broken up into different
hours of the day. The end result is a graph showing
the patterns of Tweets throughout a day. As the dif-
ferent cities receive a different volume of Tweets, the
graphs are normalized using a standard method (Abdi
and Williams, 2010). An example of the normalized
hourly data for each city for a specific day of the week
can be seen in Figure 4.
Random data removal in increasing steps of
10% is then affected using Java code. The root
mean square error (RMSE) (Chai and Draxler, 2014)
(Holmes, 2000) is calculated for each resulting hour-
of-day graph, compared against the full set of data.
An example graph showing data removal in increas-
ing steps of 20% can be seen in Figure 5. The steps of
10% are calculated, but only steps of 20% are shown
in the graph to remove clutter, and make it easier to
visualize movement of the plots. As the amount of
data is removed, one can see the data plots increas-
ingly moving away from the full dataset line.
The RMSE experiments are run eight times, start-
ing from May 1, 2017, and using data from an increas-
ing amount of days: 7, 14, 21, 28, 35, 42, 49, and
56. The time periods were chosen arbitrarily, increas-
ing each time by one week. The data removal experi-
ments were run until saturation became apparent with
the increasing amount of days. Results from the first
set, using one week’s worth of data, can be seen in
the top part of Figure 6, a line for Lisbon is not repre-
sented due to an inadequate amount of data for those
days. As removal of data increases, RMSE as com-
pared with the full data increases. Results from the
last set, using eight week’s worth of data, can be seen
in the bottom part of Figure 6. The average RMSE
has decreased by approximately 50%, and the slope
of the RMSE between ˜10% data loss and ˜80% data
loss is visibly flatter, with the population estimation
showing increasing resilience to data loss.
Figure 7 shows all the cities averaged together for
each data collection length. Once about 5 weeks of
data is collected, a decreasing return on increased data
GISTAM 2018 - 4th International Conference on Geographical Information Systems Theory, Applications and Management
142
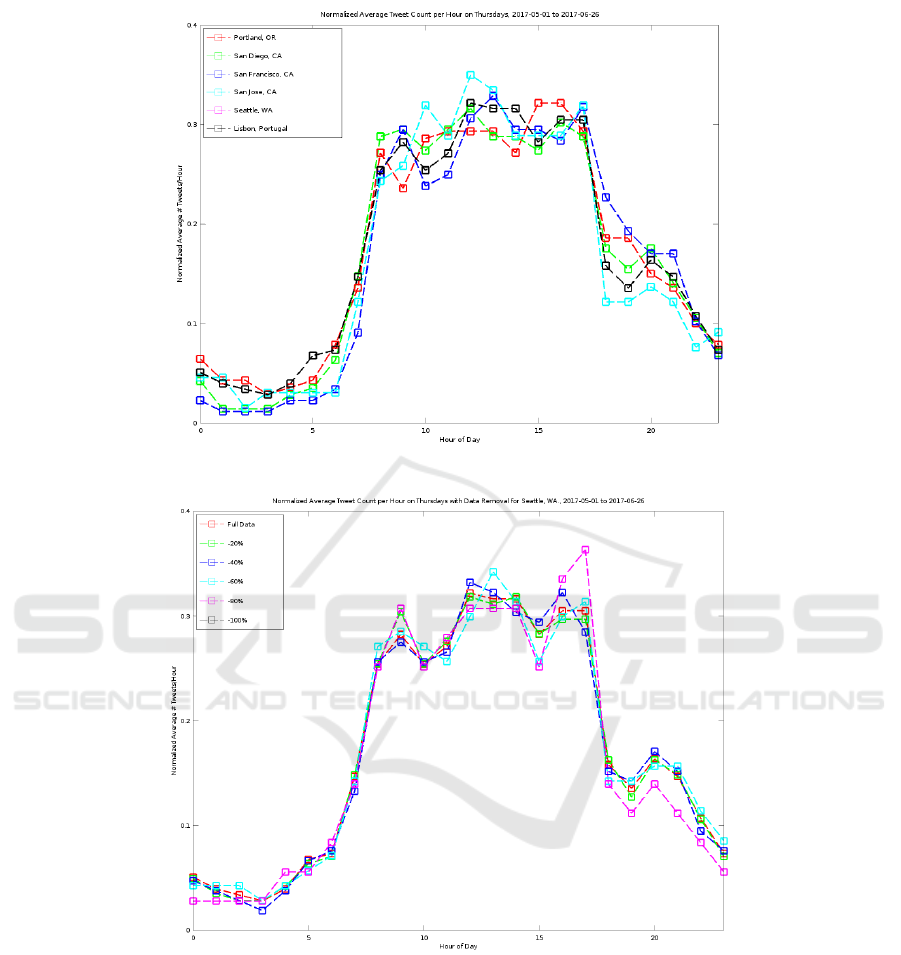
Figure 4: Normalized Average Tweet Count Per Hour on Thursdays, 2017-05-01 to 2017-06-26.
Figure 5: Normalized Average Tweet Count Per Hour on Thursdays with Data Removal for Seattle, WA., 2017-05-01 to
2017-06-26.
can start to be seen. The estimation is becoming satu-
rated with approximately 8 weeks worth of data; indi-
cating that a reasonable population estimation can be
gleaned from between about 6 and 8 weeks worth of
collected data.
5 BOTOMETER
RESULTS/OBSERVATIONS
For the dataset’s time period, there are 30,007 unique
Twitter users who made posts for all six cities
of investigation. Python code was used to query
the Botometer web service service, and the En-
glish/Universal scores were updated in the PostGIS
database for each Twitter user. An example return
Minimum Collection Period for Viable Population Estimation from Social Media
143
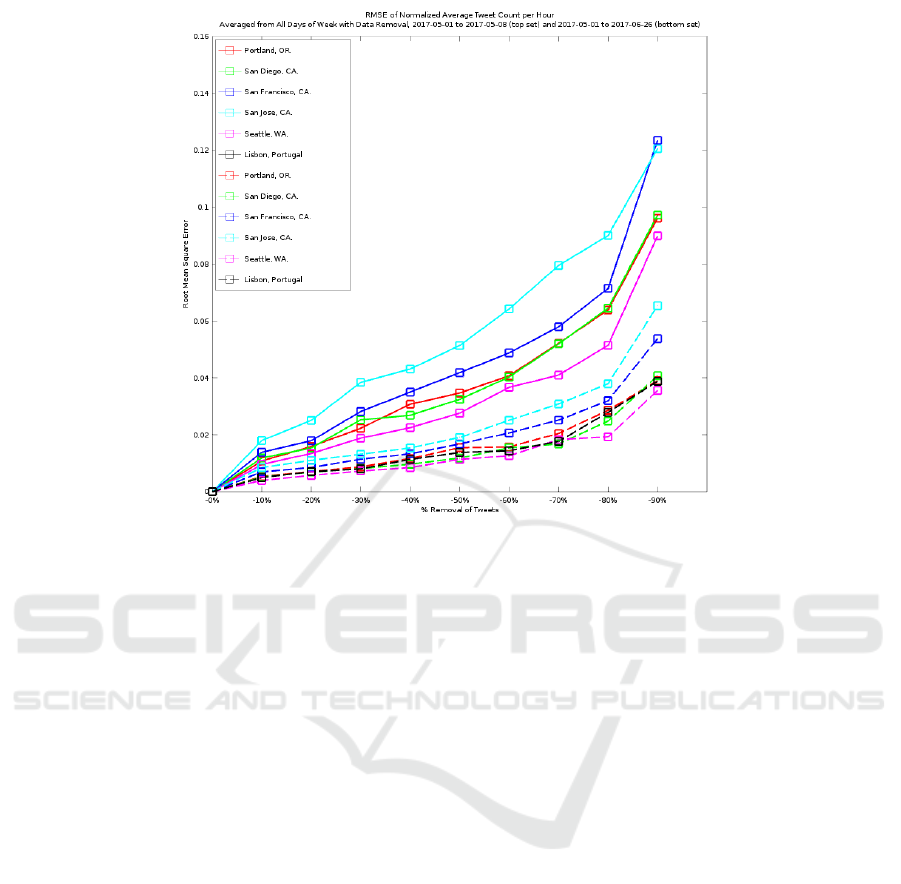
Figure 6: RMSE of Normalized Average Tweet Count per Hour Averaged from All Days of Week with Data Removal,
2017-05-01 to 2017-05-08 (top set) and 2017-05-01 to 2017-06-26 (bottom set).
from the service can be viewed as JSON below.
{
‘categories’ : {
‘content’ : 0.34,
‘friend’ : 0.25,
‘network’ : 0.24,
‘sentiment’ : 0.27,
‘temporal’ : 0.35,
‘user’ : 0.02
},
‘scores’ : {
‘english’ : 0.26,
‘universal’ : 0.24
},
‘user’ : {
‘id_str’ : ‘XXXXXXXXXX’,
‘screen_name’ : ‘YYYYYYYYYY’
}
}
For each category, a decimal value between 0 and
1 is returned. If the value is more towards 0, it indi-
cates less bot-like behavior; as the value is more to-
wards 1, it indicates more bot-like behavior. Botome-
ter does not claim to be infallible, detection is diffi-
cult, and can create false results. According to the
Botometer instructions, the best way to interpret an
aggregate score is as follows.
• Green, between 0.00 and 0.39, likely not a bot.
• Yellow, between 0.40 and 0.60, classifier is unable
to determine bot-ness.
• Red, between 0.61 and 1.00, likely a bot.
For the above random user, based on Botometer’s
heuristics, they are likely not a bot. Indeed, a topical
inspection of the account’s Twitter page is indicative
of the user being human.
All of the 30,007 accounts were run through
the Botometer, with 835 accounts, or approximately
2.78% of the accounts, not retrieving data. The
service either responded with “Not authorized.” or
“Sorry, that page does not exist.”; either the user has
changed their privacy settings since the Tweets were
collected, or the account is no longer available.
The five US cities use English as their primary lan-
guage, so the aggregate ‘english’ score was used from
Botometer. As the Lisbon Metropolitan Area primar-
ily speaks Portuguese, the aggregate ‘universal’ score
was used. Results for all Tweets can be visualized in
Figure 8.
It can be seen that approximately 29% of the Twit-
ter accounts can be classified as bot-like (red), and ap-
proximately 23% listed as ambiguous (yellow) based
on the Botometer classification algorithms. These re-
sults are indicative that bot-like accounts are perva-
sive, and identification/removal is necessary for an ac-
curate population estimation from VGI.
GISTAM 2018 - 4th International Conference on Geographical Information Systems Theory, Applications and Management
144
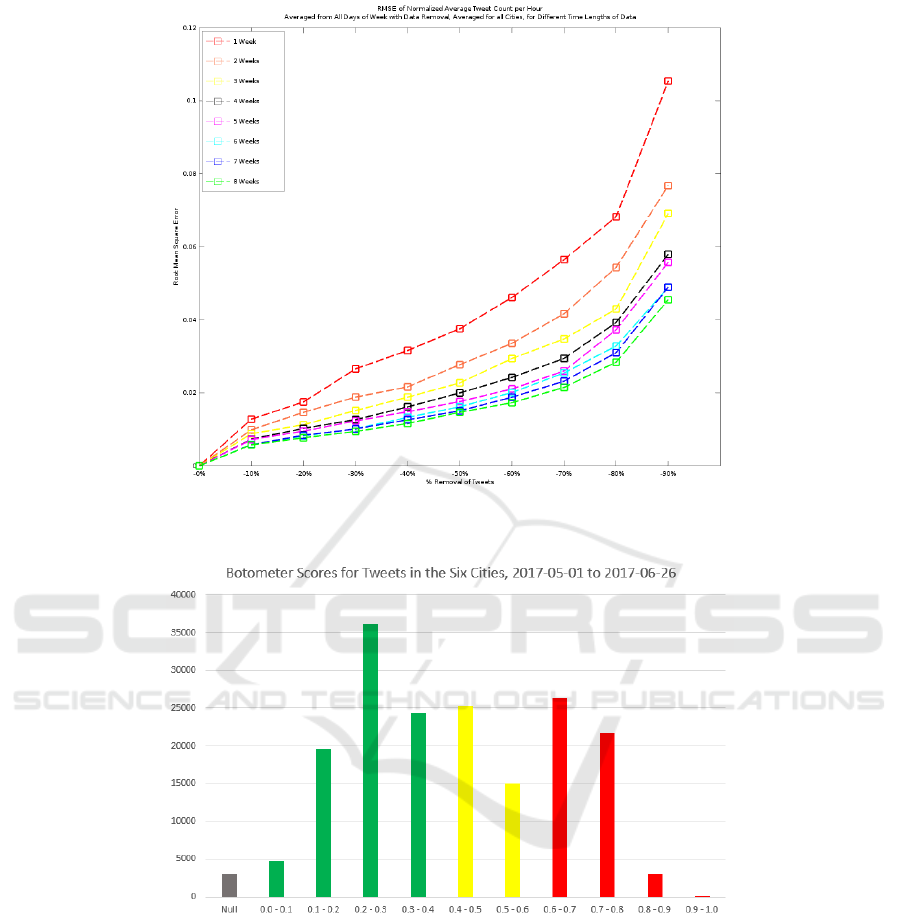
Figure 7: RMSE of Normalized Average Tweet Count per Hour Averaged from All Days of Week with Data Removal,
Averaged for all Cities, for Different Time Lengths of Data.
Figure 8: Botometer Scores for Tweets in the Six Cities, 2017-05-01 to 2017-06-26.
6 FOLLOW-ON WORK
• One of the drawbacks of the current implementa-
tion is that Twitter is the only social media service
that is being used. Obtaining data from other pop-
ular social media products, and performing sim-
ilar tests, can create more insight into the mini-
mum viable estimation time period. Implemen-
tation/extension of the Botometer algorithms for
other social media services would also be useful.
• The current bot detection implementation is a pro-
totype, functioning only on the data exported for
processing. The architecture would benefit from
using web services to create a psuedo-realtime
connection to the Botometer service, annotating
Tweets after retrieval from the Twitter API, and
before insertion into DynamoDB. A local support
table, holding the bot-ness data for each Twitter
user would greatly reduce calls to the Botometer
web service.
• A total overhaul of the architecture is required,
Minimum Collection Period for Viable Population Estimation from Social Media
145

mainly to accommodate the Twitter Search API
restrictions. The Streaming API prototype us-
ing Docker/ELB has proven successful, the five
American cities can be ported to this architecture
with minimal difficulty.
7 CONCLUSIONS
This work has built on previous investigations, fur-
ther exploring temporal implications of population es-
timations from social media data. A new architecture
was deployed, new data from Lisbon, Portugal was
attained, and a modern bot detection algorithm was
explored. Using removal techniques from previous
work, experiments were run on different time peri-
ods, in multiple cities, to create a baseline minimum
amount of time that collection code would have to run
(6-8 weeks), before a population estimation with rea-
sonable confidence can be obtained. This is pertinent
when a new geographic area is being investigated, or
a new social media feed is being implemented for an
existing area. Having a minimum viable time period
can bring a greater confidence to the end user when
leveraging this method for population estimation.
REFERENCES
Abdi, H. and Williams, L. (2010). Normalizing data. En-
cyclopedia of research design. Sage, Thousand Oaks,
pages 935–938.
Amazon.com, I. (2017). Aws elastic beanstalk - deploy web
applications.
Anderson, W., Guikema, S., Zaitchik, B., and Pan, W.
(2014). Methods for estimating population density
in data-limited areas: Evaluating regression and tree-
based models in peru. PloS one, 9(7):e100037.
Aubrecht, C.,
¨
Ozceylan Aubrecht, D., Ungar, J., Freire, S.,
and Steinnocher, K. (2016). Vgdi–advancing the con-
cept: Volunteered geo-dynamic information and its
benefits for population dynamics modeling. Transac-
tions in GIS.
Batista e Silva, F., Poelman, H., Martens, V., and Lavalle,
C. (2013). Population estimation for the urban atlas
polygons. Joint Research Centre.
Caragea, C., Mcneese, N., Jaiswal, A., Traylor, G.,
Woo Hyun, K., Mitra, P., Wu, D., H Tapia, A., Giles,
L., Jansen, J., and Yen, J. (2011). Classifying text
messages for the haiti earthquake. 8th International
Conference on Information Systems for Crisis Re-
sponse and Management: From Early-Warning Sys-
tems to Preparedness and Training, ISCRAM 2011.
Chai, T. and Draxler, R. R. (2014). Root mean square er-
ror (rmse) or mean absolute error (mae)?–arguments
against avoiding rmse in the literature. Geoscientific
Model Development, 7(3):1247–1250.
Client, H. (2017). Github - twitter/hbc: A java http client
for consuming twitter’s streaming api.
Copernicus (2017). Urban atlas 2012 - copernicus land
monitoring service.
Dabove, P. and Manzino, A. M. (2014). Gps & glonass
mass-market receivers: positioning performances and
peculiarities. Sensors, 14(12):22159–22179.
Davis, C. A., Varol, O., Ferrara, E., Flammini, A., and
Menczer, F. (2016). Botornot: A system to evaluate
social bots. In Proceedings of the 25th International
Conference Companion on World Wide Web, pages
273–274. International World Wide Web Conferences
Steering Committee.
Doulamis, N. D., Doulamis, A. D., Kokkinos, P., and Var-
varigos, E. M. (2016). Event detection in twitter
microblogging. IEEE transactions on cybernetics,
46(12):2810–2824.
Eaton, J. W., Bateman, D., and Hauberg, S. (2007). GNU
Octave version 3.0. 1 manual: a high-level interactive
language for numerical computations. SoHo Books.
GitHub (2017). Github - iunetsci/botometer-python: A
python api for botometer by osome.
Holmes, S. (2000). Rms error.
Khan, S. F., Bergmann, N., Jurdak, R., Kusy, B., and
Cameron, M. (2017). Mobility in cities: Comparative
analysis of mobility models using geo-tagged tweets
in australia. In Big Data Analysis (ICBDA), 2017
IEEE 2nd International Conference on, pages 816–
822. IEEE.
Li, L., Goodchild, M. F., and Xu, B. (2013). Spatial, tem-
poral, and socioeconomic patterns in the use of twitter
and flickr. cartography and geographic information
science, 40(2):61–77.
Liang, Y., Caverlee, J., Cheng, Z., and Kamath, K. Y.
(2013). How big is the crowd?: event and location
based population modeling in social media. In Pro-
ceedings of the 24th ACM Conference on Hypertext
and Social Media, pages 99–108. ACM.
Lin, J. and Cromley, R. G. (2015). Evaluating geo-located
twitter data as a control layer for areal interpolation of
population. Applied Geography, 58:41–47.
Lindsay, B. R. (2011). Social media and disasters: Current
uses, future options, and policy considerations.
Mashape (2017). Botometer api documentation.
Poorthuis, A., Zook, M., Shelton, T., Graham, M., and
Stephens, M. (2014). Using geotagged digital social
data in geographic research.
Poushter, J. (2016). Smartphone ownership and internet us-
age continues to climb in emerging economies. Pew
Research Center, 22.
Rose, A. N. and Bright, E. A. (2014). The landscan global
population distribution project: current state of the
art and prospective innovation. Technical report, Oak
Ridge National Laboratory (ORNL).
See, L., Mooney, P., Foody, G., Bastin, L., Comber, A., Es-
tima, J., Fritz, S., Kerle, N., Jiang, B., Laakso, M.,
et al. (2016). Crowdsourcing, citizen science or vol-
unteered geographic information? the current state of
crowdsourced geographic information. ISPRS Inter-
national Journal of Geo-Information, 5(5):55.
GISTAM 2018 - 4th International Conference on Geographical Information Systems Theory, Applications and Management
146

Sinnott, R. O. and Wang, W. (2017). Estimating micro-
populations through social media analytics. Social
Network Analysis and Mining, 7(1):13.
Subrahmanian, V., Azaria, A., Durst, S., Kagan, V., Gal-
styan, A., Lerman, K., Zhu, L., Ferrara, E., Flammini,
A., and Menczer, F. (2016). The darpa twitter bot chal-
lenge. Computer, 49(6):38–46.
Toepke, S. L. (2017). Data density considerations for crowd
sourced population estimations from social media. In
Proceedings of the 3rd International Conference on
Geographical Information Systems Theory, Applica-
tions and Management - Volume 1: GISTAM,, pages
35–42. INSTICC, SciTePress.
Twitter, I. (2017). Search api: search/tweets – twitter devel-
opers.
Varol, O., Ferrara, E., Davis, C. A., Menczer, F., and Flam-
mini, A. (2017). Online human-bot interactions: De-
tection, estimation, and characterization. pages 280–
289. AAAI Conference on Web and Social Media
(ICWSM).
Wood, J., Dykes, J., Slingsby, A., and Clarke, K. (2007). In-
teractive visual exploration of a large spatio-temporal
dataset: Reflections on a geovisualization mashup.
IEEE transactions on visualization and computer
graphics, 13(6):1176–1183.
Minimum Collection Period for Viable Population Estimation from Social Media
147
