
Automatic Evaluation of Presenters’ Discussion Performance
based on Their Heart Rate
Shimeng Peng and Katashi Nagao
Department of Media Science, Graduate School of Information Science, Nagoya University, Nagoya, Japan
Keywords: Heart Rate Variability, Machine Learning, Discussion Performance Evaluation, Q&A Analysis.
Abstract: Heart rate (HR) variability (HRV) has recently seen a surge in interest regarding the evaluation of cognitive
performance as it always be used to measure the autonomic nervous system function. In this study, we argue
that a presenters’ HR data can be used to effectively evaluate their cognitive performance, specifically
presenters’ performance of discussion which consists of several Q&A segments (question and answer pairs)
compared with using traditional natural language processing (NLP) such as semantic analysis. To confirm
this, we used a non-invasive device, i.e., Apple Watch, to collect real-time updated HR data of presenters
during discussions in our lab-seminar environment, their HR data were analyzed based on Q&A segments,
and three machine-learning models were generated for evaluation: logistic regression, support vector machine,
and random forest. We also discuss the meaningful HR and HRV features (metrics). Comparative experiments
were conducted involving semantic data of Q&A statements alone and a combination of HR and semantic
data. The HR data of presenters resulted in effective evaluation of discussion performance compared with
using only semantic data. The combination of these two types of data could improve the discussion
performance evaluation ability to some extent.
1 INTRODUCTION
Discussion is often considered as an effective active
learning process in academia, and is usually
conducted in the form of presenters organizing and
explaining their current research through the
presentation session and participants involving peers
and instructors who raising questions to challenge and
point out problems in presenters’ research and the
presenters answering them to facilitate knowledge
discovery and exchange. We call question and answer
pairs Q&A segments. Considering the specific
process of discussion and its significant influence on
students’ active learning process, we are thinking
about finding a way to effectively evaluate their
discussion performance to improve their active
learning ability and help them carry out future
research activities. Taking full advantage of
discussion data, such as audio-and-video, facial
expression, semantic information, etc. can help us
evaluate presenters’ discussion performance. The
“discussion-mining (DM)” system (Nagao et al.,
2004) can provide us analyzable discussion data,
which we previously developed, it generates
multimedia meeting minutes of lab discussions
containing audio-visual and semantic information of
Q&A segments given by participants and answered
by the discussion presenters. Given the crucial
importance of questions asked by the participants, if
the presenter can give answers that are close to the
correct answers, in other words give high-quality
answers, it means that the presenter has a high
understanding skill of the questions and a strong
communication skill, which represents a high
discussion performance. Therefore, many higher-
quality answers given by presenters indicates better
discussion performance. We decided to evaluate
presenters’ answer-quality of Q&A segments and as
a method of evaluating their discussion performance.
Natural language processing (NLP) has often
been used as the main method to evaluate the answer
quality of Q&A segments, Patil and Lee (Patil and
Lee, 2016) analyzed certain linguistic features to
identify expert answers. Some previous studies
described using contextual features, such as n-gram,
to predict the answer quality of Yahoo! Answers
(Agichtein et al., 2008) or computed text-based
features such as if there are yes-like words in the
answers statements (Belinkov et al., 2015). However,
the personal characteristics of speakers or recorders
Peng, S. and Nagao, K.
Automatic Evaluation of Presenters’ Discussion Performance based on Their Heart Rate.
DOI: 10.5220/0006799500270034
In Proceedings of the 10th Inter national Conference on Computer Supported Education (CSEDU 2018), pages 27-34
ISBN: 978-989-758-291-2
Copyright
c
2019 by SCITEPRESS – Science and Technology Publications, Lda. All rights reserved
27
inevitably decrease the generalization performance of
the answer-quality evaluation of Q&A segments.
Considering that the discussion process is a type
of cognitive activity, which could result in changes in
certain physiological data, such as heart rate (HR)
variability (HRV), several studies have proven that
HR is an important index of the autonomic nervous
system regulation of the cardiovascular system
(Camm et al., 1996) (Anderson, 1995) (Acharya et al.,
2006). Therefore, there has been increasing focus on
observing the correlation between HR data and
cognitive activities. A study on measuring the HR
during three cognitive tasks (Luque-Casado et al.,
2013) has revealed the affection of cognitive
processing on HRV. The stress level also has been
assessed during Trier Social Stress Test tasks, a type
of cognitive activity, by using HR and HRV metrics
(Pereira et al., 2017). Judging from the large amount
of evidence presented, we argue that HR data of
presenters can be used to effectively evaluate the
answer-quality of Q&A segments, which is helpful in
improving presenters’ discussion performance
compared with a traditional semantic analysis
method.
In this paper, our starting point is categorizing the
answer-quality of Q&A segments of discussions into
low quality and high quality according to how
correctly a presenter answered participants’
questions. Our first goal was to collect presenters’
heart rates (HRs) during their discussions based on
our DM system in real time. The second goal was to
conduct an experimental investigation to prove that
the HR of presenters can be used to effectively
evaluate the answer-quality of Q&A segments.
We first introduce our lab-seminar DM system we
used to generate our experimental Q&A segment
data. We then explain our HR-data acquisition
system. Next we introduce the three types of binary
classification machine-learning methods we used as
evaluation models: logistic regression (LR), support
vector machine (SVM), and random forest (RF), as
well as the HRV features (metrics), and discuss the
evaluation results. Finally, we explain our
comparative experiments with the purpose of
comparing evaluation performance by using Q&A
statements’ semantic data alone and a combination of
these two types of data.
2 DISCUSSION-MINING SYSTEM
Seminar-style meetings that are regularly held at
university laboratories are places where exchanges of
opinions on research content occur. Many comments
on future work are included in their meeting records.
However, as discussions at meetings are generally not
recorded in detail, it is difficult to use these for
discovering useful knowledge. Our laboratory
developed and uses a DM system that records the
content of face-to-face meetings while providing
metadata (Nagao et al., 2004). Looking back on the
challenges presented in remarks is essential for
setting new goals in activities, but their existence may
be buried in many other remarks in the minutes.
In our laboratory at Nagoya University, we have
used this DM system to record detailed meetings in
the laboratory for over ten years. This system enables
all participants to cooperate to create and use
structured minutes. This system is not fully
automated, i.e., the secretary manually writes the
contents of the speech, and each speaker tags his/her
speech. Therefore, we can generate data with high
accuracy.
The meeting style supported by the DM system is
that the presenter explains a topic while displaying
slides, and Q&A with the meeting participants is
either conducted during or at the end of the
presentation.
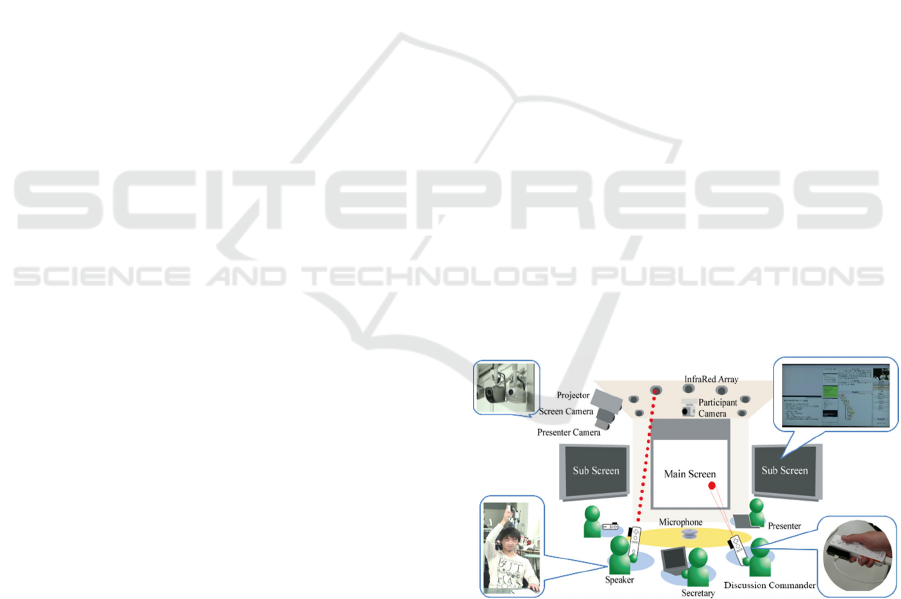
Specifically, using multiple cameras and
microphones installed in a discussion room, as shown
in Figure 1, and a presenter/secretary tool we created,
we record the discussion content. In the center of the
discussion room, there is also a main screen that
displays the presentation materials and demonstration
videos, and on both sides, there are sub-screens for
displaying information on and images of the
participants who are currently speaking.
Figure 1: Overview of discussion-mining (DM) system.
The DM system records slide presentations and
Q&A sessions including participants while
segmenting them in time. As a result, content
(discussion content), as shown in Figure 2, is
recorded and generated.
CSEDU 2018 - 10th International Conference on Computer Supported Education
28
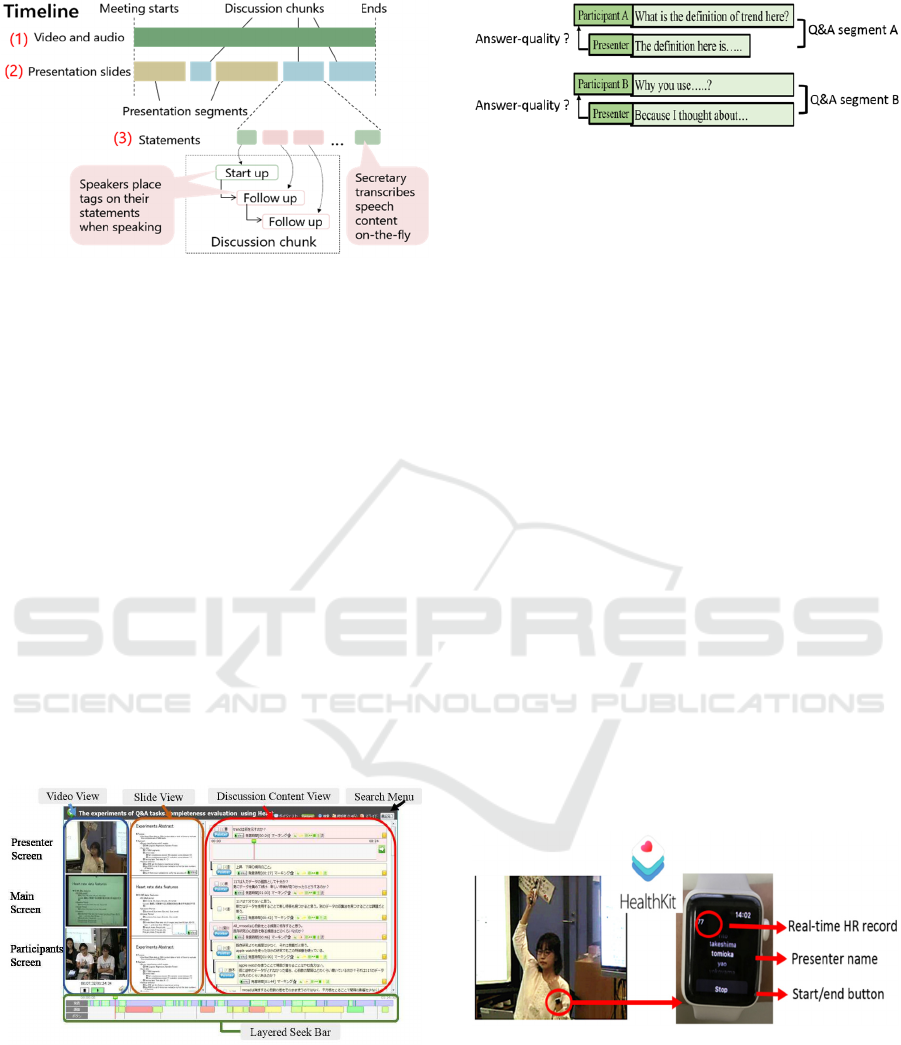
Figure 2: Overview of discussion content.
Every participant inputs metadata about his/her
speech using a dedicated device that is called a
discussion commander, as shown in the lower right of
Figure 1. Participants who specifically ask questions
or make comments on new topics assign start-up tags
to their statements. Also, if they want to speak in more
detail on topics related to the immediately preceding
statement, they provide a follow-up tag. Furthermore,
the system records pointer designates the
location/time for the slide and information on the
button for or against the statement during the
presentation and during the Q&A session. Marking
information on important statements is also recorded.
We also developed a system for searching and
viewing recorded data. In this discussion-content-
browsing system, a user can search the contents of the
agenda from the date and participant information,
view past discussions similar to the ongoing debate,
and effectively visualize the state of the discussion, as
shown in Figure 3.
Figure 3: Discussion browser of DM system.
The discussion view presents the semantic
structures of discussion content, which records all the
questions given by the participants and corresponding
answers given by the presenter, which we call Q&A
segments, as shown in Figure 4.
Figure 4: Q&A segments in discussion.
3 PRESENTERS’ HEART-RATE
DATA ACQUISITION
Smart watches, such as Apple Watch, Fitbit series,
and Microsoft Bands, contain wearable sensors to
accurately detect users’ biological data, such as HR
and blood pressure. Such non-invasive detection
makes it possible to link users’ biological information
with their daily activities. Iakovakis and
Hadjileontiadis (Iakovakis and Hadjileontiadis, 2016)
used Microsoft Band 2 to acquire HR data of users to
predict their body postures. In our study, we used
Apple Watch to collect presenters’ HR data based on
our DM system and visualize their HR data during
discussions.
3.1 Heart-Rate Data Acquisition
Through the Health Kit framework on Apple Watch,
which we asked presenters to wear on their left hand
during discussions, as showed in Figure 5, presenters’
HR data were acquired almost in real time in 5-7 sec
intervals. The collected HR and presenters’
information is displayed on the Apple Watch screen
as well as synchronously presented on the HR
browser.
Figure 5: Presenters’ heart-rate (HR) acquisition.
3.2 Heart-Rate Browser
As Figure 6 shows, the HR information displayed on
the browser consists of three parts: a search menu to
survey the historical HR information, an HRV graph,
and HR records that enable users to understand the
HRV information in detail.
Automatic Evaluation of Presenters’ Discussion Performance based on Their Heart Rate
29
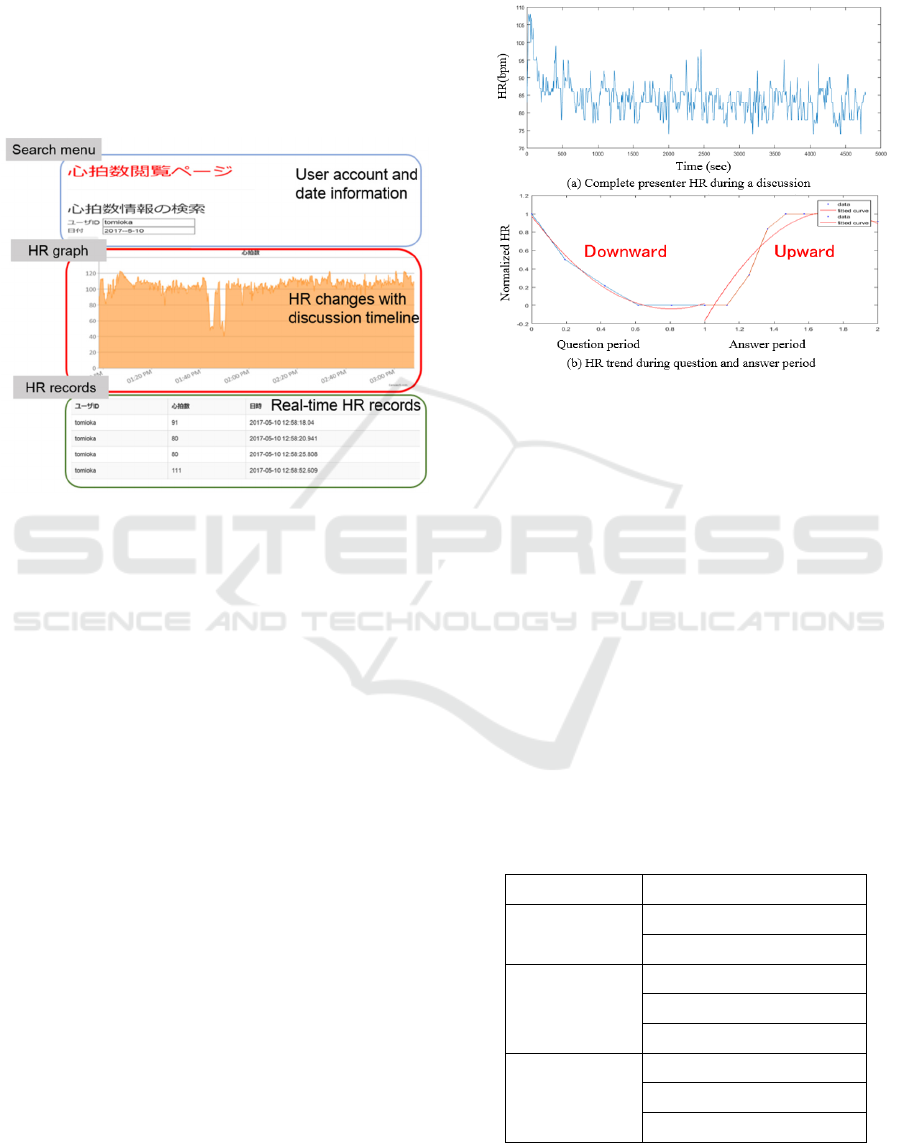
Search Menu: The historical HR data and user
information can be searched through this search menu
at the top of the browser.
HR Graph: The graph provides an intuitive way
to observe presenters’ HR data changes throughout
the discussion.
HR Records: The HR data at each point of the
discussion with which the presenter’s information can
be checked.
Figure 6: HR browser.
4 EVALUATION EXPERIMENTS
BASED ON PRESENTERS’
HEART RATE
To automatically evaluate discussion performance,
we started from analyzing the answer-quality of Q&A
segments, which are the most important constituent
components generated around the discussion topic.
Our goal was to validate our argument that HR of
discussion presenters can be used to effectively
evaluate the answer-quality of Q&A segments during
discussions. We will describe our heart rate data
analysis process in subsection 4.1 and then introduce
our evaluation experiments in subsection 4.2.
4.1 Heart-Rate Data Analysis
All HR information of presenters during their
discussions is displayed in a graph, as shown in
Figure 7 (a), which presents the presenter’s complete
HR detected per minute throughout the discussion.
The HR segments in each Q&A segment was then
extracted and displayed in a graph, as shown in Figure
7 (b), which shows the HR data during the answer
period (blue line) and answer period (orange line).
We then computed 18 HR and HRV features from all
Q&A segments as well as the question and answer
periods separately.
Figure 7: HR graphs.
The HR and HRV features include mean, standard
deviation (std.), and root mean square successive
difference (RMSSD) from these three periods, which
has been proven as an important metric for
understanding HRV differences under cognitive
activities (Wang et al., 2009) and (De Rivecourt et al.,
2008). The trends in the HR of these three periods
were also computed by calculating the difference
between two adjacent HR points. If the number of
positive differences was more than the negative one,
we assumed this HR period shows an upward trend,
if not, this HR period shows a downward trend, as
shown in the Figure 7 (b). We used a quadratic curve
(red line) to more clearly present the HR trend for
readers. We can see that HR during the question
period shows a downward trend and an upward trend
during answer period.
Table 1: HR and HRV features.
HR period HR and HRV features
Both periods mean, std., RMSSD, trend,
Freq. all mean, Freq. all std.
Question period mean, std., RMSSD, trend,
Freq. question mean,
Freq. question std.
Answer period mean, std., RMSSD, trend,
Freq. answer mean,
Freq. answer std.
CSEDU 2018 - 10th International Conference on Computer Supported Education
30
We also divided the HR data of these three
periods into the following nine ranges: less than 60
bpm, 60–70 bpm, 71-80 bpm, 81-90 bpm, 91-100
bpm, 101-110 bpm, 111-120 bpm, 121-130 bpm and
more than 130 bpm. The mean and std. were
calculated to describe the HR appearance-frequency
distribution in each range. Table 1 summarizes these
18 features
4.2 Evaluation Experiments based on
Presenters’ Heart Rate
4.2.1 Experimental Data
We collected discussion data from 9 presenters from
9 lab-seminar discussions in 4 months, and 12
undergraduate and graduate students and 3 professors
made up the participants, the discussions were carried
out following the presenters’ research contents report
with the participants asking questions related to the
discussion topic then answered by the presenters.
There were 117 complete Q&A segments extracted
from these 9 discussions, and the answer-quality of
these Q&A segments were evaluated by the
corresponding participants who asked the questions
by gave a score based on a five-point scale; 1 = very
poor, 2= poor, 3= acceptable, 4= good, 5 = very good.
We obtained 66 high-quality answers with scores
from 4–5, and 51 low-quality answers with scores
from 1–3.
4.2.2 Evaluation Models
We adopted three evaluation models: LR, SVM, and
RF, to carry out binary classification of the Q&A
segments’ answer quality. About 80% of Q&A
segments were randomly selected as the training data
set and the remaining 20% as the test data set.
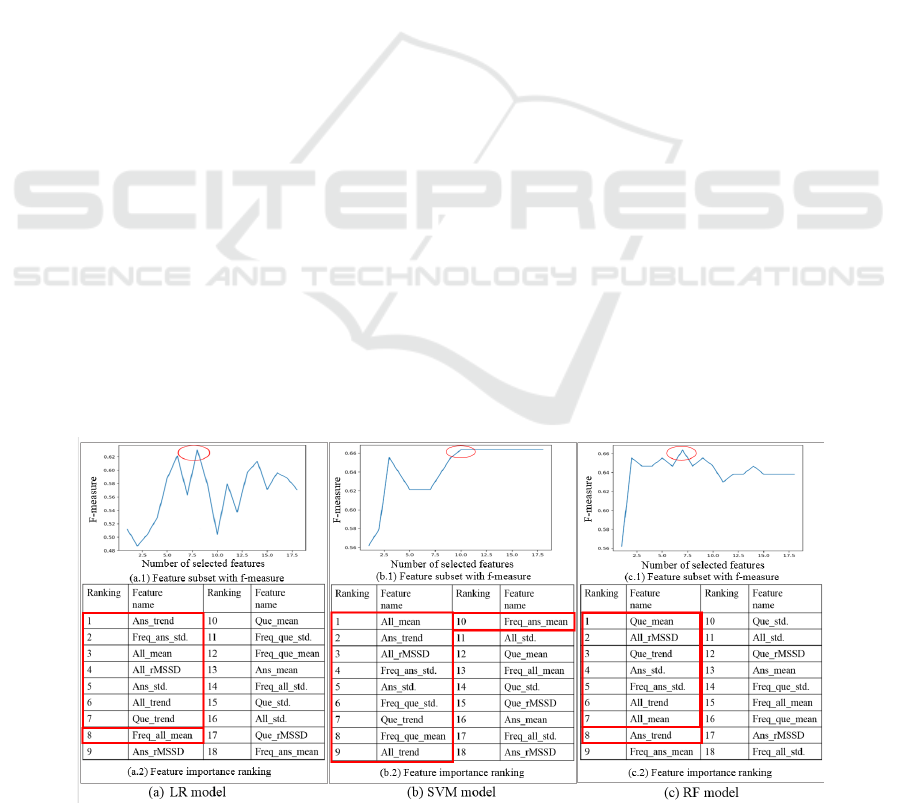
4.2.3 HR and HRV Feature Selection
Considering that using all the features we computed,
as discussed in Section 4.1, may decrease the
performance of the evaluation models, we used
recursive features elimination (RFE) (Guyon et al.,
2002), which ranks the features according their
importance to the different evaluation models. To
determine the best size of the feature subset, we used
the RFE with 5-fold cross-validation (RFECV)
method. By calculating the F-measure (or F1 score
that is the harmonic mean of precision and recall), we
extracted the best performing feature subset that
could achieve the best evaluation performance for the
corresponding models.
Figure 8 shows three sub-graphs that separately
illustrate the best subset of all the HR and HRV
features for each model at the top and the feature-
importance-ranking results at the bottom. The highest
F-measure was obtained when seven or eight key
features were included in the subsets for the LR
model; therefore, the first seven or eight features
surrounded by the red rectangle were considered as
two candidate feature subsets for the LR model.
Similarly, the first ten features comprised the
candidate subset for the SVM model, and there were
two candidate feature subsets for the RF model which
involved seven or eight features in the ranking list
counted from the top.
4.2.4 Results
For the LR model, we obtained a 0.79 F-measure by
using the eight-feature candidate subset and an
Figure 8: HR and HRV feature selection for each evaluation model.
Automatic Evaluation of Presenters’ Discussion Performance based on Their Heart Rate
31
F-measure of 0.74 when using the seven-feature
candidate subset; therefore, we used the eight-feature
subset to train our LR model. We obtained an
measure of 0.8053 for the SVM model with the ten
HR and HRV features we selected in advance. For
the RF model, when there were 36 trees and 19
terminal nodes on each tree we obtained the highest
F-measure of 0.87. In this case, we chose an eight-
feature subset. Table 2 lists the evaluation results for
each model.
Comparing the F-measures of each model, the RF
model exhibited superior evaluation performance
compared with the LR and SVM models. By
considering all three models, the HRV data of presen-
ters showed an outstanding evaluation performance
of Q&A segments’ answer quality. Meanwhile, we
focused on the following seven HRV features: All
mean, Answer trend, All RMSSD, Freq answer std.,
Answer std., Question trend, and All trend, which
exhibited the largest effect on all three models.
Table 2: Evaluation results of each model.
Evaluation model F-measure
LR 0.79
SVM 0.8053
RF 0.87
5 COMPARATIVE
EXPERIMENTS
As discussed in the previous section, we
experimentally found that the discussion presenters’
HRV features can be used to effectively evaluate
Q&A segments’ answer quality and as a discussion-
performance evaluation method. In this section, we
discuss determining whether the HRV features of
discussion presenters exhibit better discrimination
performance regarding the evaluation of Q&A
segments’ answer quality than traditional semantic
features extracted from presenter statements. We
conducted two comparative experiments by
generating LR, SVM, RF models based on the
semantic features of Q&A statements alone and a
combination of these two types of data.
5.1 Comparative Experiments based on
Semantic Analysis
5.1.1 Semantic Features
To find meaningful semantic characteristics as
semantic features for evaluating the answer-quality of
Q&A segments, we conducted a statistical analysis on
1246 Q&A segments from discussions we recorded
before in our lab environment and also manually
evaluated their quality by gave a score based on a
five-point scale in advance. From these survey
samples, we obtained 993 high-quality Q&A
segments and 253 low-quality segments.
A morpheme bigram was constructed based on
these survey Q&A segments by using MeCab, which
is a fast and customizable morphological analyzer for
Japanese (downloadable from the Web at
https://sourceforge.net/projects/mecab/), calculated the
occurrence frequency of all bigrams, and extracted
several bigrams if their occurrences were much
higher than 0.15%. We selected 14 morpheme
bigrams as the semantic features for evaluating Q&A
segments’ answer quality.
5.1.2 Results
As shown in the second column of Table 3, The RF
model exhibited the strongest discrimination ability
than the other models, even though we only used the
semantic features that received an F-measure of
0.583.
Table 3 also compares the evaluation
performance of HRV and semantic features. We can
clearly see that presenters’ HR and HRV features
brought out excellent discrimination ability regarding
Q&A segments’ answer quality compared with
semantic features in all evaluation models. These
results provide favourable evidence regarding our
original argument that using presenters’ HR and HRV
features can effectively evaluate the answer-quality
of Q&A segments in discussions.
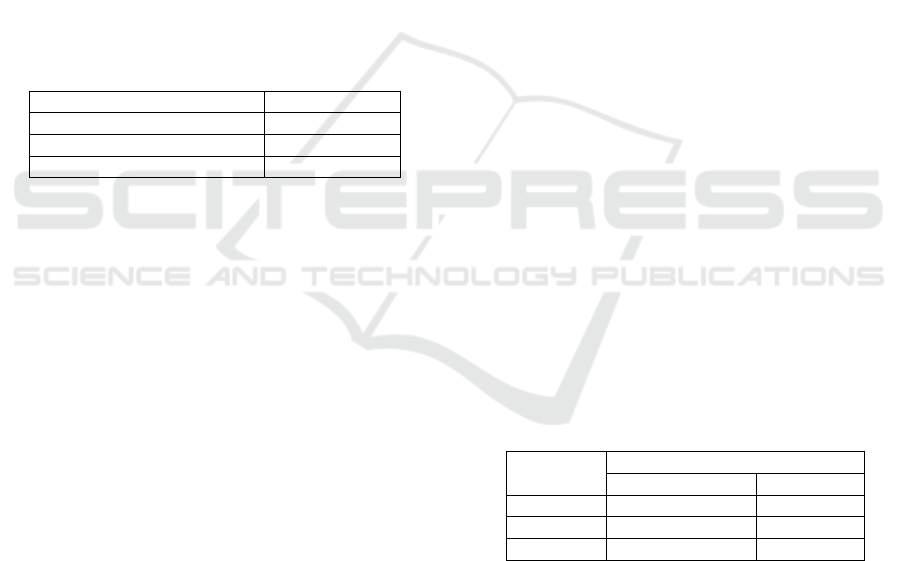
Table 3: Comparison of evaluation performance of HR and
semantic features for each evaluation.
Evaluation
model
F-measure
Semantic features HR features
LR 0.5 0.79
SVM 0.54 0.8053
RF 0.583 0.87
5.2 Comparative Experiments based on
Combination of HR and Sematic
Data
In the previous section, we proved that HR data of
presenters can be more effective regarding Q&A
segments’ answer-quality evaluation than traditional
semantic features from presenter statements. We also
discovered seven meaningful HR and HRV features
having a larger effect on each evaluation model.
CSEDU 2018 - 10th International Conference on Computer Supported Education
32
To maximize the evaluation performance
regarding Q&A segments’ answer quality, we
combined HR data and semantic data. We decided to
combine the seven most meaningful HR and HRV
features with the semantic features extracted
previously. Three new LR, SVM, and RF models
were constructed based on the same training dataset,
and the same test dataset was also used to evaluate the
evaluation performance, Table 4 shows the
performance comparison of all three models.
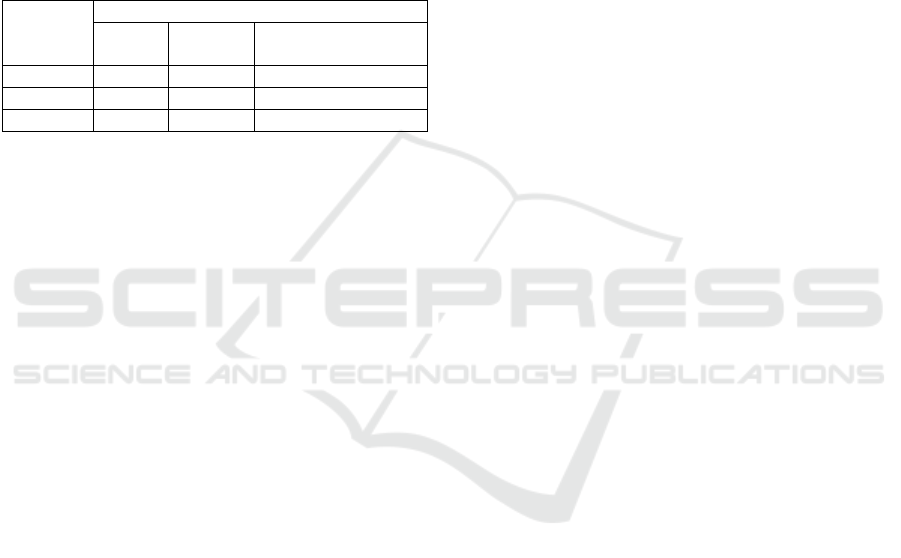
Table 4: Evaluation-performance comparison of HR and
semantic features and their combination for each evaluation
model.
Evaluation
model
F-measure
HR
features
Semantic
features
Combination of HR
and semantic features
LR 0.79 0.5 0.79
SVM 0.8053 0.54 0.833
RF 0.87 0.583 0.916
As the results indicate in Table 4, combining the
HR data of presenters and semantic data of Q&A
statements clearly increased evaluation ability than
using each type of data alone. The SVM and RF
models obtained a 3 and 4% increase in F-measure,
respectively, but there was no obvious increase for the
LR model.
6 CONCLUSION AND FUTURE
WORK
6.1 Conclusion
In this study, we argued to take advantage of
presenters’ HR data to effectively evaluate the
answer-quality of Q&A segments in their
discussions. We developed a heart-rate acquisition
system based on our DM system with the help of
presenters wearing a non-invasive device, i.e., Apple
Watch. The collected HR data were presented on a
HR browser.
To verify our argument, we generated three
binary classification models for evaluation: LR,
SVM, and RF, and selected the seven most
meaningful features out of all 18 HR and HRV
features: All mean, Answer trend, All RMSSD, Freq
answer std., Answer std., Question trend, and All
trend, which had the largest effect on all three models.
We obtained an F-measure of 0.79 for the LR model,
0.8053 for the SVM model, and 0.87 for the RF
model. These results indicate that HR data of
presenters can be used to evaluate the answer-quality
of Q&A segments of discussions. To further verify
our argument, we conducted a comparative
experiment in which we extracted semantic features
from Q&A statements from past survey data and used
the same method to construct and evaluate three
different evaluation models. The comparative results
revealed that HR data of presenters can exhibit more
effective evaluation on the answer-quality of Q&A
segments than semantic data, providing convincing
evidence to support our argument.
After recognizing the excellent performance of
HR data on evaluating Q&A segments’ answer
quality, we focused on whether the combination of
two types of data can achieve more effective
evaluation performance. We used the seven most
meaningful HR and HRV features of presenters and
semantic features together to evaluate answer-quality.
There was an obvious increase in evaluation
performance for the SVM and RF models; F-measure
reached 0.9 of the RF model.
As we discussed in the introduction section,
discussion activity forms an active learning process in
which presenters explain their current research
through the presentation session and receive
questions from participants about their research
content during the question-and-answer session.
These questions are useful for helping presenters
troubleshoot problems that have not been resolved or
are ignored at the present stage. Many higher-quality
answers given by presenters indicates a better
understanding of participants’ questions and higher-
degree mastering of their research content, as well as
stronger communication skills, which are all criteria
for a high level of discussion performance.
In this study, we have shown that presenters’ HR
data can effectively evaluate the answer-quality of
Q&A segments and as a method of automatic
evaluation of presenters’ discussion performance
compared with using traditional NLP such as
semantic analysis. And our finding that the accuracy
of evaluation can be improved by combining
traditional semantic data with presenters’
physiological data HR offers experimental evidence
for using multi-modal data to effectively evaluate
students’ cognitive performance.
6.2 Future Work
We will focus on the application of our argument
suggested in this paper to facilitate students’
discussion performance. We plan to develop a follow-
up function in which feedback regarding low-quality
Q&A segments is given to presenters after
discussions to encourage them to spend more time on
Automatic Evaluation of Presenters’ Discussion Performance based on Their Heart Rate
33

re-understanding the questions, to sort out their
research to find more accurate answers, and to
strengthen the communication skills to give
participants a more understandable description, in the
long run, to effectively improve students’ discussion
performance.
As another future plan. After we recognizing the
excellent performance of users’ physical data such as
HR in evaluating cognitive activities, we intend to use
this result as a theoretical basis, and take advantage
of multimodal data especially users’ physical data
like blood pressure, pulse data with the heart rate, as
well as the traditional discussion data such as audio-
and-video data recorded by our DM system. We plan
on using deep learning methods as we believe the
amount of data that we may add in the future will
increase and we desire improved accuracy.
REFERENCES
Acharya, U. R., Joseph, K. P., Kannathal, N., Lim, C. M.,
and Suri, J. S., 2006. Heart rate variability: a review.
Medical and Biological Engineering and Computing,
44(12):1031–1051.
Agichtein, E., Castillo, C., Donato, D., Gionis, A., and
Mishne, G., 2008. Finding high-quality content in
social media. In Proceedings of the 2008 International
Conference on Web Search and Data Mining, pages
183–194. ACM.
Anderson, K. P., 1995. Vagal control of the heart:
Experimental basis and clinical implications. Critical
Care Medicine, 23(10):1795-1796.
Belinkov, Y., Mohtarami, M., Cyphers, S., and Glass, J.,
2015. Vectorslu: A continuous word vector approach to
answer selection in community question answering
systems. In Proceedings of the 9th International
Workshop on Semantic Evaluation (SemEval 2015),
pages 282–287.
Camm, A. J., Malik, M., Bigger, J., Breithardt, G., Cerutti,
S., Cohen, R., Coumel, P., Fallen, E., Kennedy, H.,
Kleiger, R., 1996. Heart rate variability: standards of
measurement, physiological interpretation and clinical
use. European Heart Journal, 17(3):354–381.
De Rivecourt, M., Kuperus, M., Post, W., and Mulder, L.,
2008. Cardiovascular and eye activity measures as
indices for momentary changes in mental effort during
simulated flight. Ergonomics, 51(9):1295–1319.
Guyon, I., Weston, J., Barnhill, S., and Vapnik, V., 2002.
Gene selection for cancer classification using support
vector machines. Machine Learning, 46(1):389–422.
Iakovakis, D. and Hadjileontiadis, L., 2016. Standing
hypotension prediction based on smartwatch heart rate
variability data: a novel approach. In Proceedings of the
18th International Conference on Human-Computer
Interaction with Mobile Devices and Services, pages
1109–1112. ACM.
Luque-Casado, A., Zabala, M., Morales, E., Mateo-March,
M., and Sanabria, D., 2013. Cognitive performance and
heart rate variability: the influence of fitness level.
PLoS ONE, https://doi.org/10.1371/journal.pone.
0056935.
Nagao, K., Inoue, K., Morita, N., and Matsubara, S., 2015.
Automatic extraction of task statements from structured
meeting content. In Proceedings of the 7th
International Joint Conference on Knowledge
Discovery, Knowledge Engineering and Knowledge
Management (IC3K), volume 1, pages 307–315. IEEE.
Nagao, K., Kaji, K., Yamamoto, D., and Tomobe, H., 2004.
Discussion mining: Annotation-based knowledge
discovery from real world activities. In Proceedings of
the Pacific-Rim Conference on Multimedia, pages 522–
531. Springer.
Patil, S. and Lee, K., 2016. Detecting experts on quora: by
their activity, quality of answers, linguistic
characteristics and temporal behaviors. Social Network
Analysis and Mining, 6(5):1-11.
Pereira, T., Almeida, P. R., Cunha, J. P., and Aguiar, A.,
2017. Heart rate variability metrics for fine-grained
stress level assessment. Computer Methods and Pro-
grams in Biomedicine, 148:71–80.
Tsuchida, T., Kiuchi, K., Ohira, S., and Nagao, K., 2009.
Visualization of discussions in face-to-face meetings.
In Proceedings of the 5th International Conference on
Collaboration Technologies.
Wang, X., Ding, X., Su, S., Li, Z., Riese, H., Thayer, J. F.,
Treiber, F., and Snieder, H., 2009. Genetic influences
on heart rate variability at rest and during stress.
Psychophysiology, 46(3):458–465.
CSEDU 2018 - 10th International Conference on Computer Supported Education
34
