
An Alternative Raster Display Model
Titusz Bugya and G
´
abor Farkas
Department of Cartography and Geoinformatics, University of P
´
ecs, H-7624 P
´
ecs, Hungary
Keywords:
Data Visualization, Raster Data Model.
Abstract:
In this paper we present an alternative, vector based coverage model, which could extend the traditional raster
model. As the coverage model only changes the representation model behind rasters, it needs minimal effort to
implement, mitigates current raster limitations, and has minimal performance impact due to modern comput-
ers’ increased computing capacities. Moreover, coverages could still get the benefits of the traditional raster
model. As the data model remains the same, traditional raster based operations can still be applied on rect-
angular coverages, while other patterns can still benefit at least from matrix algebra. Finally, not only current
raster operations could be kept, but there would not be any limitations of developing new ones optimized for
different coverage patterns (e.g. hexagonal operations).
1 INTRODUCTION
It is basic knowledge, Geographic Information Sys-
tems (GIS) work with two distinct data types: rasters
and vectors. There are essential differences between
the two models, converting them into each other re-
sults in data loss most of the time. These models are
still used in parallel since not only their characteris-
tics, but their typical use cases also differ. A fun-
damental attribute of the 2D raster model (hereafter
raster model) is it can be created and used without
interpreting the represented phenomenon. That is,
a raster – for example a land cover image – can be
created without excessive knowledge of the surveyed
area. On the other hand, the vector model requires in-
terpretation. Vectors can only be created, if one can
choose and delimit the mapped entities, while the ef-
fective use of attributes also requires being familiar
with the mapped phenomenon.
Additionally, the two models differ in the types
of mapped phenomena. Usually, rasters are used for
continuous data (e.g. temperature), while vectors are
used for discrete entities (e.g. administrative divi-
sions, infrastructure). This duality in GIS caused by
the distinct characteristics of– and use cases for the
two specific data models create a seemingly irresolv-
able disagreement when both of them are needed. In
this study we argue, this duality is not really neces-
sary, and the conversions between the two models can
be neglected. Furthermore, by loosening the restric-
tions of the traditional raster model, new, interest-
ing raster-vector cross products could be developed,
which might be more appropriate for a given task than
choosing a traditional model.
2 THE RESTRICTIVE RASTER
MODEL
Since our current raster model is a heritage of an
old computing era (Lim, 2008), it is still burdened
with technological limitations of those times. No
matter how those limitations are eased or vanished
(Chrisman, 1987), our raster model still consists of
a strongly coupled data–, and representation model.
That is, rasters are matrices seamlessly filling a rect-
angular extent in a projected raster space (Ritter and
Ruth, 1997). As common GIS software suggest,
they must be represented with rectangular, coincident
cells.
2.1 Strengths and Weaknesses
Despite of the limitations, the benefits of the raster
model make it a useful, and widely used data model
even in modern GIS analyses. However, by group-
ing some of its major characteristics (Huisman and
De By, 2009; Bolstad, 2016; Farkas, 2017) by the
level of conceptuality (i.e. data and representation),
one can see, most of its strongest, most enduring mer-
its are coming from the data model (Table 1).
Most of the strengths are coming from the model’s
simplicity. Since the majority of a traditional raster
262
Bugya, T. and Farkas, G.
An Alternative Raster Display Model.
DOI: 10.5220/0006762402620268
In Proceedings of the 4th International Conference on Geographical Information Systems Theory, Applications and Management (GISTAM 2018), pages 262-268
ISBN: 978-989-758-294-3
Copyright
c
2019 by SCITEPRESS – Science and Technology Publications, Lda. All rights reserved
Table 1: Characteristics of the raster data model without
being exhaustive.
Data model
Continuous coverage
Small size, good
compressibility
Advantages
Simple data structure
Good for parallel computing
Easy to overlay when aligned
Disadvantages Quadratic growth in raster size
Representation model
Easy to create textures
Fast rendering (textures,
pyramids)
Advantages
Easy to resample and
interpolate
Georeferencing is unequivocal
Hard to reproject
Rotation needs resampling
Disadvantages
Precision depends on latitude
Sampling bias
file consists of cell values, rasters have good com-
pressibility, as matrices can be easily encoded in a
binary format. Furthermore, as subsetting a matrix
is trivial, tiling up a raster layer for saving bandwidth,
making operations faster, or parallelizing an analysis
is easy.
On the other hand, advantages bound to the repre-
sentation model are not huge, while the disadvantages
are severe. Most of the restrictions of the raster model
are coming from its disadvantages, and can be origi-
nated to the shapes of individual cells. As they are
restricted to be rectangular and coincident, reprojec-
tion needs resampling and interpolation in most of the
time. Furthermore, if cells are used for representing
their centroids (i.e. sampling), a bias is unavoidably
introduced, as diagonals are longer than sides.
2.2 Evolution of the Raster Model
In order to overcome a few disadvantages of the raster
model, it has undergone some changes. First, when
the raster model was introduced to aid plotting and vi-
sualization on digital displays (Lim, 2008), cells had
a good reason to be squares. This initial property is
still carried by some of the old, but popular formats,
like the ArcInfo ASCII Grid (Yu and Custer, 2006).
Next, the classical raster model took the opportu-
nity to extend rasters in the only possible way: per-
mitting different resolutions on different axes. The
GeoTIFF data exchange format is a prime example
for this. It creates a raster grid with rectangular cells
from a regular TIFF image with a tie point and an
affine transformation matrix (Ritter and Ruth, 1997).
Since there were demands for various new raster
capabilities, and the current, restrictive raster model
could not incorporate them, theoretical and practi-
cal raster concepts parted. Now the theoretical con-
cept capable of filling an extent with different shapes,
called regular–, and irregular tessellation (Huisman
and De By, 2009), is taught as GIS theory. Rasters,
on the other hand, are the widely implemented subset
of regular tessellations using rectangular grids.
Some of the more popular demands, like the
hexagonal grid (Birch et al., 2007) are slowly mak-
ing their way into various GIS software in form of
tools (Ramakrishna et al., 2013; Esri, 2017), how-
ever they are generated and stored as polygon layers.
The problem with this approach is almost every ad-
vantage of the raster data model is lost. For example,
after the grid is generated, the continuity is not en-
forced anymore, making space for a variety of user
errors. Another potential concept for geomorpholo-
gists, the Multiresolution Image Format (Bugya and
Halmai, 2013) does not have a straightforward way
of getting implemented, as it relies on the raster data
model.
3 DISPLAYING RASTERS AS
VECTORS
Since most limitations of the raster model are com-
ing from the representation model, we propose an al-
ternative display model for rasters, and other regular
tessellations: the coverage model. Rendering raster
grids as vectors would need minimal modifications to
popular data exchange formats, and minor modifica-
tions in GIS software. On the other hand, it would
mitigate current raster limitations, making space for
improvement.
3.1 A Permissive Coverage Model
The main aspect in defining our coverage model was
making it as permissive as possible. That is, its sole
requirement is continuous coverage in a spatial extent.
Specifically, elements of the coverage must not have
gaps between them, nor overlap each other. We real-
ize that such a strong criterion should be enforced by
the model itself. Consequently, having an unequivo-
cal, direct mapping between the coverage pattern and
the data matrix is unavoidable. If no such mapping
could be established in a practical way, the coverage
should be treated as an irregular tessellation (e.g. TIN
An Alternative Raster Display Model
263
(a) (b)
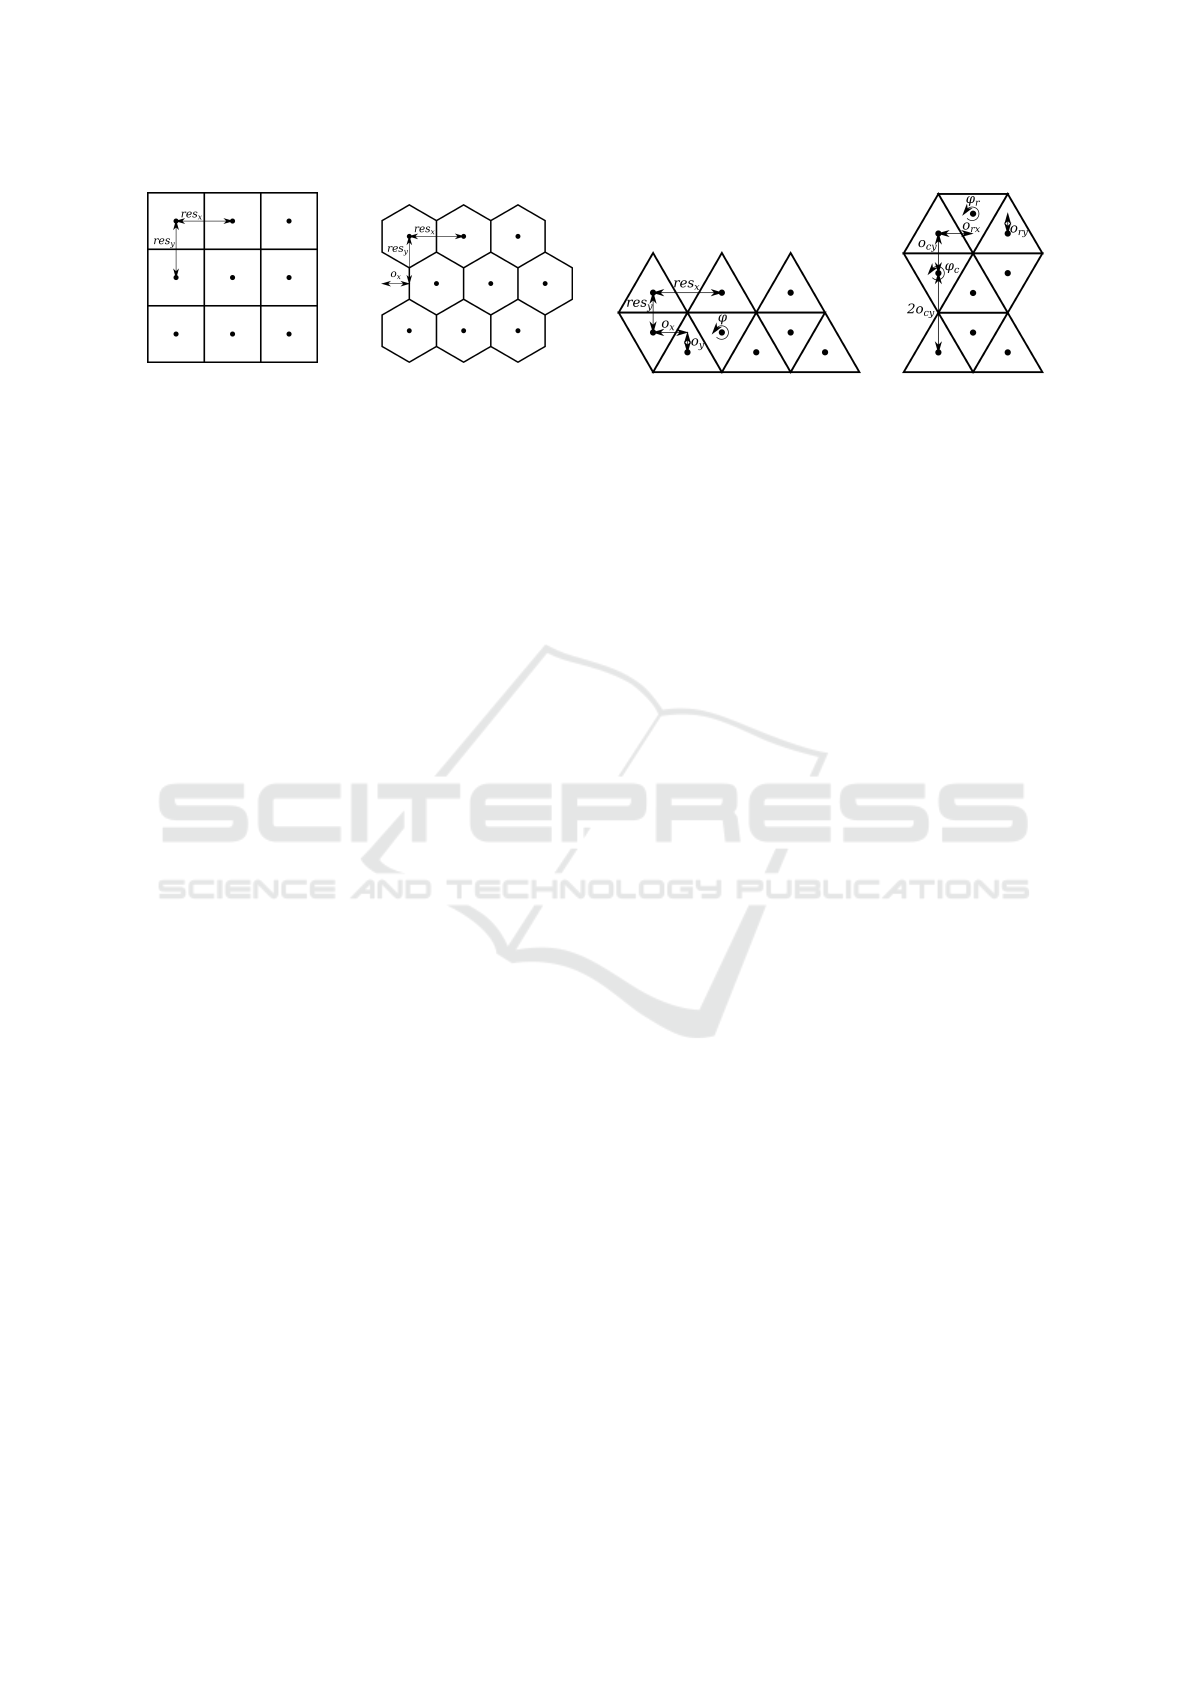
Figure 1: Required attributes for describing rectangular (a)
and hexagonal (b) coverages. Vertical and horizontal reso-
lution (res
x
, res
y
), and horizontal offset (o
x
), which can be
negative.
model). Using such a model could enable an imple-
mentation to apply more heuristics as the regularity
of the pattern increases. This way, traditional rasters
would be treated in a more flexible way; as an edge
case of the vector model.
The amount of information needed to describe a
regular pattern is minimal, while for more complex
patterns it can gradually increase. In case of rectangu-
lar coverages, users could not experience any differ-
ences. They would look very similar to texture-based
representations, while – as the data model behind the
coverage model is the same – traditional raster and
image tools can be used on them. Furthermore, ex-
isting and new compression algorithms for raster data
can also be used on every coverage. By considering
the rectangular pattern as the trivial one-to-one map-
ping to the underlying matrix, hexagonal tessellations
can be described with only a few attributes (Figure
1), assuming the orientation of individual cells are
horizontal (i.e. points-up or honeycomb). Develop-
ers could implement another set of tools optimized
for hexagonal coverages (and rectangular coverages
with an offset), as computations on hexagonal grids
are well-founded (Her, 1995), while there are also po-
tential use cases of them in GIS (Birch et al., 2007).
The third regular tessellation in euclidean space –
a triangular pattern – has no trivial mapping to a ma-
trix. Such a mapping can be defined in various ways,
but grouped into two distinct categories; row-to-row
mapping, where each row consist of cells with the
same attributes, and element-to-cell mapping, where
neighboring cells are changing periodically (Figure
2). No matter which method is used, there will al-
ways be a periodicity included, which needs to be
considered. Such ambiguous coverages can make lit-
tle use of traditional raster tools, although the conti-
nuity is granted, and matrix algebra can be used on
a single coverage, or when the patterns of two cov-
erages match. Furthermore, as they would be treated
like vectors, vector tools could be used on such cov-
erages.
(a) (b)
Figure 2: Two different matrix mapping techniques in a 3x3
triangular tessellation. In row-to-row mapping (a), the hor-
izontal resolution (res
x
) is constant in a row, while the ver-
tical resolution (res
y
) and offsets (o
x
, o
y
) are periodically
changing in new rows. The rotation (ϕ) is always applied
on a new row. In element-to-cell mapping (b), there are off-
sets and a rotation for cells in a row (o
rx
, o
ry
, ϕ
r
), and for
cells in new rows (o
cy
, 2o
cy
, ϕ
c
). The vertical offset for new
rows is periodically changing.
In order to describe arbitrary patterns, there is one
final consideration left: the way pattern geometries
are stored. As there are numerous ways to tessellate
an extent with irregular shapes, we do not think the
coverage model should be restricted to euclidean
regular tessellations (i.e. rectangular, hexagonal, tri-
angular). If one can describe an arbitrary pattern with
an unequivocal mapping to the underlying matrix,
that pattern should be able to used as a coverage.
While there are numerous ways to describe such a
shape, we argue, it should be done in a normalized
coordinate system enclosing the axis-oriented bound-
ing box of the shape (Figure 3). This way shapes
could be automatically scaled with the resolution of
the coverage. Shape coordinates should be relative
to the anchor point, as it would decrease the number
of calculations required for visualizing the pattern,
as in the following pseudo-code of a straightforward
implementation (assuming hardware-acceleration is
used):
Input: Cell shape S, Pattern P, First
centroid C
0
, Resolution R.
Output: Coverage triangulation T .
1. Calculate S
R
by scaling S with R.
2. Calculate triangulation S
T
from S
R
.
3. do
4. Get current cell’s rotation ϕ from P.
5. Calculate cell S
i
by offsetting S
T
by C
i
.
6. Rotate S
i
by ϕ around C
i
.
7. Add S
i
to T .
8. Calculate next centroid C
i
using P.
9. until There are no cells remaining.
Storing the first anchor point or centroid is im-
portant, as it serves as the starting point of the pat-
tern, a reference to absolute shape coordinates, and
GISTAM 2018 - 4th International Conference on Geographical Information Systems Theory, Applications and Management
264
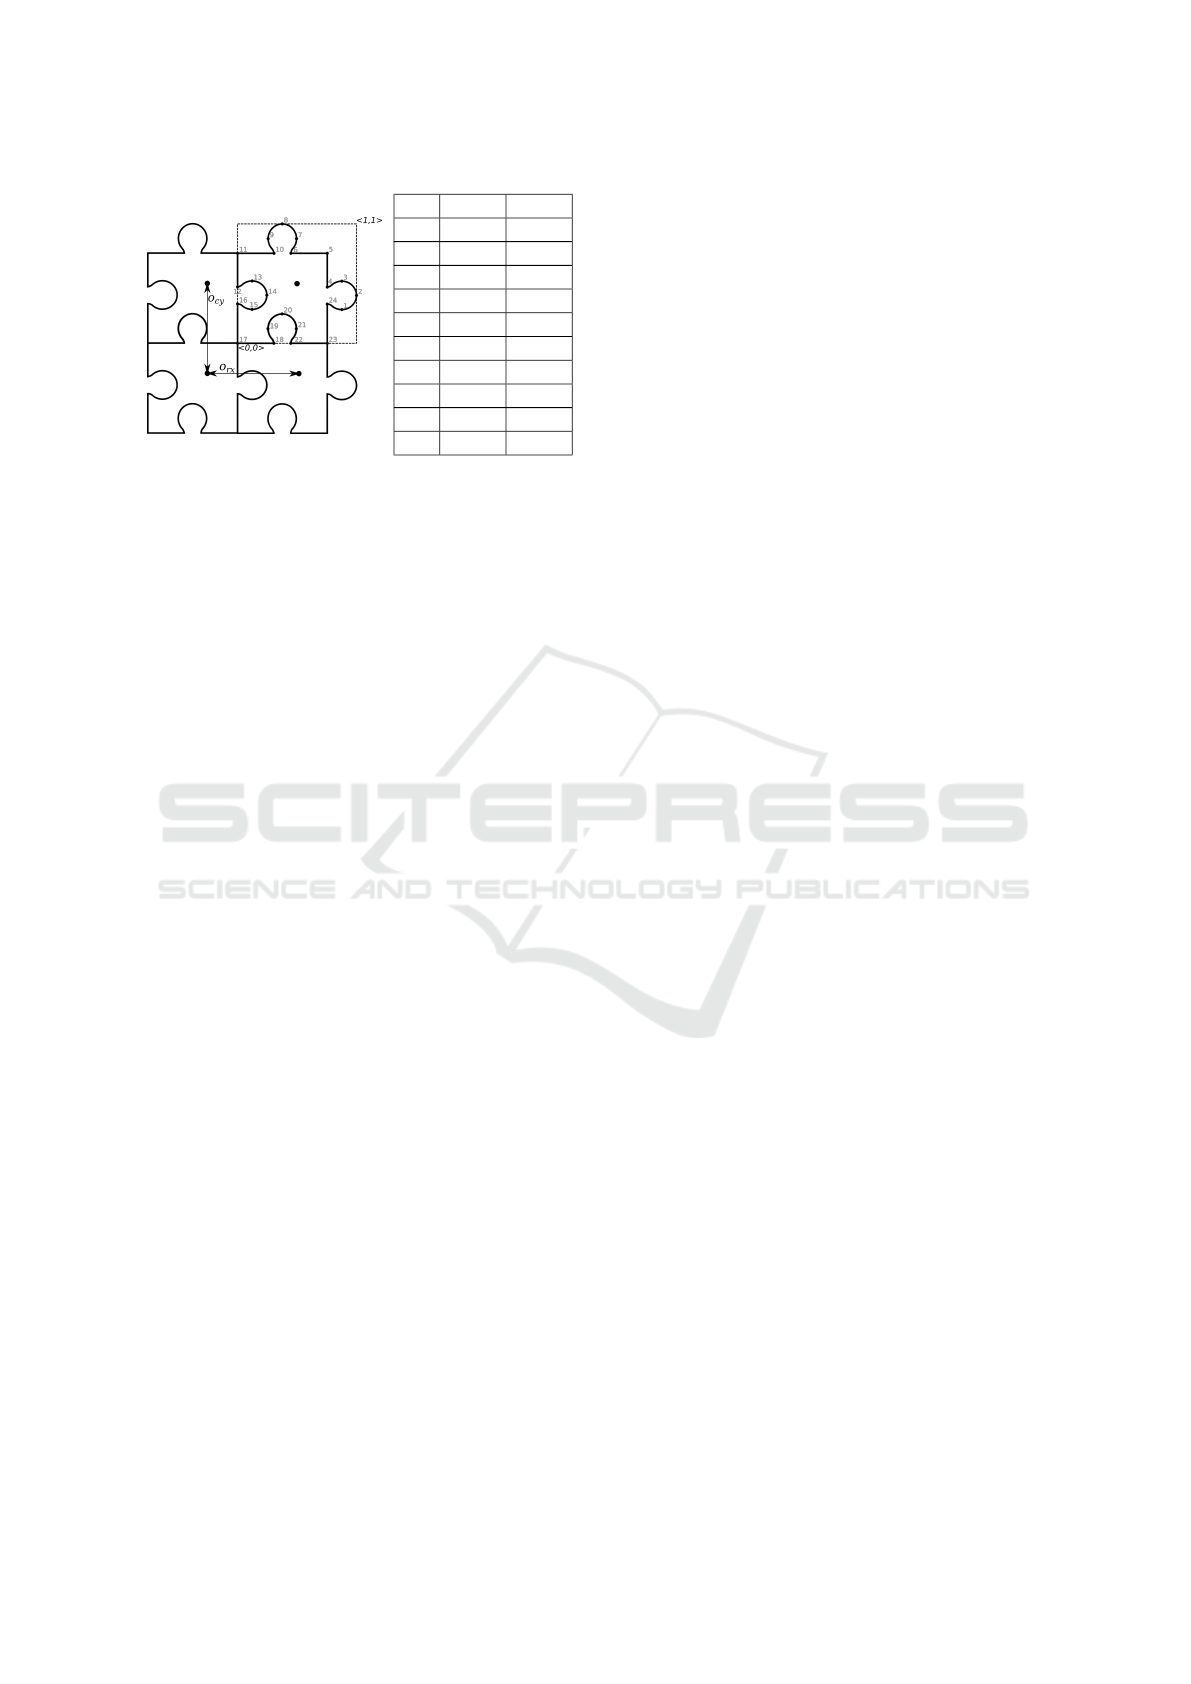
ID X Y
1 0.4 -0.2
2 0.5 -0.1
3 0.4 0
4 0.45 -0.03
5 0.25 0.25
6 -0.05 0.25
7 0 0.38
8 -0.13 0.5
9 -0.25 0.38
10 -0.2 0.25
Figure 3: An arbitrary pattern described with a minimal
number of attributes. Coordinates of the shape are stored in
a normalized coordinate system, therefore it can be linearly
scaled with the resolution of the coverage. As this pattern is
based on a rectangular coverage, only one offset is needed
for cells in the same row (o
rx
), and one for new rows (o
cy
),
which also agree with the resolution.
a basis to offset, and rotate the shape in the pattern.
On the other hand, storing the topology of neighbor-
ing shapes could be also considered, since that way
a GIS could validate a coverage more easily and ac-
curately (i.e. without false positives from arbitrary
floating point calculations, and without the overhead
of calculating the first period of the pattern). Simi-
larly to triangular tessellations, these arbitrary cover-
ages could neither be used for traditional raster analy-
ses, although they would still get the other benefits of
the raster data model.
The complexity of a pattern can be gradually in-
creased by defining multi-shape patterns (e.g. eu-
clidean projections of spherical tessellations), how-
ever assessing the feasibility of such coverages is out
of the scope of this study.
3.2 Required Modifications
For effective coverage storage and retrieval, a stan-
dardized set of parameters should be worked out. As
mentioned before, a regular pattern can be described
with periodically changing translations and rotations,
while an arbitrary pattern should contain the shape,
and optionally its topological relationship with its
neighbors. These are just additional metadata, which
need to be stored in a coverage file. Some of the cur-
rent formats can be extended to hold such informa-
tion, while for others, it can be safely assumed, their
contents are rectangular grids.
Moreover, formats supporting coverages should
store the lower left cell’s center (or anchor point).
While currently it is very popular to store the lower
left corner of a raster layer, for non-rectangular pat-
terns it can be ambiguous. Finally, despite of storing
the lower left corner of the first cell’s bounding box is
trivial, a calculation can be saved by not doing so.
A concise description of the triangular pattern in
Figure 2b in JavaScript Object Notation could be the
following:
{
origin: [46.07, 18.21],
shape: [[-0.5, -0.5], [0.5, -0.5], [0, 0.5],
[-0.5, -0.5]],
row_pattern: {
rotation: [180deg],
offset: [
[0.5, 1/3],
[0.5, -1/3]
]
},
col_pattern: {
rotation: [180deg],
offset: [
[0, 4/3],
[0, 2/3]
]
}
}
The second part of the implementation would be
a coverage interpreter. As every adequate GIS soft-
ware is capable of rendering vectors, it would take
minimal effort to extend the rendering engine to draw
patterns. Besides the pattern drawing algorithm de-
scribed before, only vector rendering methods need
to be used (e.g. drawing cells as polygons, or trian-
gulating and creating vertex buffers). The underlying
low-level rendering engine can take care of the rest.
Due to the vector nature of coverages, resampling
for display purposes would be rarely needed, although
current raster resampling algorithms could be used
for rectangular coverages. Pyramids, however, would
need to be stored as resampled coverages with dif-
ferent resolutions instead of textures. If pyramids are
really needed for arbitrary patterns, a simple approach
could be converting the pattern to a rectangular cover-
age first (rasterization), then building pyramids from
the result.
3.3 Advantages and Limitations
While the coverage model only differs from the raster
model in visualization, it is easier to see its benefits,
if compared directly with the traditional raster model.
Since the coverage–, and raster models share their
data model, changes can only be found in its represen-
tation model. Furthermore, as the coverage model en-
courages additional heuristics applied to edge cases,
the characteristics (Table 2) can depend on the pat-
tern. There are some independent advantages, on the
other hand. As coverages are rendered as vectors, ro-
An Alternative Raster Display Model
265
Table 2: Characteristics of the coverage representation
model using different patterns.
Common charactersitics
Easy to reproject
Advantages Easy to rotate
Variable cell size
Disadvantages Slower than textures
Rectangular coverage
Easily convertible to textures
Advantages Easy to interpolate and resample
Georeferencing is unequivocal
Disadvantages Sampling bias
Hexagonal coverage
Easy to interpolate
Advantages
Less sampling bias
Hard to resample
Slower than rectangular
Disadvantages
Hard to create textures
No lower left corner
Arbitrary coverage
Advantages Pattern can be tailored to use case
Performance depends on pattern
Hard to interpolate and resample
Disadvantages
Hard to create textures
Georeferencing is not trivial
tation and reprojection are trivial operations. More-
over, since no textures are used, cell size can vary
in a single coverage, allowing constant precision in
projected coordinate systems. The sole common dis-
advantage is the performance impact. While perfor-
mance depends on the complexity of the pattern, even
rectangular coverages are outperformed by textures.
Rectangular coverages have the most advantages,
since they inherit the advantages of the raster model,
while most of their disadvantages are mitigated by the
vector based visualization of the coverage model. The
only disadvantage, which cannot be resolved by the
coverage model is the sampling bias, since it is com-
ing from the rectangular cells. On the other hand, this
can be solved by choosing a hexagonal pattern. On
hexagonal coverages less heuristics can be applied,
therefore they have more disadvantages. For example,
it is simple to interpolate in a hexagonal coverage, as
centroids of neighboring cells can be calculated eas-
ily. However, resampling one is hard, as hexagons
cannot be partitioned into smaller hexagons. Finally,
ass hexagons do not have lower left corners, hexago-
nal coverages need to supply the centroid of the origin
cell, or the lower left corner of its bounding box.
Since arbitrary coverages group patterns which do
not have any heuristics applied, those are the most dis-
advantageous ones. Apart from the common advan-
tages, they have only one; the freedom of choosing the
best pattern for the task. However, – depending on the
complexity of cell geometries – they have worse ren-
dering performance. Moreover, since a general algo-
rithm for interpolating and resampling must be vector
based (i.e. laying down the whole pattern is a require-
ment), those operations would be hard and slow. As
follows, general operations on these coverages could
only be written on a vector basis, therefore they would
rather act as a large vector layers with many small
polygons than a raster layer. On the other hand, op-
erations modifying cell values only (e.g. raster calcu-
lator) could still be fast, as they can run against the
underlying matrix without considering the pattern.
3.4 Performance Impact
There is only one aspect the current, restrictive raster
model excels at: performance. It was created with
performance in mind, therefore it offers the quickest
representation model possible in GIS. However, the
computing capacity of modern computers (even hand-
held devices) surpassed the need for such optimiza-
tions long ago. Since one can enjoy the benefits of
hardware-acceleration even in a browser (Nogueira,
2012), there is no reason to stick with the faster model
on the expense of usability.
On the other hand, the performance impact of such
a change should still be considered. There are – and
in the near future there will be – good reasons for such
optimizations. There are cases, where the amount
of transmitted data or battery life matters (e.g. field
devices), or where there is only limited computing
power (e.g. embedded systems). In order to take
those cases into consideration, the current raster dis-
play model should be kept as is. This way, desktop
users with more computing power could be granted
a permissive coverage model, while developers could
still build applications using traditional, texture based
rasters.
Another, less trivial implication is due to the flexi-
bility of the vector model. As coverages display cells
as polygons, cell geometries can be stored, if needed.
This way, one can freely adjust the ratio of stored
and calculated data. As spatial Database Management
Systems (DBMSs) are optimized for effective storing,
and quick retrieval of geometries and attributes, the
performance of dynamically subsetting, and even an-
alyzing large coverages could be increased on the ex-
pense of disk usage. This grants scalability to users,
as they could freely choose tradeoffs. For example,
a rectangular coverage can be stored as a GeoTIFF
file, in a relational database, or in an array database
(Baumann, 2001) as a georeferenced matrix. On the
other hand, it can also be stored in a database as vec-
GISTAM 2018 - 4th International Conference on Geographical Information Systems Theory, Applications and Management
266

tor data by storing the center of each cell, or storing
the geometries of the cells. In this scenario – with
proper indexing – not only subsetting could be faster,
but sparse matrices and multiresolution images could
also be stored with ease.
Similarly, developers can choose the best ratio
of memory consumption and rendering performance.
For example, if hardware-acceleration is used, the tri-
angulation of the whole layer can be stored, gradu-
ally increasing performance on the expense of mem-
ory consumption. However, additional memory re-
quirement can also be fine-tuned. For example, one
must store at least two floating point values per ver-
tex, which can be complemented with four byte val-
ues (RGBA colors) for maximum performance. On
the other hand, colors can be defined dynamically, on
the fly, in order to decrease memory consumption. In
cases when memory footprint should be kept at min-
imum, the tessellation can be triangulated on every
drawn frame. Alternatively, if both the rendering en-
gine and the application requirements permit it, the
coverage can be rendered on a texture, and reused un-
til the map scale changes.
4 CONCLUSIONS
The raster model is still a dominant, widely used
model in GIS, although it has numerous limitations.
Its fundamental advantage comes from its matrix na-
ture, as it has well-optimized, fast algorithms, which
can effectively be parallelized. On the other hand, its
disadvantages – mostly coming from its representa-
tion model – are also severe. Its rectangular grid is
based on euclidean geometry, therefore it can only
map spherical surfaces and volumes with distortions.
It is also vulnerable to transformations, and hard to
reproject.
On the other hand, the vector data model does not
have these limitations; vectors can be arbitrarily and
accurately reprojected or interpolated. They require
more computing power for those operations, however,
modern personal computers have the computing ca-
pacity required for a vector-based coverage model.
Furthermore, vectors have the unique ability of stor-
ing many attributes linked to a single entity, and well-
optimized spatial Database Management Systems ca-
pable of analyzing them.
The coverage model we are proposing in this pa-
per makes possible to use non-rectangular tessella-
tions similarly to traditional rasters. Its practical im-
plementation seems straightforward, as it does not
collide with database standards, and can be integrated
into raster data exchange formats with minimal mod-
ifications. On the software side, as the simple form of
the proposed model would only require affine trans-
formations and a vector rendering engine, thus adding
it to modern GIS software would have no conceptual,
nor practical limits.
ACKNOWLEDGEMENTS
This study was supported by the
´
UNKP-17-3-I New
National Excellence Program of the Ministry of Hu-
man Capacities, Hungary. The authors would like
to thank the five anonymous reviewers for their con-
structive comments on the first version of this article.
REFERENCES
Baumann, P. (2001). Web-enabled raster gis services for
large image and map databases. In 12th International
Workshop on Database and Expert Systems Applica-
tions, 2001. Proceedings., pages 870–874. IEEE.
Birch, C. P., Oom, S. P., and Beecham, J. A. (2007). Rect-
angular and hexagonal grids used for observation, ex-
periment and simulation in ecology. Ecological Mod-
elling, 206(3):347–359.
Bolstad, P. (2016). GIS Fundamentals: A First Text on Ge-
ographic Information Systems, Fifth Edition.
Bugya, T. and Halmai,
´
A. (2013). The multiresolution im-
age format. Journal of Geographic Information Sys-
tem, 5(1):87–95.
Chrisman, N. (1987). Fundamental principles of geographic
information systems. In Proceedings of Auto-Carto,
volume 8, pages 32–41.
Esri (2017). Generate Tessellation.
https://pro.arcgis.com/en/pro-app/tool-
reference/data-management/generatetesellation.htm.
Accessed: 2017-11-17.
Farkas, G. (2017). Practical GIS. Packt Publishing, Birm-
ingham, UK.
Her, I. (1995). Geometric transformations on the hexag-
onal grid. IEEE Transactions on Image Processing,
4(9):1213–1222.
Huisman, O. and De By, R. A. (2009). Principles of geo-
graphic information systems. ITC Educational Text-
book Series, 1.
Lim, H. (2008). Raster Data. In Shekhar, S. and Xiong,
H., editors, Encyclopedia of GIS, pages 949–955.
Springer, NY, USA.
Nogueira, E. T. (2012). WebGL: a new standard for devel-
oping 3D applications. Virtual Reality and Scientific
Visualization Journal, 5(2):40–60.
Ramakrishna, A., Chang, Y., and Maheswaran, R. (2013).
An interactive web based spatio-temporal visualiza-
tion system. In Bebis, G., Boyle, R., Parvin, B., Ko-
racin, D., Li, B., Porikli, F., Zordan, V., Klosowski, J.,
An Alternative Raster Display Model
267

Coquillart, S., Luo, X., Chen, M., and Gotz, D., edi-
tors, Advances in Visual Computing: 9th international
symposium, ISVC 2013, Part II., pages 673–680.
Ritter, N. and Ruth, M. (1997). The GeoTiff data inter-
change standard for raster geographic images. In-
ternational Journal of Remote Sensing, 18(7):1637–
1647.
Yu, E. and Custer, A. (2006). ArcInfo ASCII Grid
format. http://old.geotools.org/ArcInfo-ASCII-Grid-
format 5250.html. Accessed: 2017-11-13.
GISTAM 2018 - 4th International Conference on Geographical Information Systems Theory, Applications and Management
268
