
Multi-agent Model for Domotics and Smart Houses
Guillaume Guerard, Loup-No
´
e Levy and Hugo Pousseur
Pole Universitaire L
´
eonard de Vinci, Research Center, Paris La D
´
efense, France
Keywords:
Multi-Agent System, Microgrid, Smart House, Home Automation, Demand-Response.
Abstract:
Most of the demand-side management programs focus on the interactions between an aggregator and its users.
Moreover, renewable energy production being irregular, increasing their number implies to predict consump-
tion and energy storage or discharge in real time. This is why the consumption patterns of every device
connected to the grid must be organized in order to optimize the global consumption of the grid. Studying the
smart grid through modeling and simulation provides us with valuable results which cannot be obtained in the
real world due to time and cost related constraints. In this paper, we focus on a multi-agent model to simulate
a microgrid and domotics through automaton and energy consumption scheduling.
1 INTRODUCTION
Our society is electrically dependent. The Power Grid
supplies energy to households, businesses, and indus-
tries. Nevertheless, disturbances and blackouts are
becoming common. With the pressure from ever-
increasing energy demand and climate change, find-
ing new energy resources and enhancing energy effi-
ciency have become the priority of many nations in
the 21st century.
The classical electric power infrastructure that has
served us sufficiently to a certain extent, also known
as the grid, is rapidly running up against its limita-
tions. Our lights may be on, but systemically, the
risks associated with relying on an often overtaxed
grid grow in size, scale and complexity every day.
The Power Grid is evolving into a Smart Grid, where
power systems, information and communication tech-
nologies meet in order to generate, transport, dis-
tribute and consume energy in a more efficient man-
ner.
A Smart Grid is defined as following (Amin,
2011): it is capable of adapting, predicting and com-
municating with the different agents it is interact-
ing with (production, consumers, weather...) to op-
timize production, transport and consumption of en-
ergy. It can be seen as a complex system optimiz-
ing efficiency, reliability and robustness of the elec-
trical grid. It is made of intelligent nodes interacting
autonomously to deliver power to consumers by in-
tegrating advanced control and communication tech-
niques.
A smart grid must allow customers to make in-
formed decisions about their energy consumption, ad-
justing both the timing and quantity of their electric-
ity use. Such technologies detect the need for a load
shedding, communicate the demand for participating
users, schedule load shedding, and verify compliance
with the grid.
From 1980s, many technologies have emerged.
Automatic meter reading was used for monitoring
loads from important customers, and evolved into
the Advanced Metering Infrastructure, whose meters
could store how electricity was used at different times
of the day. Monitoring and synchronization of wide
area networks were revolutionized in the early 1990s
when the Bonneville Power Administration expanded
its smart grid research with prototype sensors that are
capable of very rapid analysis of anomalies in elec-
tricity quality over very large geographic areas.
By the late 1990s, home automation was com-
monly used. Automation describes any system in
which informatics and telematics were combined to
support activities at home. Security, privacy, reliabil-
ity and robustness are important aspects concerning
power grid operations. According to the Federal En-
ergy Regulatory Commission, demand-response (DR)
is defined as:
The changes in electricity usage by end-use
customers from their normal consumption pat-
terns in response to changes in the price of
electricity over time, or to incentive payments
designed to induce lower electricity use at
times of high wholesale market prices or when
Guerard, G., Levy, L. and Pousseur, H.
Multi-agent Model for Domotics and Smart Houses.
DOI: 10.5220/0006757202230230
In Proceedings of the 7th International Conference on Smart Cities and Green ICT Systems (SMARTGREENS 2018), pages 223-230
ISBN: 978-989-758-292-9
Copyright
c
2019 by SCITEPRESS – Science and Technology Publications, Lda. All rights reserved
223

system reliability is jeopardized.
Because a Smart Grid evolves through time and archi-
tecture, a multi-agent model is needed to understand
its complex behavior. A centralized point of view is
unsuitable to solve every problem in a Smart Grid;
where a distributed or systemic approach gives tools
to model, to understand and to simulate various agents
with their own behaviors in interaction.
The paper presents a simulation of a microgrid
with random devices in a context of Smart Grid. By
the way, the goals are to reduce peak demand, to
smooth the consumption curve and to adapt devices’
behavior in function of the local requirements and the
overall system.
This paper is organized as the following: in the
second section demand-response is introduced in or-
der to define a generic model for home automation
following by some examples in section 3. Section
4 presents a multi-agent model in a smart grid con-
text. First results are shown in section 5. A discussion
about the model and how to enhance it forms the last
section.
2 GENERIC MODEL FOR HOME
AUTOMATION
Demand-Response includes all intentional modifica-
tions to consumption patterns of electricity to induce
customers that are intended to alter the timing, level
of instantaneous demand, or the total electricity con-
sumption (Albadi and El-Saadany, 2007).
A Smart House is composed of many devices.
They are divided into two categories: those that
includes DR programs and those that don’t. In
our model, demand-response programs are based on
price. For further details about price-based programs,
we recommended the following articles by Albadi et
al. and Cappers et al. (Albadi and El-Saadany, 2008;
Cappers et al., 2010).
We classify devices thanks to simple rules about
their process and the DR programs they can follow in
the following article (Gu
´
erard et al., 2017).
A device is defined by a set of four categories, it
picks one element of each category:
1. The device is cyclic (i.e. washing machine) or
acyclic (i.e freezer).
2. The device has or doesn’t have batteries.
3. Which data are used: external (i.e. heater in the
room) or internal (i.e internal temperature of the
refrigerator) or both.
4. The device consume, or produce, or both.
Then, a device gets a set of parameters. They are in-
put values that determine how and when a device will
consume or adjust its consumption following a DR
program. The set includes:
Internal data : they correspond to internal data of
the machine, collected by internal sensors.
External data : they correspond to external data of
the machine, in its environment collected by sen-
sors.
Consumer’s preference : these parameters are the
most important. Because the user should not be
hampered in his daily life, its preferences are the
bounds that devices have to reach.
Price : consumers, as described in (Kirschen et al.,
2000), consider both current prices and the prices
of one step into the future. To perform shifting,
devices have to know how to schedule their con-
sumption. In our model, we use current prices,
prices of one step into the future and price trend.
The last two are calculated from derivative func-
tion, norms and a pricer.
There are four general DR programs (QDR, 2006;
Sezgen et al., 2007; Valero et al., 2007):
Reducing Power: customers can reduce their elec-
tricity usage during critical peak periods when
prices are high without changing their consump-
tion pattern during other periods.
Shifting: customers respond to high electricity prices
by shifting some of their peak demand operations
to off-peak periods.
Spinning Reserves: customers use local batteries
and distributed generation combined with loads’
management.
Emergency Cut: when the peak demand is still ac-
tive even after the first three actions, an emergency
cut is operated.
For each combination of category-parameters-
program, an automaton is created. A device is an
aggregation of various automaton that describes its
behaviors in function of time, consumer preference
and real-time price.
3 EXAMPLE OF HOME
AUTOMATION
As an example, we will present a cyclic, consumer,
without batteries, with internal parameters’ device: a
dish-washer. In this automaton, a letter of its alphabet
SMARTGREENS 2018 - 7th International Conference on Smart Cities and Green ICT Systems
224

is read every 5 minutes. In order to have a more accu-
rate automaton, we can discretize time in more steps.
Those works will be shown in a further paper.
Depending on the dirtiness of the dishes, the dish-
washer cycle will require heating the water a different
number of times and for different times as shown in
Figure 1. However the states ”cleaning” and ”rins-
ing” (with a consumption respectively at 2100W and
40W) remain the same. Thus, the automaton makes it
possible to model all the cycles with only three states
representing its consumption: StandBy, 2100 and 40
(Figure 2).
It allows a large number of arrangements. Indeed,
according to the conditions (C
i
V ) the automatons will
create a stack of alphabets elements (L
i
) describing
the succession of the stages of the cycle. The automa-
ton will unstack from one element to another until the
end of the cycle.
For example, to model the test1 consumption the
automaton take the following stack:
L
1
= 40, 2100, 2100, 40, 40, 2100, 40, 40, 40, 40,
40, 40, 40, 40, 2100, 2100, 2100, 40, 40, 40
And to model the test2 consumption the automa-
ton take the following stack:
L
2
= 2100, 2100, 40, 40, 2100, 40, 40, 2100, 40, 40,
40, 40, 40, 40, 40, 2100, 2100, 2100, 2100, 40
The presented automaton has a problem in the
case where the average consumption during 5min is
in fact neither 2100W nor 40W . It is then necessary to
either round to the nearest state as done for the 35min-
40min section of the red curve, or to create an au-
tomaton with more states in order to be more accurate
to the real curves, and to take a better discretization
of time (each 2min for example). Another automaton
for the dishwasher is shown in Figure 3).
The following stack represents consumption of
test2:
L
2bis
= 2100, 2100, 40, 40, 2100, 40, 40, 600, 40, 40,
40, 40, 40, 40, 40, 2100, 2100, 2100, 2100, 40
The model can be refined to the point of repre-
senting any consumption’s curve. It is then possible,
according to the discretization of the time, to estimate
the various actions of the automaton. In our example,
the input stack is fixed, so there is only one possibility
of consumption.
For another automaton, we obtain a prefix tree of
the form presented in Figure 4. It is important to note
that from a prefix tree, it is also possible to build the
associated finite state automaton as shown in Figure
5, so building an automaton for a device can be done
by machine learning.
4 MULTI-AGENT MODEL
A system which consists of large populations of con-
nected agents, or collections of interacting elements,
is said to be complex if there exists an emergent
global dynamic. This behavior results from the ac-
tions of its parts rather than being imposed by a cen-
tral controller. That is a self-organizing collective be-
havior that is difficult to anticipate from the knowl-
edge of local behavior (Boccara, 2004). The complex
system approach is described in the following articles
(Ahat et al., 2013) and (Amor et al., 2014).
Computer modeling and simulation have proven
to be a useful tool, if not essential, to help decision
making in studying and designing complex artificial
systems (Molderink et al., 2009). Any change in
a Smart Grid involves millions or billions of Euros.
Thus, any change needs a deep study and some sim-
ulations to integrate or to understand all the conse-
quences and any kind of new behaviors, disruptions
in the new grid.
A Smart Grid presents a shared resource among
multiple actors, with divergent interests. A multi-
agent system (MAS) modeling presents the global dy-
namic of the system from individual components and
explores emergent properties associated with this dy-
namic. However, it should be noted that MAS have
a major drawback: one model run does not allow to
conclude about the relationship between model and
results (Weiss, 1999). We will present in the next sec-
tion some results, but previously let us expose our first
model.
Our model focuses on microgrid. A microgrid is a
broader view of local consumers, it is a tree structure
representing an eco-district bounded by the upstream
substation. Its goal is to distribute energy from a sub-
station to consumers. It orders an amount of energy
from the T&D network to local consumers.
A local consumer supports the consumption of en-
ergy, which is the distribution of energy among de-
vices under its responsibility. In other words, a local
consumer is defined by the area under the control of
a smart meter or other automation/management con-
troller. Those devices may also produce energy or
storage energy.
The goals of any microgrid are to limit using ex-
ternal sources of energy, to avoid brutal changes in its
consumption curve. The consumption of each device
from each house has to be adapted accordingly to the
microgrid’s behavior. For the first simulation, we take
four houses for one microgrid.
In each of the houses there are a number of de-
vices: some have batteries others do not, some are
cyclic other are not etc. These devices will turn them-
Multi-agent Model for Domotics and Smart Houses
225
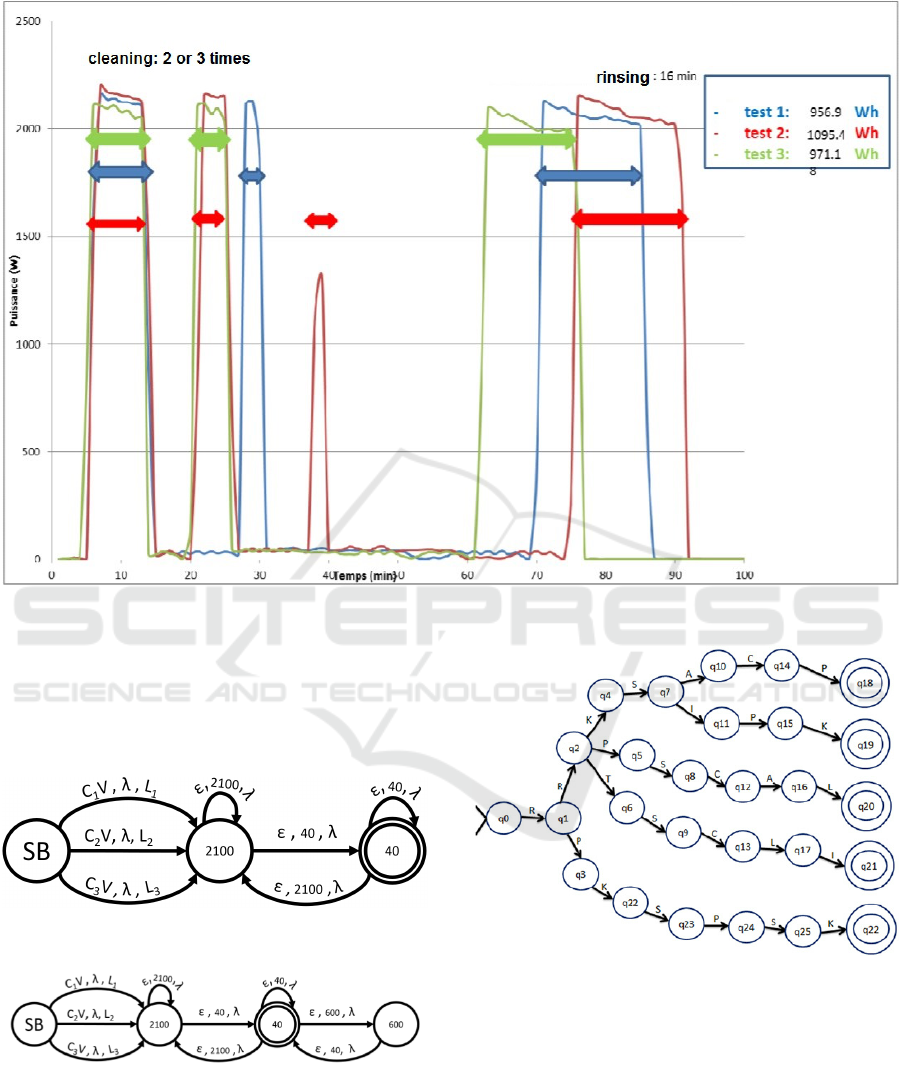
Figure 1: Consumption’s curve for a dishwasher.
selves on or o f f , or will reduce/increase their con-
sumption according to their automaton. Their behav-
ior will depend on global variables of the microgrid
as well as on local variables according to the previous
section.
Figure 2: Automaton for a dishwasher.
Figure 3: Automaton for a dish-washer (more accurate).
Each agent represents a device with its parameters
and values. The device will choose a consumption
scheme according to his situation. The devices with
a battery can choose to charge or to discharge their
batteries. The devices may choose to defer their con-
sumption if they can. This way each device, in func-
Figure 4: A prefix tree automaton (Datta and Mukhopad-
hyay, 2015).
tion of its automaton, has a variety of schemes it can
choose to adopt.
On the UML diagram (see Figure 6) we can see
how the internal and external parameters influence the
behavior of the devices, whether it is by activating the
battery or delaying consumption.
SMARTGREENS 2018 - 7th International Conference on Smart Cities and Green ICT Systems
226
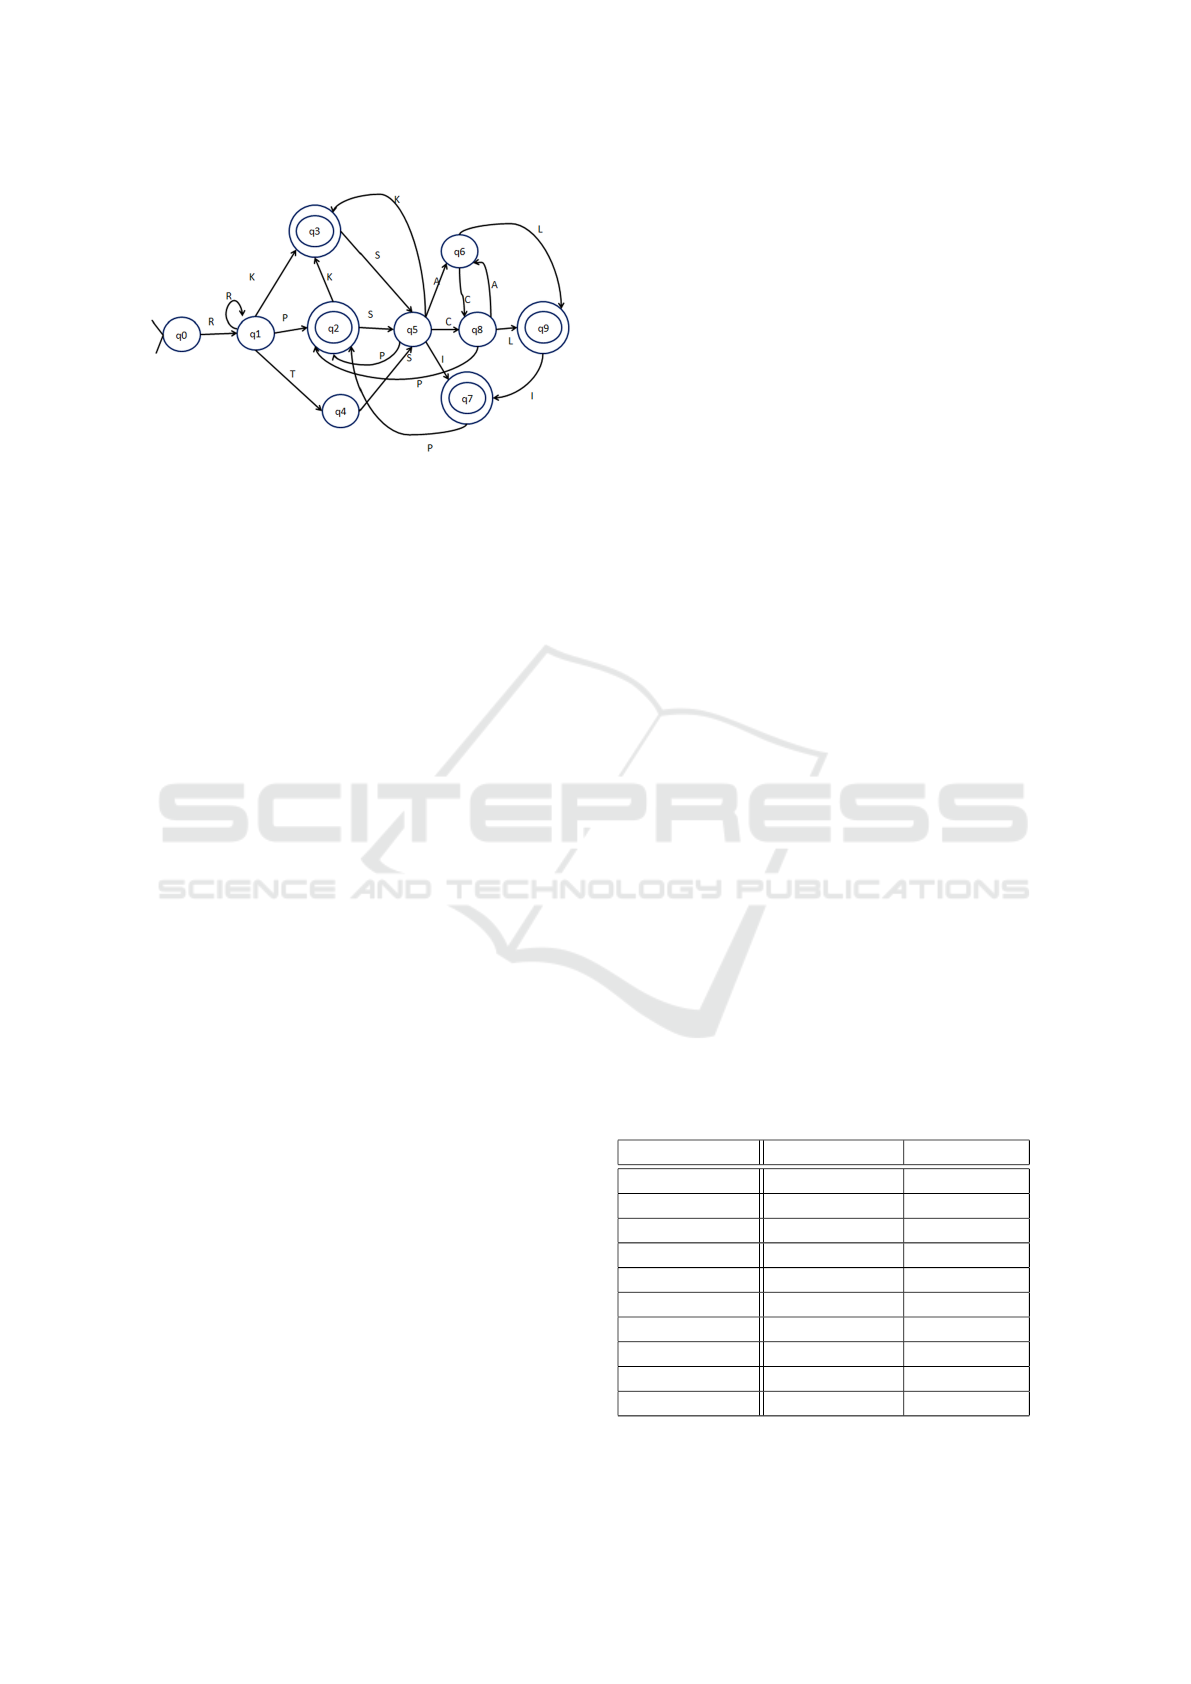
Figure 5: The finite state automaton associated to Figure 5
(Datta and Mukhopadhyay, 2015).
5 FIRST RESULTS
When the regulation is activated in the microgrid, the
devices with a battery try to regulate the system using
one principle: if the global consumption goes beyond
the average value plus a tolerance value that is spe-
cific to each device, then the devices will set itself on
battery mode in order to get the global value to get
closer to its average value. This way, important vari-
ations are avoided. But if for every device the thresh-
old tolerance value was the same, then they would all
react at the same time, leading to important peaks in
the global consumption (see Figure 7). Therefore, the
variation of the threshold value must be adapted to the
system to stay stable. The same principle is applied
to the deferrable devices and with a load shifting pro-
gram.
The global consumption is approximate to a cyclic
curve. The consumption is higher in the evening and
decreases rapidly after midnight. The model has been
studied running in three different ways, first without
any regulation, second with a well-adjusted regulation
and third with a poorly adapted regulation. A day is
divided in 144 time units.
The figure 7 represents the consumption in func-
tion of the time during a day without regulation.
On figure 8 we can see how the amplitude of the
peaks are lower with a well-adapted regulation than
with no adaptation. The consumption of the grid stays
closer to its average.
On Figure 9, even though the consumption-mode-
changing-threshold-value (the consumption value of
the grid that makes the device change his mode of
consumption) is different for each device, the re-
sponse of the devices is not adapted to the grid. The
distribution of the threshold values are not adapted
to the variation of the consumption. This gives an
overactive microgrid and therefore an unstable sys-
tem. Here, all the devices react the same way at a
small decrease in consumption leading to an impor-
tant rise of consumption, to which the devices react
with an even greater decrease, leading the system of
balance. The cause of this problem is the bad distri-
bution of the consumption-mode-changing-threshold-
value. The solution to this problem was the cre-
ation of a process in which the consumption-mode-
changing-threshold-value of the device is regularly
updated based on the historic of global consumption.
This way the devices can adapt to a change in the grid.
On the figure 10, the regulation began after 140
ticks (unite of time). The system went off balance,
but once the regulation activated, the devices adjusted
their threshold values according to the historic of con-
sumption and managed to find balance again.
6 DISCUSSION AND FUTURE
WORKS
The simulation of this paper is based on NetLogo.
NetLogo is a language and an IDE (integrated de-
velopment environment) focused on MAS, allowing
to easily create graphs, animations 2D/3D. The main
reason to choose NetLogo is the simplicity for creat-
ing a prototype allowing fast results.
One of the disadvantages of NetLogo for our work
is that the centralization of information about the de-
vice consumption cannot be done. In the last simu-
lation, each device had to take decisions alone, only
based on the global consumption. The best way to
centralize information would be to create an agent
with such a role. JADE allows the attribution of more
specific tasks for each agent, with a more important
consumption monitoring, and more interactions be-
tween devices. This representation is more realist, it’s
easier to implement a device controller than to imple-
ment a controller on each device.
Table 1: Comparisons between JADE and Netlogo.
Features JADE NetLogo
Utility Post Prototype Prototype
Open source Yes Yes (since v5)
Development complex, longer simply,fast
Task Multi-threads Only one
Synchronization asynchronous synchronous
Object Oriented Yes No
Ontology Yes No
Programs Several Only one
Service Notion Yes No
Language Java NetLogo
This table shows the principal differences between
Multi-agent Model for Domotics and Smart Houses
227
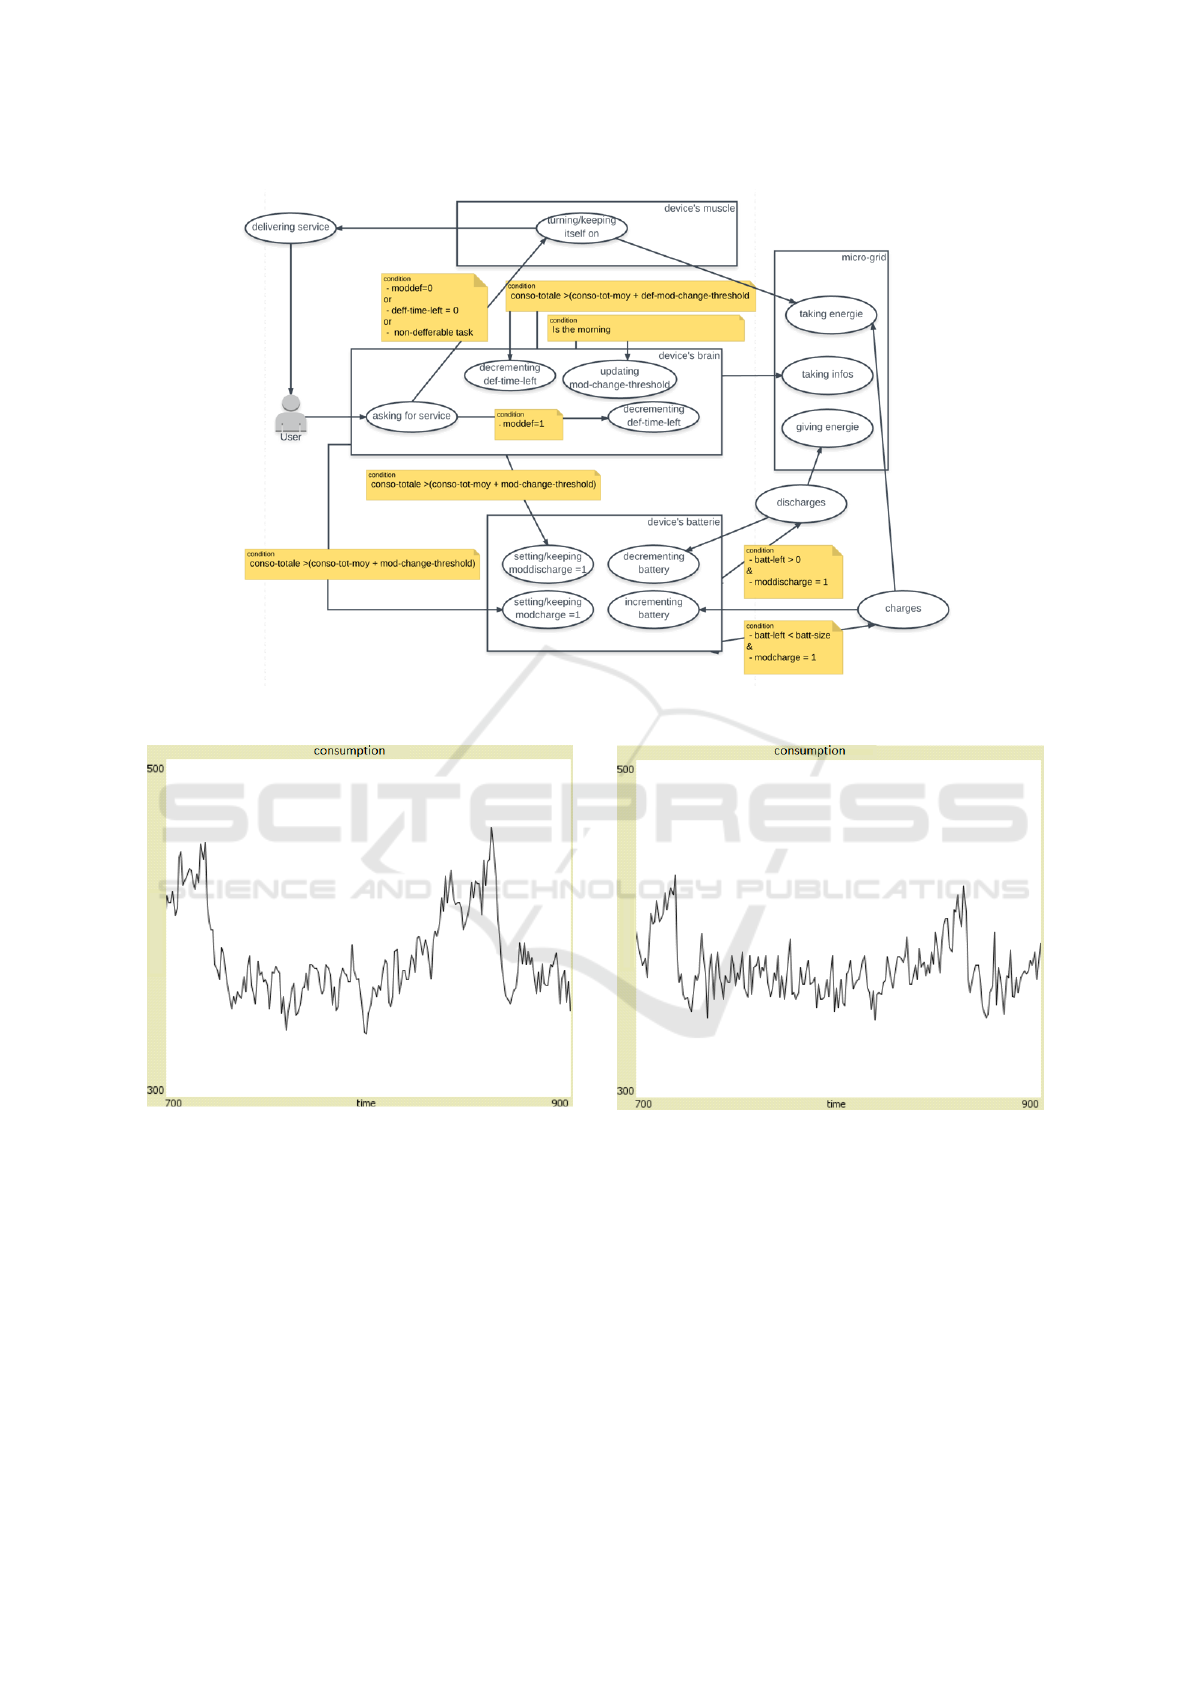
Figure 6: UML diagram of a device with a battery and shifting abilities.
Figure 7: Curve with no regulation.
JADE and NetLogo
On the figure 11, the control agent analyzes the
current global consumption. This analysis gives the
best distribution strategy improving the optimization,
taking into account:
• User parameters (each home gets difference con-
sumption).
• Weather (outside and inside).
• Electricity market price (current price compared
with the average price).
• The devices list already launched.
Figure 8: Curve with well-adapted regulation.
This agent can launch a device, ask a device to switch
off (only if this device is an acyclic device). During
a device execution, the control agent can change its
consumption, but this change has an impact on the
execution time.
Each consumer device is represented by an
agent, at each creation, an agent begins by declaring
himself at the directory agent and waits for an order
gave by the control agent.
• A cyclic device executes the order until the task is
finished.
SMARTGREENS 2018 - 7th International Conference on Smart Cities and Green ICT Systems
228
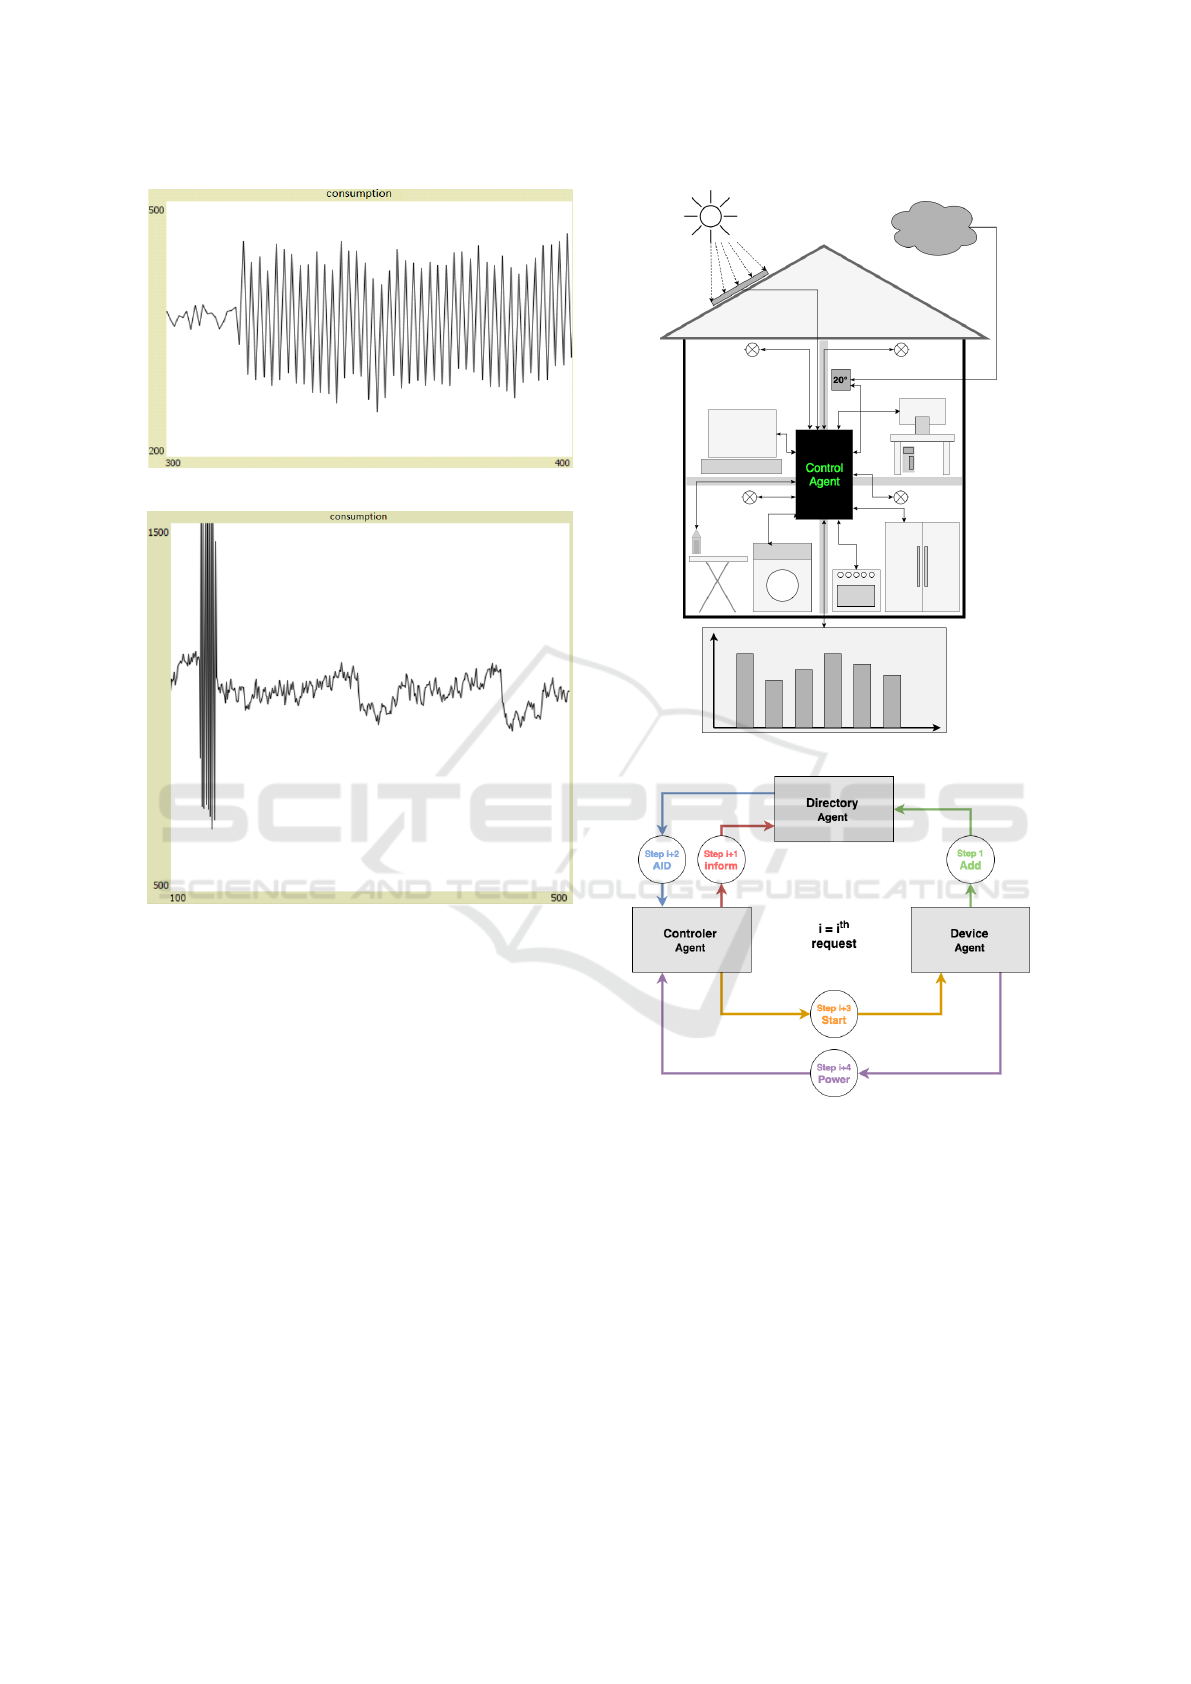
Figure 9: Curve with ill-adapted regulation.
Figure 10: Curve with autoadapted regulation.
• An acyclic device executes the order until the con-
trol agent asks to stop.
When a device stops, the agent returns to the control
agent the electric consumption used. After using an
agent can be replayed.
Each edge represents interaction between two
agents. The AID is an object of JADE, representing
the agent address. The control agent needs to have the
device AID for sending a launch request.
The JADE model will replace the NetLogo model
in order to provide more results. The JADE model
will be based on a real microgrid near Paris, France,
named Le-Perray. This project aimed to combine
BIM model, MAS model and deep learning process to
optimize energy consumption, production and lower
the price for all users.
Figure 11: Control agent explication.
Figure 12: Interaction between home agents.
ACKNOWLEDGEMENTS
Two of the authors are in second and last year in
an engineering school (France, the same degree as
Msc). They work in a half-time curriculum with an
associated professor about their subject (respectively
a multi-agent model and a generic automaton model
for smart devices). This paper concludes their first
year in this curriculum.
Multi-agent Model for Domotics and Smart Houses
229

REFERENCES
Ahat, M., Amor, S. B., Bui, M., Bui, A., Gu
´
erard, G., and
Petermann, C. (2013). Smart grid and optimization.
American Journal of Operations Research, 3:196–
206.
Albadi, M. H. and El-Saadany, E. (2007). Demand response
in electricity markets: An overview. In 2007 IEEE
power engineering society general meeting.
Albadi, M. H. and El-Saadany, E. (2008). A summary of de-
mand response in electricity markets. Electric power
systems research, 78(11):1989–1996.
Amin, S. M. (2011). Smart grid: Overview, issues and op-
portunities. advances and challenges in sensing, mod-
eling, simulation, optimization and control. European
Journal of Control, 17(5-6):547–567.
Amor, S. B., Bui, A., and Gu
´
erard, G. (2014). A context-
free smart grid model using complex system ap-
proach. In Proceedings of the 2014 IEEE/ACM 18th
International Symposium on Distributed Simulation
and Real Time Applications, pages 147–154. IEEE
Computer Society.
Boccara, N. (2004). Modeling complex systems. Springer
Verlag.
Cappers, P., Goldman, C., and Kathan, D. (2010). De-
mand response in us electricity markets: Empirical
evidence. Energy, 35(4):1526–1535.
Datta, S. and Mukhopadhyay, S. (2015). A grammar infer-
ence approach for predicting kinase specific phospho-
rylation sites. PloS one, 10(4):e0122294.
Gu
´
erard, G., Pichon, B., and Nehai, Z. (2017). Demand-
response: Let the devices take our decisions. In Pro-
ceedings of the 6th International Conference on Smart
Cities and Green ICT Systems, pages 119–126.
Kirschen, D. S., Strbac, G., Cumperayot, P., and
de Paiva Mendes, D. (2000). Factoring the elastic-
ity of demand in electricity prices. IEEE Transactions
on Power Systems, 15(2):612–617.
Molderink, A., Bosman, M., Bakker, V., Hurink, J., and
Smit, G. (2009). Simulating the effect on the energy
efficiency of smart grid technologies. In Winter Sim-
ulation Conference (WSC), Proceedings of the 2009,
pages 1530–1541. IEEE.
QDR, Q. (2006). Benefits of demand response in electricity
markets and recommendations for achieving them. US
Dept. Energy, Washington, DC, USA, Tech. Rep.
Sezgen, O., Goldman, C., and Krishnarao, P. (2007). Op-
tion value of electricity demand response. Energy,
32(2):108–119.
Valero, S., Ortiz, M., Senabre, C., Alvarez, C., Franco, F.,
Gabald, A., et al. (2007). Methods for customer and
demand response policies selection in new electricity
markets. IET generation, transmission & distribution,
1(1):104–110.
Weiss, G. (1999). Multiagent systems: a modern approach
to distributed artificial intelligence. The MIT press.
SMARTGREENS 2018 - 7th International Conference on Smart Cities and Green ICT Systems
230
