
Decision Support Dashboard for Traffic and Environment Analysis of a
Smart City
Jorge Pereira
2
, Susana Sargento
1,2
and Jos
´
e Maria Fernandes
1,3
1
Departamento de Eletr
´
onica, Telecomunicac¸
˜
oes e Inform
´
atica, Universidade de Aveiro,
Campus Universit
´
ario de Santiago, Aveiro, Portugal
2
Instituto de Telecomunicac¸
˜
oes, Campus Universit
´
ario de Santiago, Aveiro, Portugal
3
Instituto de Engenharia Electr
´
onica e Telem
´
atica de Aveiro, Campus Universit
´
ario de Santiago, Aveiro, Portugal
Keywords:
Analytics for Intelligent Transportation, Vehicle Information Systems, Smart City, Data Warehouse, Decision
Support Systems, Traffic Management Reporting Systems.
Abstract:
Porto city has an in-place infrastructure of fixed and moving sensors in more than 400 buses and roadside
units, with both GPS and mobility sensors in moving elements, and with environmental sensors in fixed units.
This infrastructure can provide valuable data that can extract information to better understand the city and,
eventually, support actions to improve the city mobility, urban planning, and environment.
Our system provides a full stack integration of the information into a city dashboard that displays and cor-
relates the data generated from buses and fixed sensors, allowing different visualizations over the traffic and
environment in the city, and decisions over the current status of the city. A good example relates bus speed
variation with possible anomalies on the road or traffic jams. Visualizing such information and getting alarms
on anomalies can be a valuable tool to a city manager when taking urban planning decisions to improve the
city mobility.
1 INTRODUCTION
The smart city vision integrates different areas, such
as environment and transportation, as a way to op-
timize its allocated resources, to plan its preventive
maintenance activities, in the end to support better
city decision making. This is possible by incorporat-
ing in the city monitoring systems and smart sensors
to collect data in real time (Hall et al., ). With the
growing trend that cities are facing every day (Merry,
2017), it also comes the increasing number of vehi-
cles that circulate around their streets. As the city
grows, the traffic congestion increases and becomes
a priority to manage the road infrastructure. Optimiz-
ing road traffic is necessary but demanding, so using
different and better approaches to improve the road
management of the city is ideal.
The same vision also considers the environment
quality, so there is a need to improve the air quality by
first identifying the sources of pollution to then take
actions to minimize them. One of the sources that are
always identified is the car traffic pollution. If there is
a way to relate the traffic information with the actual
environment information, anomalies in the traffic can
be detected and a possible solution can be found.
The current work will focus on the data from the
city of Porto and it will depart from its existing IT /
smart city infrastructure (Lopes and Sargento, 2014).
Porto is one of the cities that is implementing smart
solutions to improve the dynamics and intelligence of
the overall city in a wide variety of fields, from the
environment to the mobility where distinct data of the
city are captured using an in place base of fixed and
moving sensors in more than 400 buses and roadside
units.
Analyzing road traffic in the city without a digital
solution can be done from the driver’s feedback, but
it is difficult to know with accuracy the exact source
of the problem and identify all the variables that make
that contribution. For example, there could be an ac-
cumulation of traffic in an intersection, but the source
of that problem could be at a traffic light 500 meters
before. A decision support system that gathers traffic
data, transforms, correlates and identifies its anoma-
lies can improve the mobility of the city faster and
less costly.
This work proposes a solution based on a dash-
board that serves as a decision support system for
Pereira, J., Sargento, S. and Fernandes, J.
Decision Support Dashboard for Traffic and Environment Analysis of a Smart City.
DOI: 10.5220/0006707603870394
In Proceedings of the 4th International Conference on Vehicle Technology and Intelligent Transport Systems (VEHITS 2018), pages 387-394
ISBN: 978-989-758-293-6
Copyright
c
2019 by SCITEPRESS – Science and Technology Publications, Lda. All rights reserved
387

a city manager. From the dashboard, a traffic man-
ager can pick a road to be analyzed and, with a cer-
tain detail, visualize the traffic profile and its patterns
with the possibility of comparing it from different in-
stances. Also, the environment of the city can be cor-
related with traffic information in a way of detecting
how traffic affects the pollution in the nearby areas,
providing indications of anomalies. From the results
presented in the dashboard, it is detected bad traffic
zones on the streets in different hours of the day, visu-
alize that a certain event also affects the traffic when
comparing the same street in another date, and ob-
serve that higher levels of traffic have direct impact
on the air quality.
The paper is organized as follows. Section 2
presents the related work in this area and some
dashboards implemented in smart cities. Section 3
presents the system architecture and their compo-
nents, and the algorithms and procedures made when
handling information. Section 4 exposes the final so-
lution with use cases for analysis. Section 5 concludes
the results of the paper and presents the future work.
2 RELATED WORK
2.1 Traffic Analysis Approach
TrailMarker (Honda, 2016) is an example of a work
where different approaches are used to analyze real
data sets of vehicular sensor data to find outliers, ef-
fectively finding typical patterns and points of vari-
ation on the road. This work relates to the present
work by having similar objectives of finding road pat-
terns, but is more centralized on the driver side pat-
terns where acceleration and speed are used to predict
the type of driver (inexperienced, aggressive, careful).
Erdogan (Erdogan and et al., 2008) propose a geo-
graphical information system that has the objective of
assisting the analysis of road accidents based on acci-
dent reports. In the system, the accident locations are
geo-referenced into the highways so it is easier to de-
tect the areas with high rate accidents, in a way to take
precautionary measure and improve the safety in criti-
cal areas. Another important topic is the study of pol-
lution levels related with the road traffic. In an anal-
ysis and evaluation made on the main urban roads in
Beijing (Li et al., 2002), it was used an in place noise
sensors along the road for multiple sampling points
in order to identify the factors influencing the noise
levels. From their results, where more than 3000 ve-
hicles pass every hour, above their designed capacity,
the noise levels exceeded the national standard dur-
ing daytime hours. Other factors were also pointed,
the road width, surface texture and the types of vehi-
cles in the traffic composition. A proposed model for
the evaluation of urban traffic congestion using buses
(Carli and et al., 2015) uses GPS data from bus on-
board units to probe the position and time trace and
road segments, to associate the GPS traces and calcu-
late the traffic congestion. It offers a map, graphical
and tabular representation of traffic patterns. A work
(Bacon et al., 2011) that uses real time bus data makes
an integration of data from multiple sources (buses,
cameras, OpenStreetMap), and calculates the journey
times depending of the time of the day based on bus
real time positioning. A model proposed (Kerminen
and et al., 2015) uses bus location history data to an-
alyze the traffic fluency and the time spent on driv-
ing, on bus stops and traffic lights, and the frequent
delay areas of the city during the vehicle journey to
understand the causes of delays on bus lines. In (Zhu
et al., 2012) it is studied the road traffic conditions us-
ing data collected from taxis where it was probed the
location and driving speeds during the movement. It
uses an algorithm based on compressive sensing that
achieves low error with missing data.
2.2 City Dashboards
Many cities are starting to make changes in their intel-
ligence in different areas by adding sensors and pro-
viding information through dashboards. The city of
Dublin contains a mobility dashboard
1
where the traf-
fic can be seen in a global view in the main roads, but
also parking lot locations. Our proposed work can ex-
tend the information presented by Dublin dashboard
by analyzing the roads with greater detail to improve
anomaly detection, with information in all streets.
The dashboard of London
2
presents many city
variables from points of interest, public transportation
(metro status), environment (weather and pollution
data) and cameras (street view) are viewed in real-
time. Although there is a lot of real time information,
this is only being captured and presented for a gen-
eral consumer, lacking on a more detailed analysis on
traffic congestion and pollution data.
3 PROPOSED SYSTEM AND
ARCHITECTURE
We propose a full stack solution as a system that inte-
grates information from the city to a city level dash-
board as exposed in figure 1.
1
http://www.dublindashboard.ie/pages/DublinTravel
2
http://citydashboard.org/london/
VEHITS 2018 - 4th International Conference on Vehicle Technology and Intelligent Transport Systems
388

The information flows from the three available
data sources: the Vehicular Adhoc Network (VANET)
database that feeds the traffic analysis script with ve-
hicular data of the buses, such as GPS and mobil-
ity information, all gathrered through a VANET be-
tween more than 400 buses and road side units; the
OpenStreetMap (OSM) website that adds geograph-
ical roads to the database; and a set of environmen-
tal information from multiple sensors that is available
through the FiWARE
3
data interface and service.
The processing component consists of an imple-
mentation of algorithms that validate, transform and
prepare the information before being stored in the
database. The Traffic Analysis Script consists of a
python script that is capable to match the bus posi-
tion with geographic roads and calculate speed pro-
files for each section of the road. The Road Segmen-
tation script is able to slice the OpenStreetMap road
segments dataset to Porto region, thus reducing the
number of road entries in the database. The Environ-
ment Analysis script prepares environment informa-
tion by segmenting by subject and removing errors
and imprecision’s in the measurements.
The storage system is composed by a data ware-
house that holds speed profile metrics from the buses,
a list of geographic roads and environment sensor
metrics. It also has functions that serves the algo-
rithms with logic for making spatial operations.
The Web services provide an interface for the out-
side applications. It is made of three Application pro-
gramming interfaces (APIs): the road processing API
receives instructions for the processing units; the road
traffic profiles API serves the dashboard with bus traf-
fic information from the database; and the sensor cor-
relation API provides an endpoint for the dashboard
access, that delivers complemented environment met-
rics and road traffic information.
At the end of the architecture it is located the city
web-based dashboard. It has the purpose to provide
an interface for a city manager to analyze the city ve-
hicle traffic, detect anomalies and environment status
for a city decision support.
3.1 Data Sources
The system currently has three data sources:
• VANET Database: consists of a relational
MySQL database that holds logs from bus related
vehicular data that circulate around Porto city. It
has several variables used for the algorithms: the
GPS time is the exact timestamp of the capture
of latitude-longitude attributes, the node ID is a
3
https://www.fiware.org/
unique identifier for each bus unit, and the speed
is the instant captured speed.
• OSM website: provides geographical information
of points of interest, regions and roads. The roads
are the only dataset selected and have an ID that is
a unique identifier of the segment, a name of the
street and a geometry representation of the seg-
ment.
• FIWARE service: is a RESTful web service that
offers environment information from sensors de-
ployed around Porto city. It contains the identi-
fication and position of the sensors, the time in-
stant of the captured metrics and the environment
metrics (temperature, noise, carbon monoxide).
The VANET database has a granularity of 15 sec-
onds for each bus, which means that in every 15 sec-
onds it adds a new log entry to the database table if
the bus is active. Having more than 400 active buses
adds a large amount of information that may vary de-
pending on the day and hour. In a single weekday,
it is expected to have around 1 million of entry logs.
Moreover, one of the main challenges of the vehicu-
lar dataset is to deal with GPS imprecisions presented
mainly when the vehicle is moving near tall buildings.
The FIWARE service has a granularity of 1 sec-
ond, depending on the status of the sensor, for more
than 6 deployed environment sensors. One of the
downsides is the downtime and calibration of the sen-
sors which affects the quality and quantity of the re-
sults of our dashboard, and that is out of our reach.
The OSM dataset is made of contributions con-
stantly updating, so it can be difficult to always have
the street segments updated and perfectly corrected.
For the region of Porto, it has more than 40 thousand
road segments to work with, which covers almost all
the real streets.
3.2 Data Storage
Our system relies on a data warehouse structure over
a relational database to feed the dashboard as a deci-
sion support system. The data warehouse stores the
processed vehicle data, environment information and
road segments. This was done because using a typi-
cal database approach would have issues with dealing
with the bulk data from data sources, namely to pro-
vide the different levels of data granularity and tem-
poral segmentation besides the need for some subject-
oriented summaries/data views.
The data warehouse structure is based on a star
schema (Moody and Kortink, 2000) that is made of
two fact tables: one that holds the road speed and de-
lay variables, and the other to store the environment
Decision Support Dashboard for Traffic and Environment Analysis of a Smart City
389
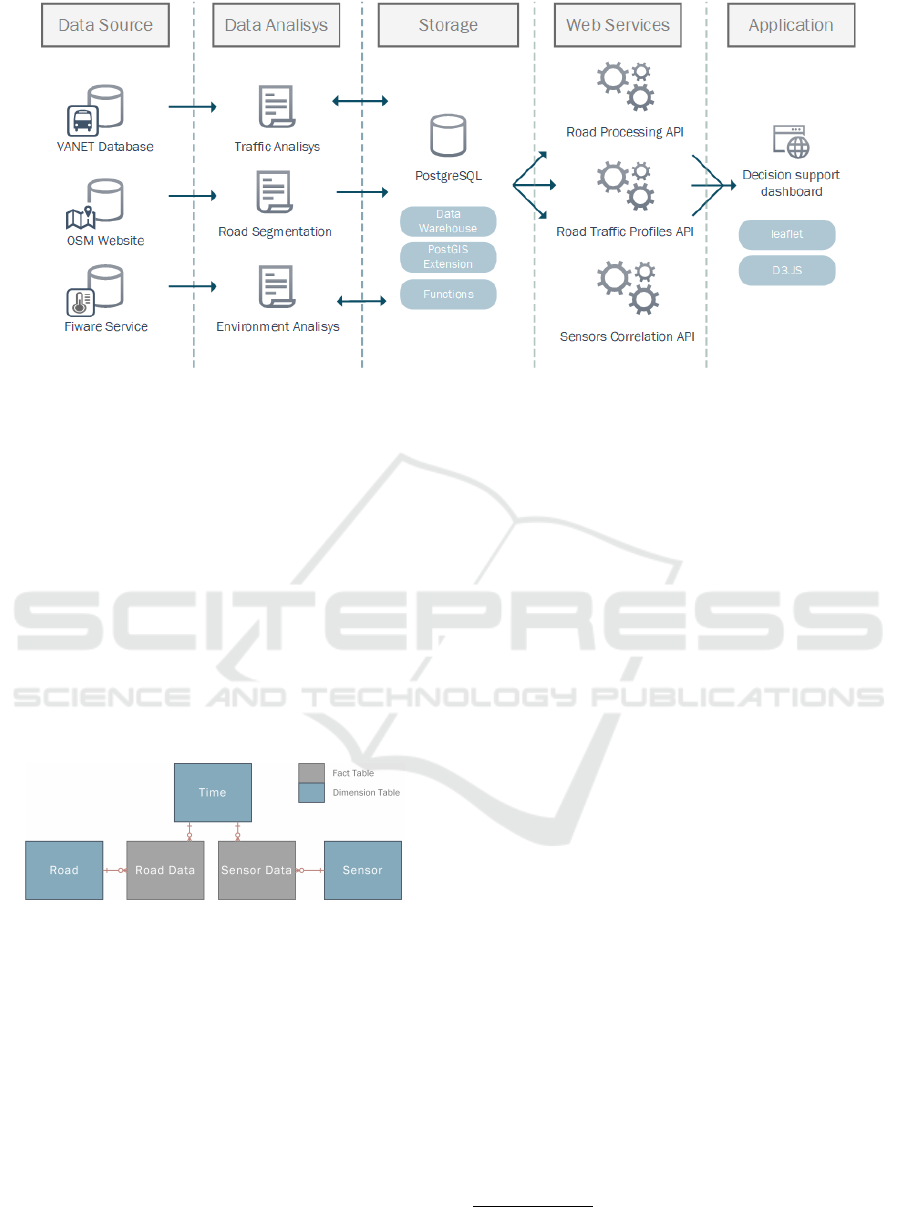
Figure 1: Proposed system flow architecture.
sensor measurements. The remaining tables are the
dimension tables to store the time in multiple granu-
larities, the geographic roads, and the sensors details.
Both fact tables have a connection to the time table
to have the time dimension associated with their en-
tries. The road data fact table also connects to the geo-
graphic roads dimension table to associate each entry
to a specific road, and the sensors data fact table con-
nects to sensor table, so that sensor data is related to
the details of the sensors. This structure helps to re-
duce the size of the database as it reuses information
from the dimension tables and offers more flexibility
when querying information from different granulari-
ties and multiple types of aggregations.
Figure 2: Database star-schema implementation.
Implemented functions on the database side were
made to ease the access of the information and to sup-
port the processing algorithms with spatial logic. One
of the functions gives the latitude-longitude position
of the road that intersects a certain vehicle, used by
the traffic analysis algorithm. Another relevant func-
tion is the one that splits a date-time into multiple time
variables and granularity to fill the time dimension ta-
ble.
PostgreSQL is the database chosen because it has
no associated cost for the software, is reliable and
has a very good support with geographic data types
and spatial operations. To support the database with
the spatial operations, it is added the PostGIS spatial
functions.
3.3 Dashboard
The Dashboard is the visible part of the system to the
end user. It is implemented as a web application based
dashboard with analytic functionality where the fo-
cus is to have multiple visual dimensions to see traffic
information. One example is the geographical repre-
sentation of roads and positions on top of a map layer,
where it relies on the data provided by the data ware-
house API, namely traffic and sensor information.
All geographical data representation of roads, po-
sitions and other overlays are implemented using
leaflet.js GIS JavaScript library
4
together with a more
analytic and precise chart representation with the help
of the D3.JS library
5
.
3.4 Building the Traffic Profile
Currently, the main focus of the system is on mo-
bility information. For that reason, special attention
is given to fetching and processing the mobility data
generated by the vehicular nodes containing its geo-
location. We implemented an algorithm to fetch data
and calculate the delay and speed profiles for a spe-
cific road at different periods of the day. Following
the figure 4, globally the algorithm 1 works as fol-
lows.
• Using the vehicle coordinates, it maps the vehi-
cle into an existing road. Here it is made a spa-
tial intersection operation, which finds the road
4
http://leafletjs.com/
5
https://d3js.org/
VEHITS 2018 - 4th International Conference on Vehicle Technology and Intelligent Transport Systems
390

that intersects the vehicle position from the list
of available Porto roads in the database. After
finding a match, it gets the identification of the
road to associate with the point, but also the frac-
tion of the road where the point is located, for ex-
ample, a fraction of 0.5, which is the middle of
the road. With the help of an implemented road
buffer, many of the real GPS data imprecision’s
are removed as there are fewer chances of a point
in a road being located outside of it.
• After matching a vehicle to a specific road, all
these data points are associated with the road and
used to calculate each individual speed and delay
in different sections of the road. For this calcula-
tion, we will follow the figure 4:
– Each bus in the figure is an entry log in the
database.
– After entering in a road, the first position marks
the beginning of the iteration, and the latitude-
longitude and time variables are saved on a list.
At this point, no calculations are made.
– For the following positions, the procedure is
different. Using the Haversive formula (figure
3), it is calculated the distance from the pre-
vious point using the latitude-longitude coordi-
nates and it is also subtracted the time to be able
to get the speed (distance ÷ time) in that sec-
tion.
– The first and third/last bus points are used to
calculate the direction of the calculated vari-
ables between them. Here it is subtracted the
fraction from both, and if the result is negative
it gives one direction, and positive otherwise.
– During this interaction, the following variables
are saved for each point in a list: ID of the bus,
the ID of the road, the sequence of the point,
the time, the speed, the distance, the direction
and the fraction of the road. This also serves
as a staging area before the data being stored in
the database.
Figure 3: The Haversine Formula (Sinnott, 1984).
• The vehicle leaves the road, and the spatial in-
tersection matches a different road, finalizing the
calculations from the point before. All this list
of calculated variables that belong to the previous
road is persisted to the database.
• The cycle is restarted after being mapped to a new
road.
The information that is resulted contains points as
objects, which includes the ID and speed of the vehi-
cle, distance from the previous point and fraction of
the road. This distance is then accumulated at each
point to give the real distance of the point on the road
instead of having the distance to the previous position.
input : Records: A number of vehicle data records
input : Query: object for querying the database
output: a list of road segment variables
points list ←
/
0;
o f f points ← 0;
last road id ← 0;
foreach entr y ∈ records do
node id ← entry[0];
gps time ← entry[1];
latitude ← entry[2];
longitude ← entry[3];
road id, road f raction ←
Query. f unction.insideRoad(latitude, longitude);
if road id = 0 or road id ! = last road id then
if o f f points = 3 and points list is not empty
then
if points list[0]. f raction −
points list[−1]. f raction < 0 then
direction ← 0;
end
else
direction ← 1;
end
if points list 2 then
Query.persist(points list, direction);
end
points list ←
/
0;
last road id ← road id;
end
continue;
end
o f f points ← 0;
if points list is empty then
road point ←
createOb ject(bus, road, sequence, time,
f raction);
points list.append(road point);
end
else
last point ← points list[−1];
sequence ← last point.sequence + 1;
delay ← gps time − last point.datetime;
distance ←
havesineDistance(last point, lat, lon);
road point ←
createOb ject(bus, road, sequence, time, speed,
distance, direction, f raction);
points list.append(road point);
end
end
Algorithm 1: Road points variables calculation.
After the points be mapped to the real distance,
they now are not aggregated by vehicle, but by dis-
Decision Support Dashboard for Traffic and Environment Analysis of a Smart City
391
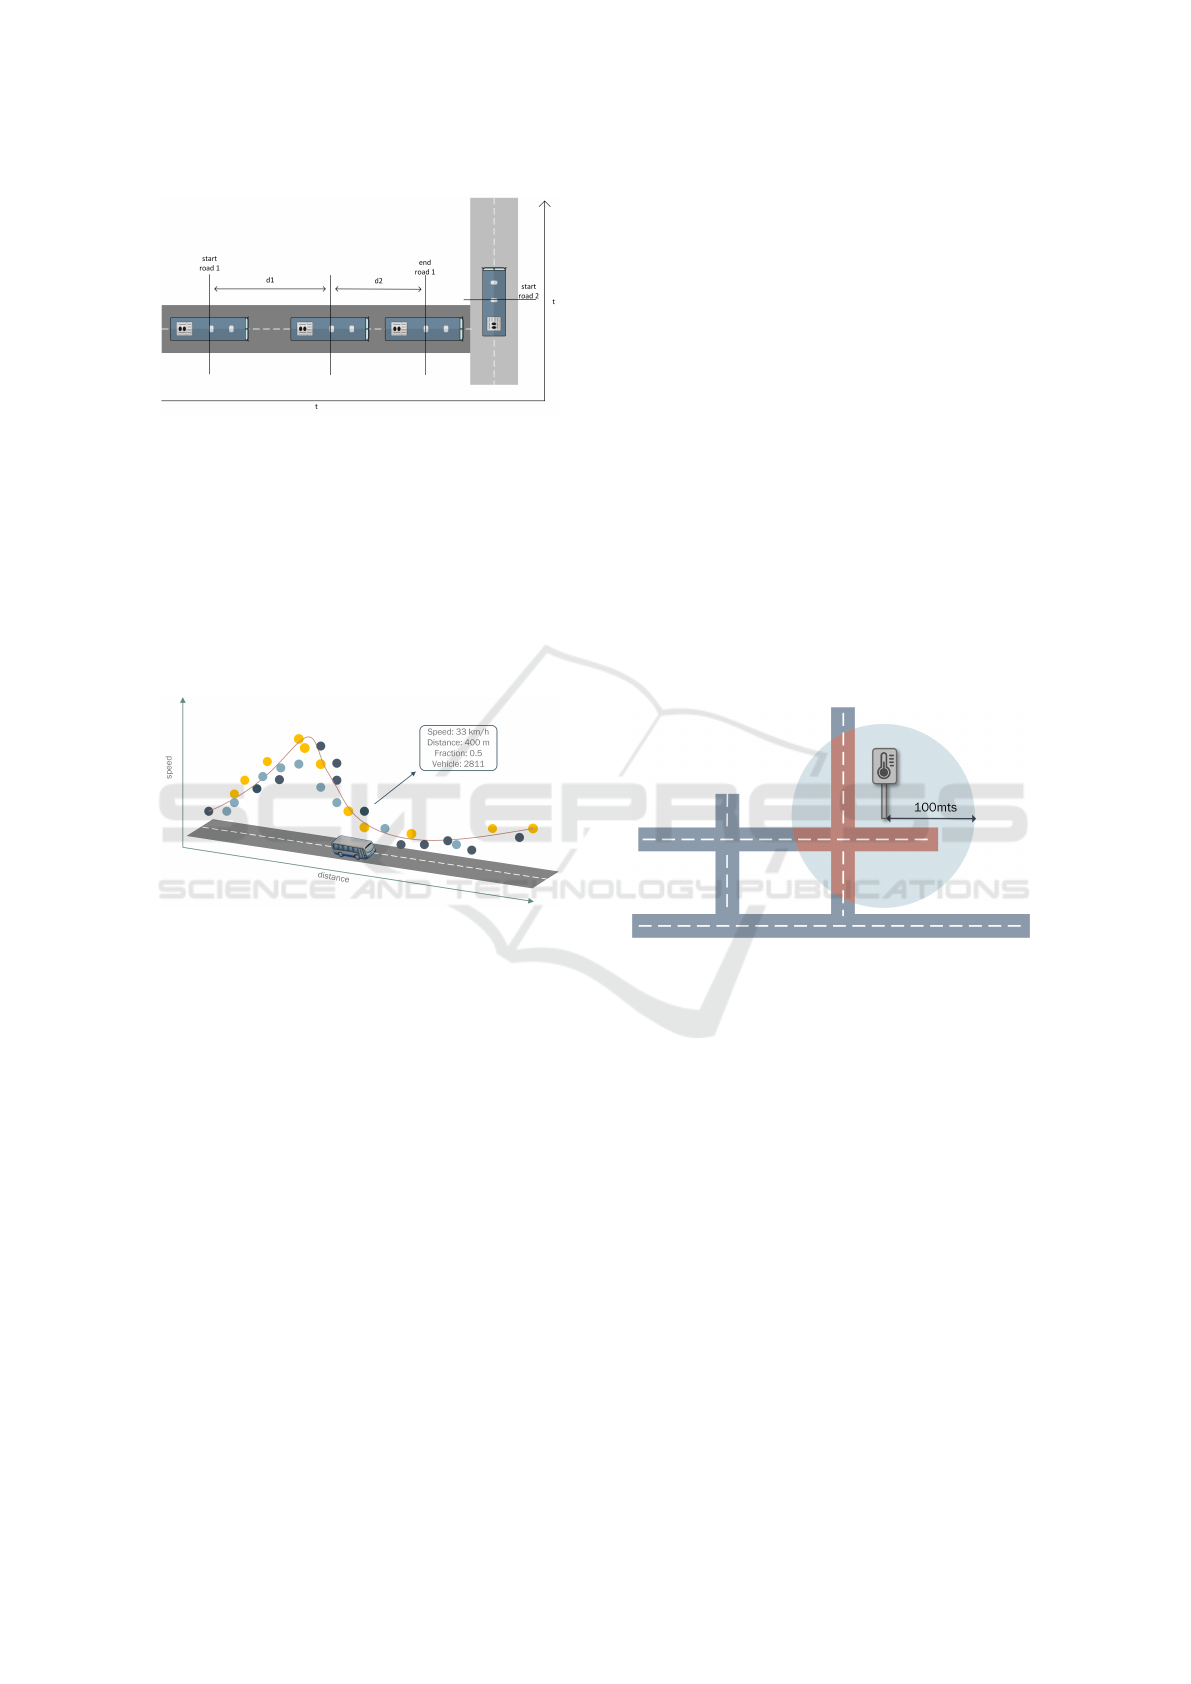
Figure 4: A bus trajectory.
tance. As figure 5 shows, multiple points from dif-
ferent vehicles create a profile through the distance of
the road.
By having the points aggregated by distance, it is
now possible to select multiple sections of the road,
and calculate for each one the 25%, 50% (median)
and 75% quartile of the speed values to give an ap-
proximated curve of the speed in the road where the
majority of the vehicles are.
Figure 5: Example of the road profile with points from 3
different vehicles.
3.5 From Sensors to Correlation
between Traffic and Environment
The impact of city traffic in the environment was the
main use case selected. It allows relating information
that could be useful to city planning and city quality
improvement; this can be achieved by relating road
traffic profiles with co-located environment sensors
along time. Relating peaks in both traffic and envi-
ronment readings can help to identify time and space
patterns that may be worth attention and/or localized
intervention because they are affected by themselves.
The calculation of the correlation is made in the
sensors correlation API, which uses the following
steps to make the calculations in real time:
• The service receives a specific sensor and time
range from dashboard inputs selected by the user.
• It is fetched from the database the average of the
environment measurements (noise, CO) aggre-
gated in the different hours of the day for the spe-
cific sensor and date range.
• As shown in figure 6, from a geographic position
of the environment sensor, it is made a radius of
100 meters to find the roads that lie inside that
area. To do this, it is used PostGIS spatial func-
tions to create a spatial circle area, to then make a
spatial intersection operation with the list of avail-
able roads, returning the ID of the valid roads
from the database.
• The IDs of the valid/nearest roads are used to
Fetch the average speed values from the multi-
ple sections that lie inside the circle, but now ag-
gregating by hours of the day from the same date
range as the data from the sensors.
• The variables from environment metrics and av-
erage speed are associated to the same hour as a
point of connection, so both profiles can be visu-
ally analyzed and correlated.
Figure 6: Approach when choosing roads to correlate with
the environment sensor.
4 EVALUATION
The main objectives when using the a visual repre-
sentation is to see the speed profile of the traffic in
a road segment and understand where are the criti-
cal zones with lower speed and also be able to make
comparisons of the street traffic in different moments,
for example, before and after public road works or
traffic mobilization, to see where the improvements
occurred.
A good use case is trying to find outliers and dif-
ferent patterns when comparing a normal day against
a day with special events. In Figure 7 it is presented
a comparison of the traffic profile of two different
weekends at the same hours of the day. Here, in the
beginning of the road segment, the traffic speed is af-
fected by the number of vehicles that tries to access
the road and in the end of the segment because of the
VEHITS 2018 - 4th International Conference on Vehicle Technology and Intelligent Transport Systems
392
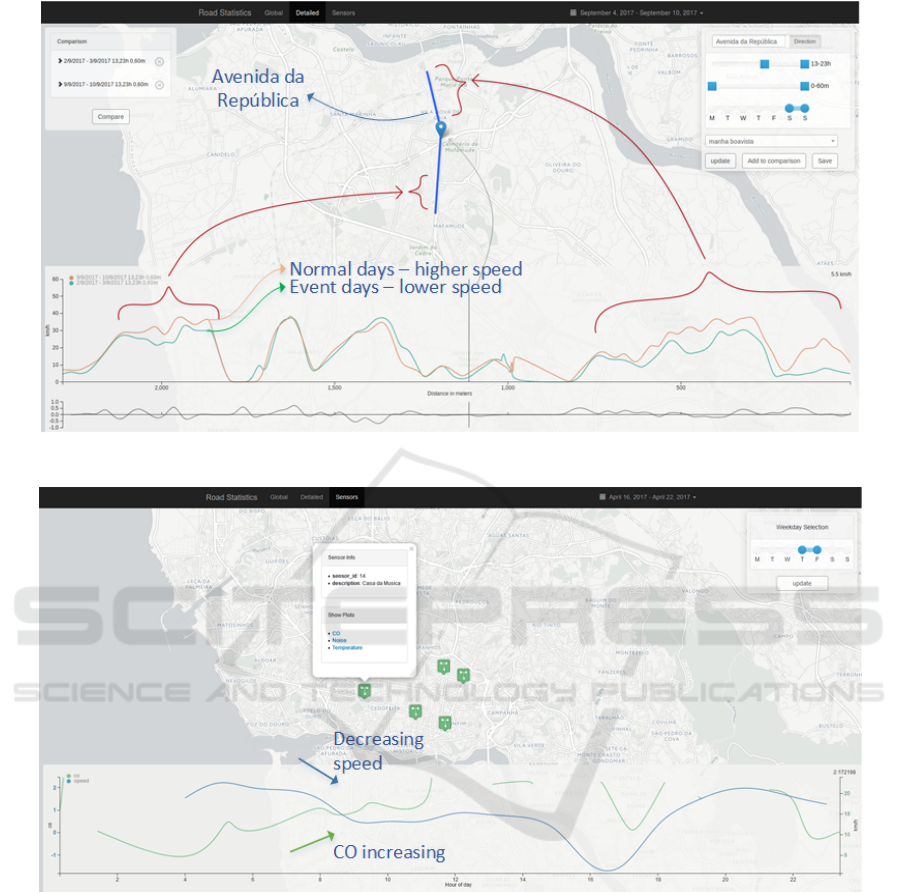
Figure 7: Comparison of a profile on a normal weekend vs an event weekend.
Figure 8: Correlation of speed of traffic vs CO values through the day.
accumulation of traffic near the event area, while the
remaining of the segment follows the normal behav-
ior. This is a good case study for a city manager to
analyze and make traffic changes at the beginning and
end of the segment when hosting similar events in the
area nearby. Something like divert the traffic to sec-
ondary roads or allow only public transportation to
drive on that road are choices that could be analyzed
by a city manager.
Combining environment information with traffic
data helps to make conclusions on how the traffic af-
fects the local environment and how the environment
affects the traffic. This feature is also present in the
dashboard. As figure 8 shows, the result of correlat-
ing the traffic and a pollution metric (carbon monox-
ide, CO) is something already expected: the traffic
speed affects the pollution index. In the beginning of
the day, the average speed of the buses is higher, and
the CO levels are low, but as the speed starts to get
lower, the CO level increases. From the results we
can also observe the hours of the day more affected in
the sensors area, motivating on making changes in the
traffic at certain hours of the day.
Decision Support Dashboard for Traffic and Environment Analysis of a Smart City
393

5 CONCLUSIONS
This paper proposed a system dashboard as a solu-
tion for abstracting decision makers / city stakehold-
ers from the actual city smart city infrastructure. The
dashboard provides the ability to visualize informa-
tion of the city traffic from local to city wide scale.
We consider that it can be a very useful tool for a city
manager, namely in supporting conclusions on how
the city is moving, improving it in a way to provide
better behavior of the traffic in the city.
The typical scenarios presented illustrate how the
proposed system can be useful to identify and lo-
cate anomalies and unexpected patterns on the roads.
However, the system still lacks an end-user valida-
tion, and the next steps include making it available.
For that reason, the next step already planned is to
make available to the city managers and bus company
for assessing its usefulness and gather their inputs. By
design the system is open to include more city related
variables and allow a multimodal approach to the city
namely correlating changes in sensors with specific
events / city behaviours. Future work also includes
the integration with machine learning to add the abil-
ity to predict and/or at least estimate the probability of
atypical events occurrence that may impact the city.
ACKNOWLEDGMENTS
This work was supported by the CMU-Portugal Pro-
gram through S2MovingCity: Sensing and Serving a
Moving City under Grant CMUPERI/TIC/0010/2014.
REFERENCES
Bacon, J., Bejan, A., and Beresford, A. (2011). Using Real-
Time Road Traffic Data to Evaluate Congestion. De-
pend. and Historic Computing, 6875:93–117.
Carli, R. and et al. (2015). Automated Evaluation of Ur-
ban Traffic Congestion Using Bus as a Probe. IEEE
International Conference on Automation Science and
Engineering (CASE).
Erdogan, S. and et al. (2008). Geographical information
systems aided traffic accident analysis system case
study: city of Afyonkarahisar. Accident Analysis and
Prevention, 40(1):174–181.
Hall, R. E., Bowerman, B., Braverman, J., Taylor, J., To-
dosow, H., and Von Wimmersperg, U. The Vision of
A Smart City.
Honda, T. (2016). TrailMarker. In Proceedings of the 2016
on SIGMOD’16 PhD Symposium - SIGMOD’16 PhD,
pages 22–26. ACM Press.
Kerminen, R. and et al. (2015). Analysing traffic fluency
from bus data. IET Intelligent Transport Systems,
9(6):566–572.
Li, B., Tao, S., and Dawson, R. (2002). Evaluation and
analysis of traffic noise from the main urban roads in
Beijing. Applied Acoustics, 63(10):1137–1142.
Lopes, D. and Sargento, S. (2014). Network mobility for ve-
hicular networks. In 2014 IEEE Symposium on Com-
puters and Communications (ISCC), pages 1–7. IEEE.
Merry, H. (2017). Population increase and the smart city -
Internet of Things blog.
Moody, D. L. and Kortink, M. A. R. (2000). From Enter-
prise Models to Dimensional Models: A Methodology
for Data Warehouse and Data Mart Design. pages 5–1.
Sinnott, R. (1984). Virtues of the Haversine. skytel, 68:158.
Provided by the SAO/NASA Astrophysics Data Sys-
tem.
Zhu, Y., Li, Z., and Zhu, H. (2012). A Compressive Sens-
ing Approach to Urban Traffic. Ieee Transactions on
Mobile Computing, pages 1–14.
VEHITS 2018 - 4th International Conference on Vehicle Technology and Intelligent Transport Systems
394
