
An Automated Approach to Mining and Visual Analytics of
Spatiotemporal Context from Online Media Articles
Bolelang Sibolla, Laing Lourens, Retief Lubbe and Mpheng Magome
Meraka Intsitute, Council for Scientific and Industrial Research, Meiring Naude Road, Brummeria, Pretoria, South Africa
Keywords: Text Classification, Location Extraction, Geospatial Visual Analytics, Machine Learning, Spatio-Temporal
Events.
Abstract: Traditionally spatio-temporally referenced event data was made available to geospatial applications through
structured data sources, including remote sensing, in-situ and ex-situ sensor observations. More recently,
with a growing appreciation of social media, web based news media and location based services, it is an
increasing trend that geo spatio-temporal context is being extracted from unstructured text or video data
sources. Analysts, on observation of a spatio-temporal phenomenon from these data sources, need to
understand, timeously, the event that is happening; its location and temporal existence, as well as finding
other related events, in order to successfully characterise the event. A holistic approach involves finding the
relevant information to the phenomena of interest and presenting it to the analyst in a way that can
effectively answer the “what, where, when and why” of a spatio-temporal event. This paper presents a data
mining based approach to automated extraction and classification of spatiotemporal context from online
media publications, and a visual analytics method for providing insights from unstructured web based media
documents. The results of the automated processing chain, which includes extraction and classification of
text data, show that the process can be automated successfully once significantly large data has been
accumulated.
1 INTRODUCTION
In the current age of the digital earth and big data,
apart from the fact that more sensors that provide
data are available, there has been a concurrent
proliferation of unstructured geospatial data content.
This data is available as web based formal media
documents or discussions on social media networks.
In general people have become more location and
time aware. Similarly analysts have become
interested in supplementing structured geospatial
data from remote sensing satellite sources and in-
situ/ ex-situ sensor observation networks with data
acquired from media. This has become a valuable
source of information as it provides a socioeconomic
perspective, which answers the following questions:
What is happening, where is it happening, when is it
happening and why is it happening?
The last question can be answered in two phases.
Firstly, by extraction of the context from the media
document; secondly, from an analysis of time based
trends and correlation with other phenomena that
occur within the same or overlapping temporal
extent.
In most cases this information is required as it
happens, whereas it is also important to perform
analysis on historic data in order to observe trends,
which can be used for preparedness going forward.
Visual Analytics plays a vital role in decision
support as it provides the user or stakeholder with
various tools for interrogating the data.
In order to provide this kind of decision support,
it is necessary while retrieving data from the web, to
ensure that it fits the topic description, to classify the
data such that it fits the expected analysis, and to
geocode the locations of interest in order to correlate
with other map based activities. This is an involved
process which has to be executed seamlessly and
automatically to ensure swift delivery of the desired
information.
The objective of this paper is thus to provide a
mechanism for automated, seamless extraction of
geo spatiotemporal contextual information from
unstructured web based news media publications.
The second objective is to provide a visual analytics
based solution to enhance and reveal structural
Sibolla, B., Lourens, L., Lubbe, R. and Magome, M.
An Automated Approach to Mining and Visual Analytics of Spatiotemporal Context from Online Media Articles.
DOI: 10.5220/0006699602110222
In Proceedings of the 4th International Conference on Geographical Information Systems Theory, Applications and Management (GISTAM 2018), pages 211-222
ISBN: 978-989-758-294-3
Copyright
c
2019 by SCITEPRESS – Science and Technology Publications, Lda. All rights reserved
211

patterns, in order to support a geographic
information, web based decision support application.
2 BACKGROUND AND RELATED
WORK
Context in information science is defined as “any
information that can be used to characterize or
improve the interpretation of an entity, which could
be a person, place or object” (Dey 2001; Robertson
and Horrocks, 2017). Zimmerman et al (2007)
review a number of context definitions with the
purpose of extending these definitions. Following
both Dey (2001) and Zimmerman et al (2007),
context can be described by five categories, namely:
individuality, activity, location, time, and relations.
This paper focuses on the location and time aspect to
define spatio-temporal context.
Substantial work has been done in the field of
knowledge discovery from unstructured text
documents. Tan (1999) provides a review of text
mining and aligns existing methods on whether they
serve the function of text refinement which
transform text into an intermediate format that can
then be ingested for further processing in order to
derive knowledge, or knowledge distillation that
deduces knowledge from text. In order to make
sense of text data, it is usually the case that the data
has to be classified into categories that can be further
analysed. Feldman and Sanger (2007) discuss
various existing algorithms and techniques for text
categorisation, clustering and information extraction.
In addition to classification, when deriving
spatiotemporal context from text documents, it is
important to derive temporal knowledge on the
occurrence of events. Mei and Zhai (2005) discuss
discovering temporal patterns from text with a time
stamp. More recent applications of deriving spatio-
temporal context from unstructured text are
presented by Mirrezaei et al (2016) and Berenbaum
et al (2016).
More directed to this research is geographic
information retrieval research which involves
extracting information about location from text
documents and ranking their relevance to the topic.
It also involves identifying place names within text
from publications, assessing and addressing
ambiguity in identified place names, ranking the
articles and grouping them based on thematic or
spatial similarities and developing user interfaces
that aid users in information discovery(Jones and
Purves, 2008; Robertson and Horrocks, 2017).
2.1 Related Work
This section discusses related work in the field of
text extraction from text documents. It is restricted
to methods that explicitly consider spatio-temporal
events and their chronological appearance and
relations. Extraction of locations from text as well as
methods for classification of articles by relevance to
topic are discussed.
2.1.1 Approaches to Spatio-Temporal
Context Extraction from Text
Generally in order to extract identified entities of
interest, such as locations, events, organisations or
people, from the text, a Named Entity Recognition
(NER) method is employed (Strotgen et al, 2010). A
description of NER and its origins in the context of
Natural Language Processing for the purpose of
deriving named entities from text is provided by
Nadeau and Sekine (2007). Chasin et al (2014),
provide a comprehensive review of the NER
methods of extracting words and phrases that
describe place names and locations from documents.
Chasin et al’s method, starts with extraction of
significant events from text, then they extract
temporal relations amongst the identified events.
This is followed by identifying and extracting named
entities in the text relating to the events of interest
also known as topics. The locations are then
geocoded to get the coordinates needed for
displaying the point on a map. They provide a map
display with timelines to show the chronological
occurrence of these events. Other methods for fusion
of spatial and temporal context extraction include
Strotgen et al (2010) and Robertson and Horrocks
(2017).
2.1.2 Location Extraction from Text
This section gives a brief review of NER methods
that have been used specifically for the extraction of
locations and place names from text. Lingad et al
(2013) compared the effectiveness of four different
Named Entity Recognition tools for extracting
locations using a dataset of 3200 tweets related to
natural disasters. They found that the Stanford parser
had the best out-of-the-box performance compared
to OpenNLP, TwitterNLP and Yahoo! Placemaker.
Gehring (2015) goes into great detail about the
challenges of location ambiguities as well as context
ambiguities. To address location ambiguity Gehring
proposes using the relationships between the
locations in a gazetteer to form a hierarchy, at the
top of which would be the most probable location.
GISTAM 2018 - 4th International Conference on Geographical Information Systems Theory, Applications and Management
212

This method would also address the issue of
locations that are often confused with people’s
names by NER tools, according to Gehring. Worth
noting is also the survey results of Gehring’s thesis
which show that people find a map accompanying a
news article to be vital to understanding the location
context.
In addition to the process of identifying location
context from articles, it is also important to identify
the topic which the document is reporting about. In
order to answer the question related to what is
happening and where it is happening. In Natural
Language processing, this is done primarily through
the process of topic modelling. Topic modelling is a
form of clustering and classification of documents
based on the concepts and topics embedded in its
text. Most notable methods for topic modelling
include: Latent Semantic Latent Semantic Indexing
(LSI), Mixture of unigrams model, Probabilistic
Latent Semantic Indexing (pLSI), Latent Dirichlet
Allocation (LDA) (Uys et al, 2008).
2.1.3 Relevance of Text to Topic by
Classification
Two major types of classifications are found in
literature namely binary classification and multiclass
classification. Binary classification divides items
into two groups and determines which group each of
the items is most suitable for. In this application
multi-class classification is discussed in relation to
topic modelling.
Binary Classification
When articles are first received it is necessary to
eliminate those that are not relevant to the subject
matter. This is done by using a binary classification
method with two classes relevant articles and
irrelevant. Well known machine learning methods
for binary classification specifically for text
documents include Simple Bayesian classifiers,
Decision trees, Neural Networks (McCallum and
Nigam, 1998; Li and Jain, 1998) and Support Vector
Machines which have been found to be the most
effective (Joachims, 1998) and are therefore used in
deriving the methodology for this study. The SVM
method, assigns newly acquired and pre-processed
articles a category based on a model that is built
from analysing a training set with data that has been
labeled to belong to the two categories.
Tong and Koller (2001), Manevitz and Yousef,
(2002) address the suitability of a one-class Support
Vector Machine (SVM) for the process of binary
classification. Manevitz and Yousef (2002) and
Tong and Koller (2001) made use of the term
frequency- inverse document frequency (tf-idf)
feature selection metric in their experiments and
found that the One-Class Support Vector Machine as
proposed by Scholkopf et al (1999) worked best
overall for document classification. They also found
that it was the more robust algorithm with respect to
classifying smaller categories.
Kubat and Matwin (1997), Liu et al (2003) and
Wang and Japkowicz (2010) all deal with inherent
class imbalance that arises when trying to find a few
articles of interest among all the articles on the web.
Kubat and Matwin (1997) in particular show why
the use of decision trees or k-Nearest Neighbour
(kNN) algorithms in such cases can give misleading
accuracy scores. Lui et al (2003) proposes a Biased
SVM method for learning from positive and
unlabeled examples. This method doesn’t require
any negative examples to be present in the training
set. SVMLight (Joachims, 2008) is another example
which allows for the adjustment of the parameters
associated with the positive and negative examples.
Wang and Japkowicz (2010) used a similar
approach, proposing an algorithm that boosts the
SVM by increasing the misclassification cost
making the parameter associated with the negative
classes a larger negative.
Multiclass Classification
Once the relevance of articles to the overarching
topic has been established, they can now be
categorised according to the sub themes. This is
done through the use of multi-class classifier
techniques. There are generally three types of multi-
class classification methods. These are: extensions
from binary classification methods, the second type
converts multi-classes into sets of binary classes in
order to use binary classification methods, and
finally hierarchical classification (Aly, 2005; Khan
et al, 2010; Mehra and Gupta, 2013).
One of the extensions from binary classification
is the extension of Naive Bayes by using Error-
Correcting Output Codes (Rennie, 2001). Song and
Roth (2014) propose a data less hierarchical data
classification method that requires no supervision or
pre labelling of data. Multiple improvements have
been made to the to the highly accurate SVM
techniques (Ramesh and Sathiaseelan, 2015).
In order to assess document clustering into one
class, a similarity analysis is undertaken. The well-
known methods are Euclidean distance, Manhattan
distance, Canberra distance metric, Cosine
similarity, Bray-Curtis similarity measure, Jaccard
coefficient among others (Lin and Jain, 2008).
Cosine Similarity is one of the most widely used
techniques. Ahlgren and Colliander (2009) give a
An Automated Approach to Mining and Visual Analytics of Spatiotemporal Context from Online Media Articles
213

comparison of five document similarity approaches
as well as a comparison of feature selection
techniques. Their experiment was conducted on both
article content as well as citation text. The results for
the content text on its own were better than the
combination of the text and the citation. Tf-idf gave
the best performance for the second order
similarities. Sachdeva and Kastore (2014)
conducted a survey of text similarity measures for
articles in both English and Hindi. They found that
the quality of the clustering depends on the
construction of the tf-idf matrix as well as the
similarity measure used. They also found that the
cosine similarity measure performed fairly well and
it was also better suited for the English language
articles. Cosine similarity was used in the
methodology for this paper based on successes
shown throughout literature for similar types of
cases.
One of the common issues that arise from multi
class classification is class imbalance. Boosting the
data set is another way of addressing the
aforementioned issue. Nonnemaker and Baird
(2009) looked at how safe it is to use synthetic data
to train a classifier. In this experiment, they used
convex interpolation to generate synthetic data for a
character recognition system. Overall, they found
that using interpolated data did not reduce the
accuracy of the classifier and frequently improved it.
Varga and Bunke (2004) conducted a similar
experiment for a handwriting recognition system and
found that synthetic data consistently improved the
accuracy when compared to the accuracy of just
using natural data. Kubat and Matwin (1997)
touches on the commonly used solutions for dealing
with class imbalance in a dataset. They suggest both
synthetically generated data and over-sampling as
ways to balance the classes. Chalwa et al (2002) go
further and suggest over-sampling the minority class
using synthetic data to the training set; they found
that this method worked better than over-sampling
with replacement. Fine et al (1998) gives an in-depth
look at the hidden Markov model (HMM) and its
applications. The model they developed builds a
multi-level structure for English text. Bahl et al
(1983) also gives a summary explanation for how
Markov source models are used to generate probable
texts based on a corpus (Jelinek, 1985).
2.1.4 Visual Analytics of Classified
Geospatio-Temporal News Articles
Geospatial Visual Analytics, a sub field of visual
analytics that focuses specifically with complexities
inherent in geospatial or spatio-temporal data, is
referenced in this paper as it provides background
into how to go about deriving relevant mechanisms
for visualising and interrogating the data in order to
get answers to the subject questions. Visual analytics
is the science of analytical reasoning supported by
interactive visual interfaces (Thomas and Cook
2006). The purpose of visual analytics is to give the
human the opportunity to interrogate the system by
interacting with the data in order to get insights into
the subject matter and enable decision making
(Keim et al, 2008).
An expected outcome of the system is to provide
a meaningful way to visual and synthesis the
resultant classified news articles in order to support
decision making. Several geospatial visual analytics
frame works have been proposed over time. The
choice of framework in this study was informed by:
the need to understand the data that will be
displayed, the need to provide different types of
related visualisations and interactions, and finally
the selection of appropriate visualisation symbology
and styling. News articles are a form of dynamic
data as new articles will be generated from time to
time, a framework that considers dynamic data, its
temporal existence as well as display style and
expected interactivity and analysis is thus considered
for developing visualisations in this study (Sibolla et
al, 2016).
3 SPATIOTEMPORAL CONTEXT
EXTRACTION AND VISUAL
ANALYSIS OF OCEANS AND
COASTS INFORMATION
The approach presented in this paper seeks to
provide a fully automated processing chain that
begins with discovery of news to providing
information insights derived from the news. Our
topic of interest is the South African marine
environment, including the oceans and coasts. The
system discovers relevant news from known local
media sources as well as any available sources
across the World Wide Web. The harvested news
articles are further tested for relevance in terms of
location and topic. The news that pass the relevance
test are further analysed, classified, stored in a
relational database and prepared for visualisation.
The visualisations present insights about predefined
questions relating to the incident occurrence,
location of incident, temporal aspects of the incident
and the cause of the incident.
GISTAM 2018 - 4th International Conference on Geographical Information Systems Theory, Applications and Management
214
3.1 Overall Architecture
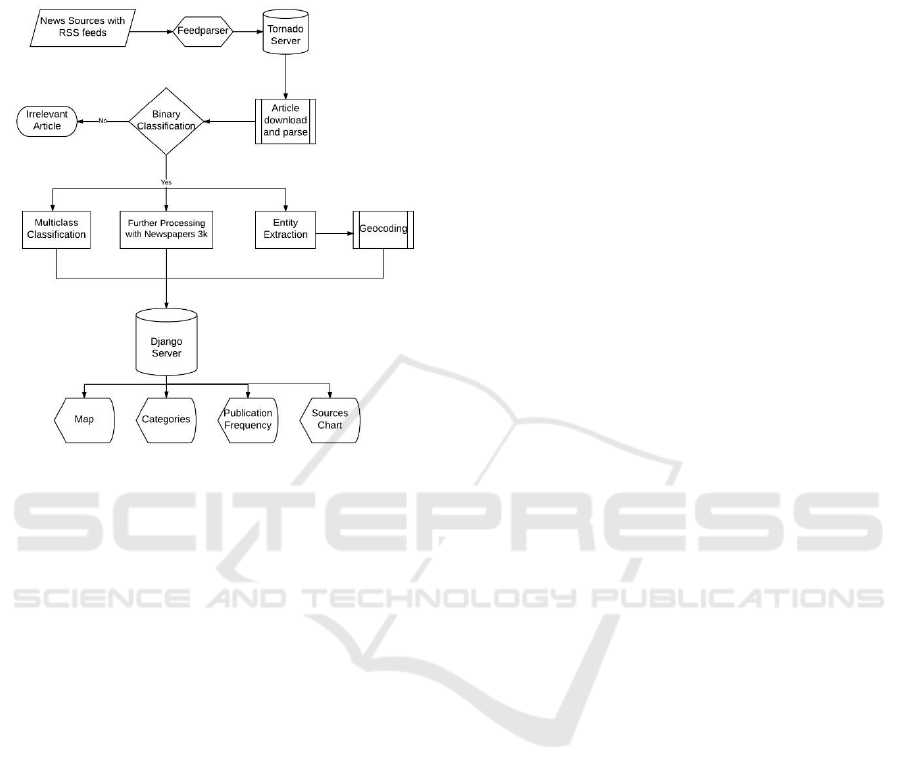
Figure 1 below describes the workflow of the
information processing chain.
Figure 1: Process flow.
The following sections will present the method
in more details followed by results achieved. The
paper will end with a discussion of the results and
future work to be done.
3.2 Data Sourcing
The initial sample dataset was a compiled CSV file
that showed all the required information about a
news events in order to address the problem
statement. The data in this file was later used to
derive the training dataset. The table was formatted
as seen in figure 2.
The sourcing of data was done through
information mining using a web scraper. The ideal
set of features of interest in each news articles were:
URL, publication date, harvest time, authors, title,
text, media (Images and videos), news source,
locations, people, and organizations. However, not
all features could be found for all articles. The
article URL, text and harvest time were guaranteed
to be populated for each article. The article URL
was used as an input that gives a reference to the
article being harvested. The text of the news article
was extracted from the body of the HTML page and
the harvest time was taken as a time stamp made
during the scraping process.
Within the scraper, the publish date, title and
authors have no generic way of being parsed,
although rules for parsing each website and its
elements can be created. This is a time consuming
process that also restricts one from dynamically
harvesting different news websites simultaneously.
The documents metadata fields that were extracted
from the HTTP Header, provide a means of
retrieving this “missing” information. Most online
news publishers do include these fields as they can
be fed in to RSS feeds. Extraction of other
supporting media elements related to the article such
as videos or photos was done using the relevant html
tags. These elements were not always found in all
news articles; hence they were treated as supporting,
optional data.
Incoming data was parsed using a Tornado web
server which is sufficient for maintaining multiple
long polling connections. The server was connected
by a WebSocket to the Django Postgres/PostGIS
database server. The server checks for new articles
based on the configured time interval and if new
data was found, the available information was
extracted from the headers. These headers are not in
a standard format, which warranted customised rule
based extraction of desired fields before parsing
them.
3.3 Data Ingestion
This section describes the point when a new article
is detected and how it is prepared for data analysis
based on machine learning. This level of pre-
processing is performed using the Newspapers 3K
python library.
The required input for this step is the URL for
the paper source. The article document is then
downloaded by Newspapers 3K. The purpose is to
deconstruct the article into component elements
namely: Article text, pictures, date of publication
which are all packaged into the processes output
object.
Newspapers3K also allows for configuration of
additional parameters when building a news source
such as the language of the source news documents.
The library saves processing time by caching the
results of the last news document retrieval session,
to avoid processing of duplicate articles.
3.4 Data Analysis
The parsed article text from the data ingestion step,
was categorised as either relevant or irrelevant to the
topic of coastal news. The relevant documents were
An Automated Approach to Mining and Visual Analytics of Spatiotemporal Context from Online Media Articles
215
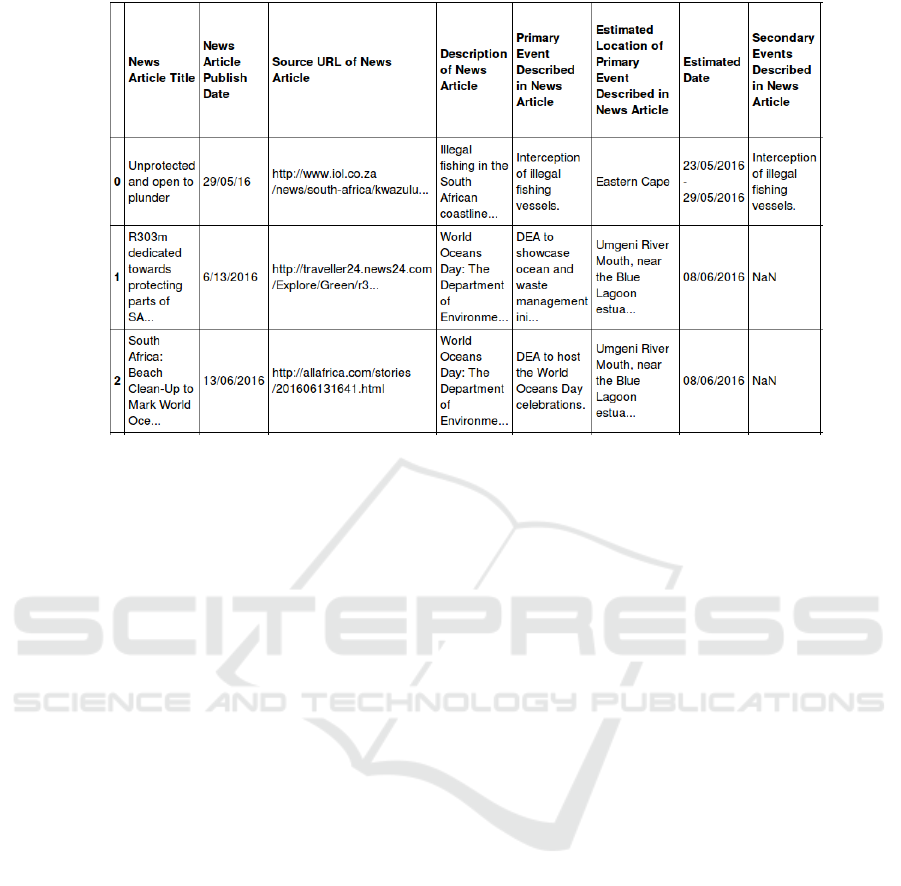
Figure 2: Structure of the data set.
then analysed using three concurrent methods in to
extract the information that was used for the visual
analysis. Firstly, the location is extracted using a
Named Entity Recognizer(NER); the coordinates
associated with the location names given by the
NER are found using geocoding, a method of
converting place names and addresses to geographic
coordinates. Secondly, the Natural Language
Processing (NLP) module Newspapers 3k is used to
create a summary of the article as well as provide
keywords. Finally, the text is put into one of the five
existing sub-categories which correspond to coastal
news themes.
3.4.1 Assessing Relevance of News to Topic
Assessing the relevance of the article to coastal news
was done by use of binary classification. The
classification of incoming articles as either coastal
news or not was done using a Support Vector
Machine (SVM) model. An SVM is a discriminant
classifier that separates classes by finding the
hyperplane that maximises the margin between the
different classes. In the case of binary classification,
the SVM would ideally find the hyperplane that
separates the word vectors of the text related to
coastal news from vectors of all other texts. Since
the goal was to separate one class of text from all
others that exist, a one class SVM was found to be a
better fit for this task than a cosine similarity
measure.
In order to potentially save time and computing
power, only the headlines of articles were used to
classify incoming articles as either related to coastal
news or not. The training set used consisted of an
equal number of positive samples about coastal
headline news and negative samples. The text of the
headlines were turned into word tokens using SK-
learn. The punctuation and stop words were
removed using the port stemmer, which also reduced
the derived words to their root. The word tokens that
were generated were then turned into word vectors
using the tf-idf feature selection method. These
word tokens were separated into two classes using
an SVM model from SK-learn trained on the
headlines from the training set. When this model
was tested on the unseen headlines in the testing set,
it accurately predicted the category to which the
headline belonged for 87% of the headlines.
An alternative method using IBM Watson online
resource was employed in order to verify the results
of our chosen method. This methods was used with
the same training and test sets. The training set
consisted of a comma-separated values (CSV) file
with the headline text in the first column and the
category it belonged to in the second column. The
CSV was then uploaded to the IBM Watson web
application where a model was trained on the given
data. To test the model, a second CSV consisting
only of the unlabelled headlines of the training set
was uploaded and the site returned its predictions.
Checking these against the labelled headlines of the
test set gave the much higher accuracy of 97%.
Having filtered out the irrelevant news articles,
the next step was to extract locations and
organisations. The primary entity to be extracted
GISTAM 2018 - 4th International Conference on Geographical Information Systems Theory, Applications and Management
216

was location with organisation being extracted as a
secondary entity. The text from the articles that were
classified as relevant was used as an input to the
Named Entity Extraction (NER) step.
3.4.2 Extraction of Location Context
The Stanford Named Entity Recognizer (NER) was
used in this case for the purpose of extracting
location names. The article’s headline and text were
put through the Stanford parser in order to tag parts
of speech in each sentence. The Stanford NER
Tagger was applied on tokenized words. The tagger
used in this case was a three class model for
“persons”, “locations” and “organisations”. Further
processing was done in order to extract noun chunks,
for example “Cape Town” needs to be recognised as
one entity rather than “Cape” and “Town” which are
two separate entities. This was facilitated by the use
of Beginning inside outside (BIO) tagging followed
by Natural Language (NL) tree generation. The noun
phrases were collected by joining the leaves in the
subtrees of this tree. The context decision tree was
as illustrated in figure 3.
Geocoding assisted in limiting the locations
given by the NER to those within the bounds of
South Africa. In some cases the Stanford NER gave
the prepositions associated with the location,
allowing for a better understanding of the context in
which the location was mentioned. In the cases
where this is possible, the location specifically
related to the event can be predicted more
accurately, otherwise, all the locations mentioned in
the article are taken to be relevant.
3.4.3 Pre Processing of Document Text and
Feature Selection
The Natural Language Processing (NLP) module
Newspapers 3k was used to create a summary of the
article as well as provide keywords. Further
processing of the text was also done using Sci-Kit
Learn.
Using Sci-Kit Learn’s Natural Language Toolkit
(NLTK) the article text was tokenized and the
tokens were normalized by removing all the
punctuation and stop words. According to Python
Newspaper documentation, known stop words
include words such as “the, is, at, which, and on”
(Ou-Yang, 2017). Additionally, the inflected and
derived words were reduced to their roots by suffix
stripping and stemming. This process was
alternatively performed using the Newspapers 3K
python library. The remaining word tokens were
then vectorised according to the tf-idf feature
selection method also using an SK-Learn module.
3.4.4 Allocation of News Articles to
Preassigned Categories
The final classification performed was to assign the
news article into one of the categories corresponding
to coastal news themes. Initially, the collection of
articles was manually divided into several sub-
categories. This was done to allow the user to filter
according to their specific interests, for example, a
user may only be interested in instances of the sea
level rising which could also indicate public
concern. One of the goals of the system is to
automate this sub-categorisation which was done by
using a multi-class classifier. The amount of articles
was not very large, therefore, in order to try and
adjust for the problems that are caused by the small
dataset, the initial 7 subcategories were reduced to 5,
allowing for more articles to be absorbed into the
categories with very few texts. Once the 5 categories
had been finalised, the articles were used to create 5
corpora that could be used to synthetically generate
more articles. The TF-IDF feature selection method
was once again employed before using the cosine
similarity measure to categorise the incoming
articles.
Term frequency (
) refers to the number of
times a specific term appears in a document, while
the Inverse Document Frequency is given by:
(1)
And the final feature selection is thus
3.4.5 Reduction of Classes and Clustering
Initially, the set of articles were classified by hand
into a number of appropriate topics based on the
judgement of the human classifier. These classes
were as listed in table 1.
The small size of the data set along with the
discrepancy in the number of articles across the
classes was a cause for concern when it came to
training the model. These problems were further
exacerbated by the fact that the text of 5 of the
original articles could no longer be accessed from
the article URL. In order to correct for the uneven
distribution of articles across the classes, articles
with overlapping topics were clustered together and
the number of classes reduced to five. The clustering
was performed with the help of a Latent Dirichlet
Allocation analysis and visualization.
An Automated Approach to Mining and Visual Analytics of Spatiotemporal Context from Online Media Articles
217
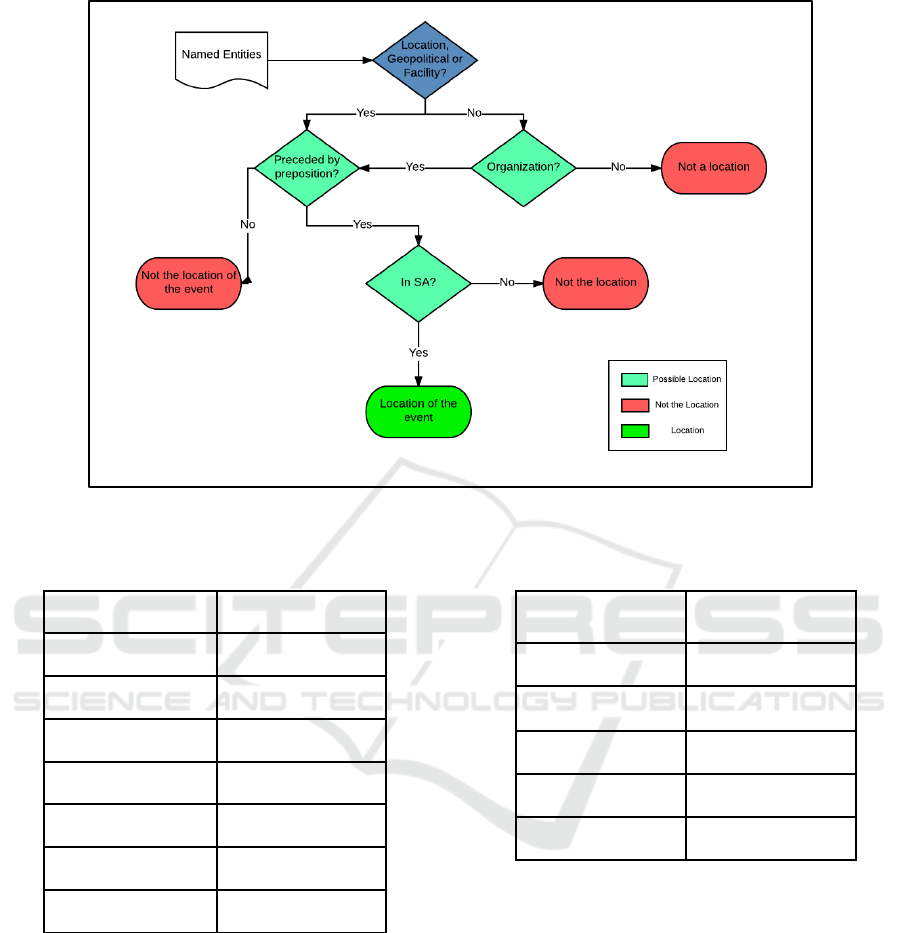
Figure 3: Decision tree for the context of extracted locations.
Table 1: Original Set of Categories.
Gensim was used to generate a corpus from the
text of the articles, along with a dictionary and
similarity index. pyLDAvis was then used to
visualise the topics. Based on the visible overlap
amongst topics and also using some human
supervision, the remaining five classes were as listed
in table 2.
Table 2: Revised Set of Categories.
3.4.6 Data Augmentation
Ideally the data set would be large enough to allow
for a subset of training set to be used for a more
thorough initial test of the classifier, this is what is
known as the the cross-validation set. In this case the
articles were only divided into a training set and a
test set as there were not enough articles to allow for
a cross-validation set, so that testing was only done
on the unseen data in the test set. The training set
consisted of thirty five of the original articles. The
reasoning behind this was that the category with the
smallest number of articles (waste) only had eleven
articles, so in order to make sure that there were a
few waste articles in the test set while keeping the
number of articles from each category in the training
Class
Number of articles
Illegal Fishing
32
Development
15
Red Tide
13
Waste
11
Natural Event
7
Sea Life
6
Public Concern
5
Class
Number of Articles
Illegal Fishing
32
Public Concern
15
Sea Life
13
Red Tide
13
Waste
11
GISTAM 2018 - 4th International Conference on Geographical Information Systems Theory, Applications and Management
218

set equal, seven original articles from each category
were added. For each category, twenty synthetic
articles were created using Markovify with a two
word seed. Each synthetic article had between ten
and fifteen sentences with a maximum sentence
overlap of seventy percent (70%). These synthetic
articles were added to the training set.
The articles chosen to form part of the training
set had their article text written to one of five “.txt”
files, each bearing the name of the article’s
classification. This means that the training set
consisted of five “.txt” files containing all the text
from the articles that were initially tagged.
The cosine similarity technique was used to
cluster and classify the documents into the five
classes.
3.4.7 Cosine Similarity
The same feature selection method was used for
each article in the test set. This set of word vectors
was then compared to the sets of word vectors in the
training set by measuring the scalar product of the
vectors between them. Dividing the result by the
product of the magnitudes of the vectors gave the
cosine of the angle between them and, by extension,
the cosine similarity. Mathematically, this is:
(2)
Where: a = article being evaluated and b = the
whole article corpus. The test articles were then
tagged with the name of the file that they had the
highest similarity to, which in this case, is also their
most probable category.
3.5 Storage of Relevant Data Records
Creating a database enables the data to be stored in
an organised way which then enables easy access by
the methods downstream from data ingestion. The
data stored in the database was a result of the
information derived from the scraper, augmented
with information that was extracted from the news
header file. Once an article has been accepted by the
binary classifier, the relevant information was stored
in a Postgres database, along with information
extracted from the news header file.
4 RESULTS
This section discusses results of the machine
learning based data classification process and the
visual analytics results as the major findings.
The visualisation of the five classes which arose
as a result of the reclassification of the articles from
the original seven classes was done using
pyLDAvis. The classes are distinct when modelled
according to their topics. This confirms that no
further clustering is required and these are the final
classes.
Due to the fact that the system had not
accumulated a lot of data, classification became a
challenge. In order to improve the accuracy of the
classifier, data amplification by adding synthetic
data was done. This is an acceptable method as
noted in the literature review. In order to ensure that
adding the synthetic data improved the accuracy of
the classifier a few tests were run with an increasing
number of synthetic articles added to the training set.
The table below shows how the accuracy increased
as a result, using cosine similarity.
Table 3: Effect of Generated Articles on Accuracy Score.
Added synthetic
articles
Accuracy Score
(%)
0
73.91
7
91.30
10
93.48
16
95.65
20
97.83
5 VISUALISATION OF
RESULTING DATA
The visualisation of data was done using three key
types of displays; the map is used to emphasise
spatial relationships, the graphs are meant to
highlight the temporal aspect of the data and show
possible trends. A bubble chart assigns distinct
colours to each news provider in order to
differentiate amongst the sources of news; this helps
the user identify the largest media contributor to
each topic. Colour and size, were used across all
display types in order to enhance the perception of
the categories and data variables. According to
Bertin’s retinal properties, the map graph primitives
individually did not provide an intuitive perception
of the data, therefore the map and graph views were
An Automated Approach to Mining and Visual Analytics of Spatiotemporal Context from Online Media Articles
219
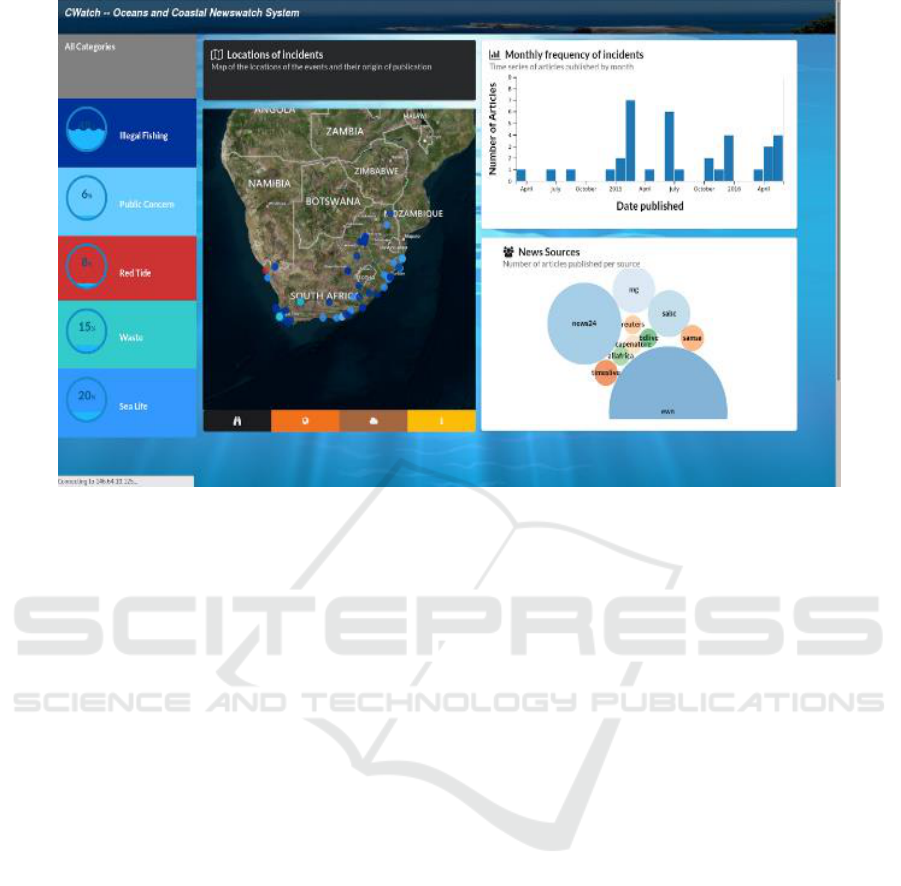
Figure 4: Visual Analytics presentation of the classified documents.
linked to enable focused analysis by the user such as
selection and filtering of data.
Every article that has an associated geolocation
is displayed as a point on an OpenLayers 3 map,
which forms the centrepiece of the application.
When one of these points is selected, additional
information is displayed on a panel next to the map
including the entities mentioned, keywords, an
article summary and a link to the full article. These
points are colour-coded by category and filters for
these categories are placed on the left navigation bar.
A time-series chart based on publication date
allows the user to get a sense of monthly frequency
of events and a bubble chart of news sources shows
us which outlets contributed the most to our corpus.
Both of these charts can be used as filters, and all
three filters in the application are linked to the same
state, a linked view effect is achieved between them.
Using the “red tide” category filter, we were able to
notice a seasonal trend in the reporting of the
phenomenon.
6 DISCUSSIONS
The purpose of this study was to provide an
automated approach to mining and intuitive
visualisation of spatiotemporal context from web
based text documents. The necessary steps towards
achieving this have been illustrated and discussed.
Procedure involves acquisition of media files, pre-
processing to the stem and removing suffixes,
extraction of named entities and classification. The
intuitive visualisation approach applied follows
methodologies for visual analytics of dynamic
(streaming) geospatial data.
Based on the method described in this paper,
automation of the process of deriving spatiotemporal
context from news media and developing intuitive
visualizations that support visual analytics was a
success. Along the South African coast a correlation
was found between a harmful algal bloom (red tide)
event detection which was performed using satellite
imagery, and news on rock lobster walkout in the
Western Cape seas that was reported in local
newspapers captured in the system. This was an
accepted as the news were validated by residents of
the area and the harmful algal bloom detection was
also validated through satellite imagery.
7 FUTURE WORK
The validation event has prompted a need to extend
the methodology for analysis of temporal and spatial
correlation of events reported in the news, as well as
correlation and fusion of news events with other
coinciding spatiotemporal detected events.
Apart from correlation analysis it is also
important to assess where the news that have been
GISTAM 2018 - 4th International Conference on Geographical Information Systems Theory, Applications and Management
220

reported portray a positive picture or whether they
are negative. As a result sentiment analysis will be
performed. Sentiment analysis also known as
opinion mining involves the process of extracting
emotion or attitude of the writer, in order to
determine if the written piece is positive, negative or
even neutral.
REFERENCES
Ahlgren, P. and Colliander, C., 2009. Document–
document similarity approaches and science mapping:
Experimental comparison of five approaches. Journal
of informetrics, 3(1), pp.49-63.
Aly, M., 2005. Survey on multiclass classification
methods. Neural Netw, 19.
Andrienko, N. and Andrienko, G., 2006. Exploratory
analysis of spatial and temporal data: a systematic
approach. Springer Science & Business Media.
Bahl, L.R., Jelinek, F. and Mercer, R.L., 1983. A
maximum likelihood approach to continuous speech
recognition. IEEE transactions on pattern analysis and
machine intelligence, (2), pp.179-190.
Berenbaum, D., Deighan, D., Marlow, T., Lee, A., Frickel,
S. and Howison, M., 2016. Mining Spatio-temporal
Data on Industrialization from Historical Registries.
arXiv preprint arXiv:1612.00992.
Chasin, R., Woodward, D., Witmer, J. and Kalita, J., 2013.
Extracting and displaying temporal and geospatial
entities from articles on historical events. The
Computer Journal, 57(3), pp.403-426.
Chawla, N.V., Bowyer, K.W., Hall, L.O. and Kegelmeyer,
W.P., 2002. SMOTE: synthetic minority over-
sampling technique. Journal of artificial intelligence
research, 16, pp.321-357.
Dey, A.K., 2001. Understanding and using context.
Personal and ubiquitous computing, 5(1), pp.4-7.
Feldman, R. and Sanger, J., 2007. The text mining
handbook: advanced approaches in analyzing
unstructured data. Cambridge university press.
Fine, S., Singer, Y. and Tishby, N., 1998. The hierarchical
hidden Markov model: Analysis and applications.
Machine learning, 32(1), pp.41-62.
Jelinek, F., 1985. Markov source modeling of text
generation. In The impact of processing techniques on
communications (pp. 569-591). Springer Netherlands.
Joachims, T., 1998. Text categorization with support
vector machines: Learning with many relevant
features. Machine learning: ECML-98, pp.137-142.
Jones, CB. Purves, RS. 2008. (eds). Geographic
information retrieval. International Journal of
Geographical Information Sciences. Vol. 22, No. 3,
pp 219-228.
Keim, D., Andrienko, G., Fekete, J.D., Gorg, C.,
Kohlhammer, J. and Melançon, G., 2008. Visual
analytics: Definition, process, and challenges. Lecture
notes in computer science, 4950, pp.154-176.
Khan, A., Baharudin, B., Lee, L.H. and Khan, K., 2010. A
review of machine learning algorithms for text-
documents classification. Journal of advances in
information technology, 1(1), pp.4-20.
Kubat, M. and Matwin, S., 1997, July. Addressing the
curse of imbalanced training sets: one-sided selection.
In ICML (Vol. 97, pp. 179-186).
Li, Y.H. and Jain, A.K., 1998. Classification of text
documents. The Computer Journal, 41(8), pp.537-546.
Liu, B., Dai, Y., Li, X., Lee, W.S. and Yu, P.S., 2003,
November. Building text classifiers using positive and
unlabeled examples. In Data Mining, 2003. ICDM
2003. Third IEEE International Conference on (pp.
179-186). IEEE.
Manevitz, L. M., and Yousef, M. 2002. One-class svms
for document classification. Journal of Machine
Learning Research 2 (March 2002), pp. 139-154.
McCallum, A. and Nigam, K., 1998, July. A comparison
of event models for naive bayes text classification. In
AAAI-98 workshop on learning for text categorization
(Vol. 752, pp. 41-48).
Mehra, N. and Gupta, S., 2013. Survey on multiclass
classification methods.International Journal of
Computer Science and Information Technologies,
Vol.4 (4), pp. 572- 576.
Mei, Q. and Zhai, C., 2005, August. Discovering
evolutionary theme patterns from text: an exploration
of temporal text mining. In Proceedings of the
eleventh ACM SIGKDD international conference on
Knowledge discovery in data mining (pp. 198-207).
Mirrezaei, S.I., Martins, B. and Cruz, I.F., 2016, October.
A distantly supervised method for extracting spatio-
temporal information from text. In Proceedings of the
24th ACM SIGSPATIAL International Conference on
Advances in Geographic Information Systems (p. 74).
Nadeau, D. and Sekine, S., 2007. A survey of named
entity recognition and classification. Lingvisticae
Investigationes, 30(1), pp.3-26.
Nonnemaker, J. and Baird, H.S., 2009. Using synthetic
data safely in classification. Bold, 2, p.76.
Ramesh, B. and Sathiaseelan, J.G.R., 2015. An advanced
multi class instance selection based support vector
machine for text classification. Procedia Computer
Science, 57, pp.1124-1130.
Řehůřek, R. and Sojka, P., 2010. Software Framework for
Topic Modelling with Large Corpora. Proceedings of
the LREC 2010 Workshop on New Challenges for
NLP Frameworks, Malta: ELRA (pp. 45 - 50).
Rennie, Jason D. M., 2001. Improving Multi-class Text
Classification with Naive Bayes. Master of Science.
Cambridge, Massachusetts, USA: Massachusetts
Institute of Technology.
Robertson, C. and Horrocks, K., 2017. Spatial Context
from Open and Online Processing (SCOOP):
Geographic, Temporal, and Thematic Analysis of
Online Information Sources. ISPRS International
Journal of Geo-Information, 6(7), p.193.
Song, Y. and Roth, D., 2014, July. On Dataless
Hierarchical Text Classification. In AAAI (Vol. 7).
An Automated Approach to Mining and Visual Analytics of Spatiotemporal Context from Online Media Articles
221

Sachdeva, S. and Kastore, B., 2014. Document clustering:
Similarity measures. Project Report, IIT Kanpur.
Schölkopf, B., Platt, J.C., Shawe-Taylor, J., Smola, A.J.
and Williamson, R.C., 2001. Estimating the support of
a high-dimensional distribution. Neural computation,
13(7), pp.1443-1471.
Sibolla, B.H., Van Zyl, T. and Coetzee, S., 2016. Towards
the development of a taxonomy for visualisation of
streamed geospatial data. ISPRS Annals of
Photogrammetry, Remote Sensing & Spatial
Information Sciences, 3(2).
Song, G., Ye, Y., Du, X., Huang, X. and Bie, S., 2014.
Short Text Classification: A Survey. Journal of
Multimedia, 9(5).
Strötgen, J., Gertz, M. and Popov, P., 2010, February.
Extraction and exploration of spatio-temporal
information in documents. In Proceedings of the 6th
Workshop on Geographic Information Retrieval (p.
16). ACM.
Tan, A.H., 1999, April. Text mining: The state of the art
and the challenges. In Proceedings of the PAKDD
1999 Workshop on Knowledge Discovery from
Advanced Databases (Vol. 8, pp. 65-70). Sn.
Thomas, J.J. & Cook, K.A. 2006, "A visual analytics
agenda", IEEE Computer Graphics and Applications,
vol. 26, no. 1, pp. 10-13.
Tong, S., Koller, D., 2001. Support Vector Machine
Active Learning with Applications to Text
Classification. Journal of Machine Learning Research
2: pp. 45-66.
Uys, J.W., Du Preez, N.D. and Uys, E.W., 2008, July.
Leveraging unstructured information using topic
modelling. In Management of Engineering &
Technology, 2008. PICMET 2008. Portland
International Conference on (pp. 955-961). IEEE.
Varga, T. and Bunke, H., 2004, October. Comparing
natural and synthetic training data for off-line cursive
handwriting recognition. In Frontiers in Handwriting
Recognition, 2004. IWFHR-9 2004. Ninth
International Workshop on (pp. 221-225). IEEE.
Wang, B.X. and Japkowicz, N., 2010. Boosting support
vector machines for imbalanced data sets. Knowledge
and Information Systems, 25(1), pp.1-20.
Zimmermann A., Lorenz A., and Oppermann R., 2007. An
Operational Definition of Context. In B. Kokinov et al.
(Eds.): CONTEXT 2007, LNAI 4635, pp. 558–571,
2007.
GISTAM 2018 - 4th International Conference on Geographical Information Systems Theory, Applications and Management
222
