
Blind Estimation of OFDM Sampling Frequency Offset and
Application to Power Line Communication in Aircrafts
Navish Lallbeeharry
1
, Rose Mazari
1
, Virginie Degardin
1
, Martine Lienard
1
and Christophe Trebosc
2
1
University of Lille, IEMN/Telice, Villeneuve d’Ascq, France
2
Safran Electrical and Power, R&T EWIS EURASIA, Toulouse, France
christophe.trebosc@safrangroup.com
Keywords: OFDM, Sampling Frequency Offset, Aircraft PLC Channels.
Abstract: Orthogonal Frequency Division Multiplexing (OFDM) is a widely used technique but its practical
implementation sometimes leads to issues related to the synchronization between the transmitter and the
receiver. The sampling frequency offset playing a major role in the degradation of the link performance,
various solutions have been proposed to cope with this effect. The objective of this paper is to present a
simple blind estimation of the offset, calculated on each OFDM symbol and thus only based on the received
data. A correction is then applied on the phase of the received signal. Synchronization of the receiver with a
phased-locked loop is not treated in this paper. After illustrating this approach for an additional white
Gaussian noise channel, a power line communication in an aircraft is envisaged. The architecture of the
network is described and a parametric study is carried out to assess the performance of the proposed offset
estimator and the phase correction technique.
1 INTRODUCTION
The need for reliable communications and electrical
networks monitoring has become a priority in
transportation systems. This is particularly critical in
the aeronautical sector with the emergence of the
“More Electrical Aircraft”, based on the replacement
of hydraulic and pneumatic energy by electrical
sources. To avoid a significant increase of the
number of cables and connections while keeping a
high reliability, a possible solution is to combine
data and power transmission by using a Powerline
Communication (PLC) technique. This approach can
of course be applied to any type of vehicles. Since
the electrical network is not designed as a
communication network, both the presence of
branches and the changes of the cable bundle
architecture along the structure lead to a multipath
propagation and thus to a highly frequency selective
channel. To overcome this problem, the PLC
physical layer is based on an OFDM modulation
technique also allowing a low receiver
implementation cost. This technique has matured
into a well established technology for wireless and
wired broadband delivery. It is used in the digital
video broadcasting (DVB), IEEE 802.11a, xDSL,
LTE and future 5G standards. The main drawback of
OFDM is that it is very sensitive to synchronization
offsets, such as Symbol Timing Offset (STO),
Carrier Frequency offset (CFO) and Sampling
Frequency Offset (SFO), this latter being due to a
sampling frequency mismatch between the
transmitter (Tx) and the receiver (Rx). The impact of
STO has been analyzed in the literature (Schmidl,
1997; Shi, 2004; Moose, 1994; Van de beek, 1997)
using pilot symbols or cyclic prefix, while
algorithms to estimate the CFO and STO are
presented in (Nogami, 1995, Nguyen, 2009, Kim,
2011). In (Cortes, 2006; Larhzaoui, 2014; Crussiere,
2004), sampling frequency errors for OFDM or
DMT systems have been analyzed and error
corrections are based on pilot symbols (Larhzaoui,
2014, Crussiere, 2004) or on complex equalization
schemes (Cortes, 2006).
Since SFO has a strong impact on PLC
performance, the objective of this paper is to present
a simple and efficient blind estimation of the
sampling offset based on phase rotation of each
subcarrier of the data symbols. It must be outlined
that only the phase of the input signals will be
corrected by applying the proposed approach. This
means that the effect of the inter channel
Lallbeeharry, N., Mazari, R., Degardin, V., Lienard, M. and Trebosc, C.
Blind Estimation of OFDM Sampling Frequency Offset and Application to Power Line Communication in Aircrafts.
DOI: 10.5220/0006697803570362
In Proceedings of the 4th International Conference on Vehicle Technology and Intelligent Transport Systems (VEHITS 2018), pages 357-362
ISBN: 978-989-758-293-6
Copyright
c
2019 by SCITEPRESS – Science and Technology Publications, Lda. All rights reserved
357

interference (ICI) is not suppressed. The method has
been applied to various PLC channels, representative
of a dedicated aircraft network, in order to assess its
performance, thus without ICI suppression, as a
function of the signal to noise ratio and the values of
the SFO.
The paper is organized as follows. In Section 2,
the principle of the method for estimating SFO is
first described and, to illustrate this approach, it is
applied to an Additional White Gaussian Noise
(AWGN) channel. Since PLC was identified as a
promising technique to gain weight and reliability in
transportation systems, the architecture of a possible
application in aircraft is recalled in Section 3.
Narrow band and wide band channel characteristics
deduced from numerical modeling based on the
multi conductor transmission line theory are also
given. For an OFDM-PLC link in such frequency
selective channels and assuming noise as an AWGN,
the performance of the SFO estimator is described in
Section 4.
2 PRINCIPLE OF THE
ESTIMATION METHOD
After describing the basic principles of the proposed
method, an illustration is given by considering the
simple case of an AWGN flat-fading channel.
2.1 Presentation of the Method
In presence of SFO, if the sampling frequency of the
Tx signal is F
s
, the Rx signal will be sampled at
(1+
ߝ
f
)F
s
with
s
f
F
fΔ
=
ε
(1)
If Ts and Ts' are the sampling periods with and
without SFO, the change
δ
t in the duration of each
symbol is N (Ts - Ts') with N the number of OFDM
subcarriers.
The proposed blind estimation process of
δ
t,
noted ε
est
, is deduced from data symbols and is
summarized in Fig. 1. At Rx, the cyclic prefix is
removed from the received data, the Fast Fourier
Transform (FFT) is performed, and zero forcing
equalization is done to obtain the frequency domain
symbols noted X'. Then, these symbols X' are QPSK
demapped and QPSK remapped to get a new symbol
X".
It is important to recall that to avoid the effects
of windowing on the spectral content of the signal,
the number of active subcarriers is smaller than the
total number of subcarriers, their corresponding
index n varying from Nmin to Nmax. Consequently,
the previous approach is only applied to these active
subcarriers.
Figure 1: Blind estimation process at the receiver.
The sampling error leads to a phase difference
Δ
φ
n
between each successive component X'
n
and X"
n
of X' and X" associated to the subcarrier index n.
Therefore, the phase exhibits a linear variation with
the subcarrier frequency f
n
and can be written as:
estnn
ff
ε
π
ϕ
2)( =
(2)
Such an expression allows a direct determination
of
ε
est
since it is proportional to the slope of the
curve
ϕ
(f
n
). Practically, the evaluation of
ϕ
(f
n
) is
subject to an error mainly due to the finite value of
the signal to noise (SNR) ratio. A linear least square
algorithm (Crussiere, 2014) is used and leads to:
=
=
Δ
Δ
=
max
min
max
min
²
2
1
N
Nn
N
Nn
n
est
fn
n
ϕ
π
ε
(3)
With ∆f the intercarrier space. This simple
algorithm is then applied to each received successive
symbol. The advantage of this approach is that
ε
est
is
deduced from all the active subcarriers, thus
minimizing the error in the estimation of its value.
The ratio
ε
est
/Ts can be put as the sum of an integer
part and a fractional part. The integer part
corresponds to the offset of the FFT time window
while the fractional part represents the sampling off-
set within the FFT window. Lastly, phase correction
on each subcarrier is made by applying (2).
As an illustration of this method, we consider the
case of a communication in an AWGN channel. The
parameters of the PLC OFDM link have been
chosen in accordance with previous works that we
have done in the aeronautic domain, taking into
VEHITS 2018 - 4th International Conference on Vehicle Technology and Intelligent Transport Systems
358
account constraints both on calculation time and on
latency (Larhzaoui, 2014). The number of
subcarriers is set to 512, equal to the FFT size and,
among them, 384 active subcarriers support data
transmission within the 4.6 – 32.7 MHz frequency
band. The sampling frequency is equal to 37.5 MHz
and a QPSK modulation is used.
2.2 Application to the Case of an
AWGN Channel
To illustrate the application of the method we
consider in this paragraph the case of a flat-fading
channel but in presence of AWGN. The sampling
error in the simulation is introduced owing to the
resample function available in Matlab software. In a
first example, we consider an offset of 10 ppm
giving rise to a shift of 1 sample at the 180
th
OFDM
symbol.
The SNR, expressed in terms of Eb/N
0
, where E
b
is the bit energy and N
0
the noise spectral density,
has been successively chosen equal to 10, 20 and 30
dB. Curves in Fig. 2 (a) and (b) give the variation of
ϕ
(n) thus as a function of the index of the
subcarrier, calculated for the 80
th
symbol and for
E
b
/N
0
equal to 30 and 10 dB respectively. The
regression lines associated with these curves have
also been plotted.
Figure 2: Phase variation versus the subcarrier index. (a)
E
b
/N
0
= 10 dB, (b) E
b
/N
0
= 30 dB.
From a purely qualitative point of view, we see
from these curves that, for an E
b
/N
0
of 10 dB,
important fluctuations of the estimated phase angle
appear. This mainly occurs in the lowest and highest
frequency part of the spectrum, due to the
windowing of the spectral component of the signal.
One can thus expect that this will lead to
uncertainties in the value of the slope of the
regression line and thus on the SFO.
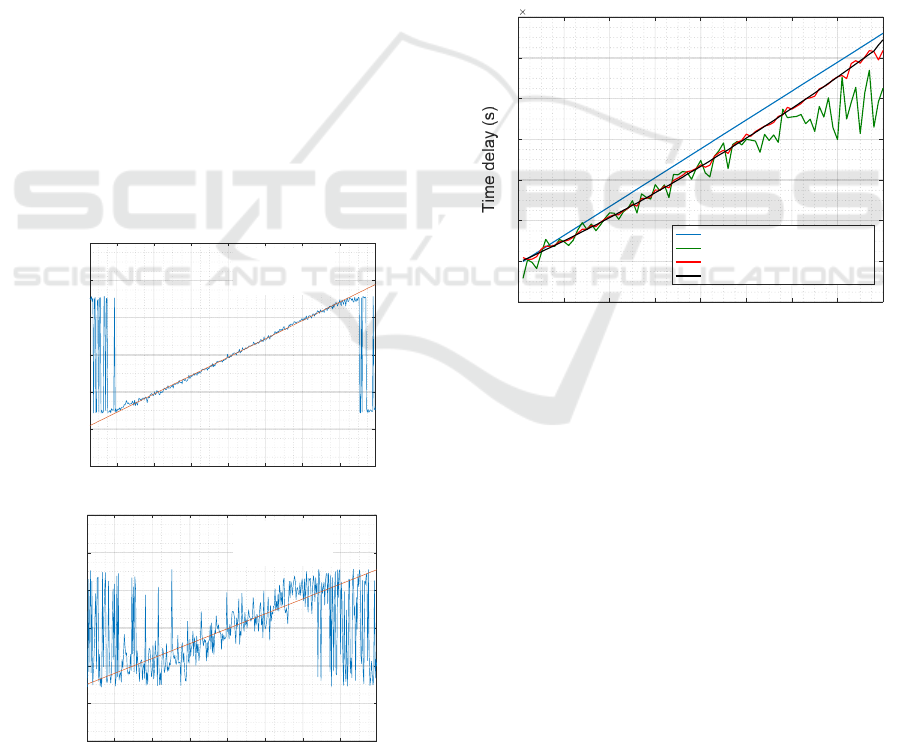
To emphasize this point, curves in Fig. 3 give the
variation of the time delays appearing on 80
successive symbols and deduced from the proposed
approach for E
b
/N
0
equal to 10, 20 and 30 dB. These
values can be compared to the exact value calculated
for an SFO of 10 ppm. When time increases the shift
in sampling time also increases and, for an SNR of
10 dB, this leads to significant errors beyond the 60
th
symbol.
Figure 3: Performance of the estimator with 10 ppm offset.
Lastly, the bit error rate (BER) versus E
b
/N
0
is
presented in Fig. 4 for the following cases: No SFO
(reference case) and in presence of an SFO without
correction or taking it into account by introducing
phase correction as previously explained. We see
that, without correction, BER tends to about 10
-3
for
high SNR. If a correction is introduced, a BER of
10
-4
is reached for an SNR of 10 dB with correction,
this value being quite comparable of the case of no
SFO (8 dB).
To point out the influence of the value of the
sampling frequency offset, curves in Fig. 5 have
been plotted for SFO = 1, 5 and 10 ppm. For 1 ppm,
BER with correction is nearly identical to the curve
in absence of SFO, errors increasing for 5 and 10
ppm.
100 150 200 250 300 350 400
Active Subcarrier index
-1.5
-1
-0.5
0
0.5
1
1.5
Angle (Rad)
100 150 200 250 300 350 400
Active Subcarrier index
-1.5
-1
-0.5
0
0.5
1
1.5
Angle (Rad)
0 1020304050607080
Symbol Number
-2
0
2
4
6
8
10
12
10
-9
Exact Values
Estimated Values with Eb/No = 10 dB
Estimated Values with Eb/No = 20 dB
Estimated Values with Eb/No = 30 dB
(a)
(b)
Blind Estimation of OFDM Sampling Frequency Offset and Application to Power Line Communication in Aircrafts
359
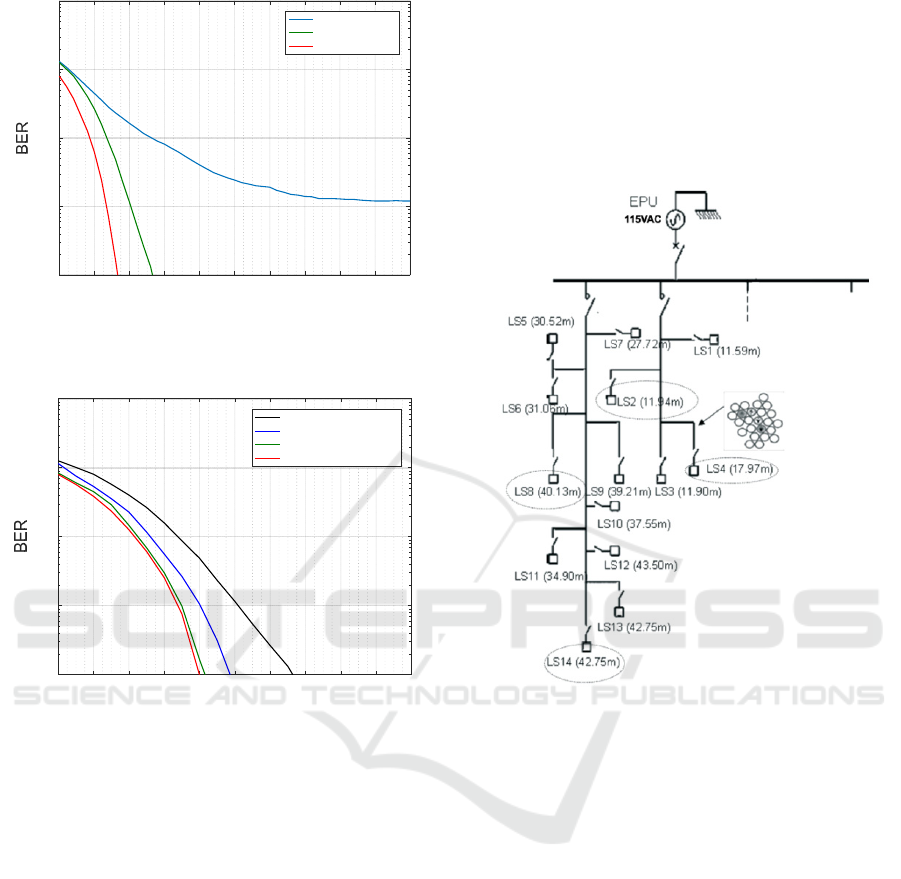
Figure 4: BER with and without correction and
comparison with the reference case (no SFO).
Figure 5: BER calculated in presence of an SFO equal to
1,5 and 10 ppm and comparison with the case of perfectly
synchronized clocks.
3 DESCRIPTION AND MAIN
CHARACTERISTICS OF A
REPRESENTATIVE NETWORK
OF AN AIRCRAFT
ENVIRONMENT
The chosen application deals with a system
combining lighting and data communication in the
cabin of an aircraft. In this network, the various
lights and display panels distributed inside the cabin
and noted LS, are powered by the electrical power
units (EPU). Since they must be remote controlled, a
PLC link seems to be an elegant solution to decrease
the number of cables and thus their total weight.
The architecture of a sub network is widely
described in (Degardin, 2013) and we briefly
recalled its main geometrical characteristics. As
shown in the schematic diagram in Fig 6, the EPU
feeds a "short" line and a "long" line in parallel. 4
LSs (LS1 to LS4) are connected to the short line and
10 LSs (LS5 to LS14) are connected to the long line.
The length of the PLC line, between the EPU and
each LS is also noted in Fig. 6. The number of wires
in each branch of the network is between 2 and 30.
Figure 6: Geometrical architecture of a sub network of a
cabin lighting system.
A numerical modeling based on a topological
approach of these multi conductor transmission
applied was applied to calculate the channel transfer
functions between each terminal and the channel
impulse responses. The 3 communication channels
chosen to illustrate the application of the SFO
estimation are the following: Channel 1 refers to the
link between EPU and LS2 (11.94 m long), channel
2 between EPU and LS4 (17.97 m) and lastly
channel 3 between EPU and LS8 (40.13 m).
Fig. 7 gives the insertion gain for these 3
channels, deduced from the numerical modeling, in
the [100 kHz-40 MHz] frequency band.
From the cumulative distribution of the path loss,
the attenuation presented by the channel is
calculated for a percentile of 0.5 (median value) or
of 0.9 to get an idea of the maximum attenuation
presented by the channel. This calculation has been
done on the active transmission bandwidth [4.6,
32.7] MHz, i.e. the bandwidth occupied by the
active subcarriers. Results are presented in Table 1.
0 5 10 15 20 25 30 35 40 45 50
Eb/No(dB)
10
-4
10
-3
10
-2
10
-1
10
0
Without Correction
With Correction
Reference
0 2 4 6 8 10 12 14 16 18 20
Eb/No (dB)
10
-4
10
-3
10
-2
10
-1
10
0
With Correction @ 10 ppm
With Correction @ 5 ppm
With Correction @ 1 ppm
Reference
VEHITS 2018 - 4th International Conference on Vehicle Technology and Intelligent Transport Systems
360
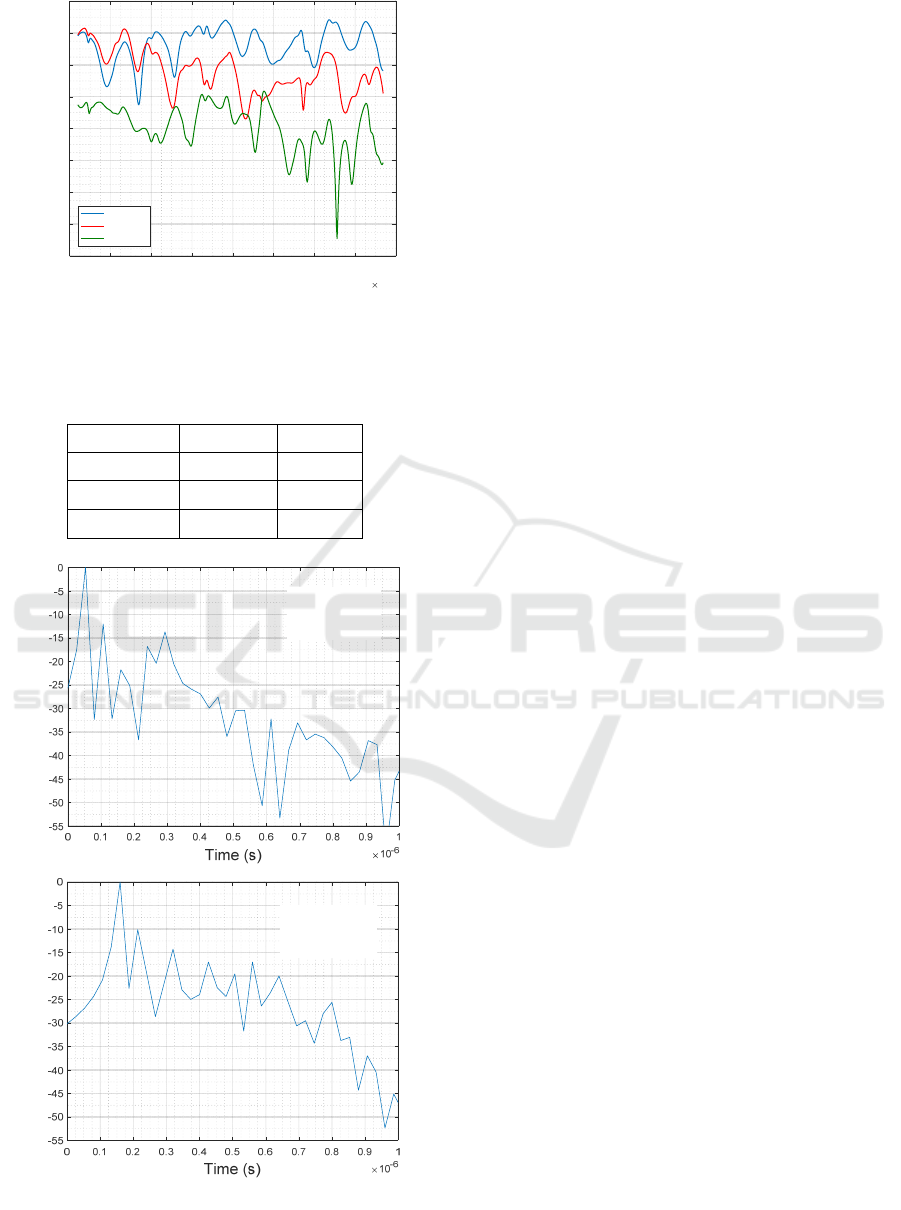
Figure 7: Insertion gain presented by the network for 3
different channels
Table 1: Path loss presented by different channels. Median
value (percentile of 0.5) and for a percentile of 0.9.
Percentile 0.5 0.9
Channel 1 11,4 dB 15,4 dB
Channel 2 16,1 dB 20,4 dB
Channel 3 24,1 dB 29,7 dB
Figure 8: Channel impulse response for channel 1 (curve
a) and 3 (curve (b), the highest peak being normalized to 0
dB.
Channel impulse responses, deduced from the
transfer function by applying a Fourier Transform,
are given in Fig. 8 for channels 1 and 3.
For a threshold of – 20 dB, these curves show
that the maximum delays are equal to 266 ns and
400 ns, for channels 1 and 3, respectively, while the
root mean square (rms) delay spread (ߪ
ఛ
), are equal
to 52 ns, and 73 ns. One can mention that, for this
application, the length of the cyclic prefix has been
chosen equal to 426 ns, i.e. 16 samples, in
accordance with the usual choice based on about 4
times the delay spread or greater than the maximum
delay of the channel impulse response
4 PERFORMANCE OF THE SFO
ESTIMATOR FOR A PLC LINK
IN AIRCRAFT
To point out the performance of the phase correction
algorithm, simulations have been done on the first
80 symbols where a FFT window shift is not needed.
In the simulation, equalization is assumed to be ideal
to focus only on the synchronization problem.
Equalization based on Zero forcing algorithm is
realized on the theoretical transfer function channel.
Curves in Fig. 9 give the BER as a function of
Eb/N0 at the injection point, i.e. at the transmitter.
We have chosen this approach rather than to plot
BER versus Eb/N0 at the receiver since in this case,
the signal to noise ratio is frequency dependent. In
Fig. 9 and 10 corresponding to channel 1 and
channel 3, respectively, the 3 curves refer to: i) the
ideal case with no SFO (noted “reference”), ii) in
presence of an SFO of 10 ppm without and with
phase correction. Let us recall that the median
attenuation in channel 1 is 11 dB and reaches 24 dB
in channel 3. We see in both cases that if the phase
rotation due to the SFO is not corrected, the
degradation of the BER is quite important, and BER
tends to an asymptotic value of about 10-3 for high
Eb/N0.
For Eb/N0 such as BER becomes smaller than
0.1, the reference curve and the curve in presence of
SFO but with phase correction, are nearly parallel,
the shift being about 2 dB. This small value shows
the good performance of the proposed correction
method and can be due to the ICI, which is not
corrected by our proposed method, but is introduced
in our simulation.
0 0.5 1 1.5 2 2.5 3 3.5 4
Frequenc
y
(
Hz
)
10
7
-45
-40
-35
-30
-25
-20
-15
-10
-
5
|S21| (dB)
Channel 1
Channel 2
Channel 3
Normalised Pdp (dB)
No
r
malised Pdp (dB)
(a)
(b)
Blind Estimation of OFDM Sampling Frequency Offset and Application to Power Line Communication in Aircrafts
361

Figure 9: BER with and without correction and
comparison with the reference case (no SFO) in the
aircraft PLC channel 1.
Figure 10: BER with and without correction and
comparison with the reference case (no SFO) in the
aircraft PLC channel 3.
5 CONCLUSIONS
A simple blind estimation technique to determine the
sampling frequency offset which may occur in an
OFDM link has been described. It allows correcting
the phase rotation of each OFDM subcarrier. This
approach has been applied to typical PLC channels,
the examples being based on the architecture of
representative power sub networks in aircraft.
Results have shown that the proposed approach is
quite effective. Indeed, in presence of an SFO of 10
ppm and to get the same BER as in the case of no
SFO the needed additional transmitting power is
only 2 dB.
ACKNOWLEDGEMENTS
This project is co-funded by the European Union
with the European regional development fund
"FEDER" and SAFRAN Electrical & Power.
REFERENCES
Schmidl, T.M., Cox, D.C., 1997, Robust frequency and
timing synchronization for OFDM, in IEEE
communication letters, vol 45, p 1613-1621.
Shi, K., Serpedin, E., Coarse , 2004, Frame and carrier
synchronization of OFDM systems: a new metric and
comparison”, in IEEE transaction on wireless
communications, vol3, p 1271-1284.
Moose, P.H., 1994, A technique for orthogonal frequency
division multiplexing frequency offset correction, in
IEEE transaction on communications, vol 42, p 2908-
2914.
Van De Beek, J.J., Sandell, M., Borjesson, P.O., 1997, ML
estimation of timing and frequency offset in OFDM
systems, in IEEE transaction on signal processing, vol
45, p 1800-1805.
Nogami, H., Nagashima, T., 1995, Frequency and timing
period acquisition technique for OFDM systems, in
Proc. Personal, Indoor and Mobile Radio
Communications (PIMRC), vol. 3, pp 1010-1015.
Nguyen-Le H., Le-Ngoc T., and Ko, C. C., 2009, RLS-
based joint estimation and tracking of channel respon-
se, sampling, and carrier frequency offsets for OFDM,
IEEE Trans. Broadcast., vol.55, no.1, pp.84–94.
Kim Y.-H., Lee J.-H., 2011, Joint maximum likelihood
estimation of carrier and sampling frequency offsets
for OFDM systems, IEEE Trans. Broadcast., vol. 57,
no. 2, pp. 277–283.
Cortes, J.A., Diez, L., Martos, E., Canete, F.J.,
Entrambasaguas, J.T, 2006, Analysis of timing
recovery for DMT systems over Indoor Power Line
Channels", in IEEE Globecom 2006, pp 1-6.
Larhzaoui T., Nouvel F., Baudais J.Y., Degaugue P. and
Dégardin V., 2014, OFDM PLC transmission for
aircraft flight control system", 18th IEEE International
Symposium on Power Line Communications and it's
Applications, pp 220-225.
Crussière, M., Baudais, J.Y., Hélard, J.F., 2004, New
Iterative and Frequency Synchronization Scheme for
MC-CDMA Systems over Power Line Channels", in
ISSSTA2004, Sydney, Australia.
Degardin V., Junqua I., Lienard M., Degauque P., Bertuol
S., 2013, Theoretical approach to the feasibility of
power-line communication in aircrafts, IEEE Trans.
Veh. Technol. , vol 62, pp 1362-1366.
0 5 10 15 20 25 30 35 40 45 50
Eb/No(dB)
10
-4
10
-3
10
-2
10
-1
10
0
BER
Without Correction
With Correction
Reference
0 5 10 15 20 25 30 35 40 45 50
Eb/No(dB)
10
-4
10
-3
10
-2
10
-1
10
0
Without Correction
With Correction
Reference
VEHITS 2018 - 4th International Conference on Vehicle Technology and Intelligent Transport Systems
362
