
Intelligent Thermal Control Method for Small-Size Air Conditioning
System
Hung-Wen Lin
1
, Min-Der Wu
1
, Guan-Wen Chen
1
and Ying Xuan Tan
2
1
Green Energy and Research Laboratories, Industrial Technology Research Institute, Hsinchu, Taiwan
2
Department of Mechanical Engineering, University of Malaya, Kuala Lumpur, Malaysia
Keywords: HVAC, Least Enthalpy Difference Theory, Energy Saving.
Abstract: To decrease the energy consumption and maintaining the comfort of the area, a great deal of work has been
done on HVAC control algorithms. A control system with the least enthalpy difference theory applied is
proposed in this paper. By using the indoor air temperature and relative humidity as the feedback of the control
system, the temperature set for the air conditioner is able to satisfy the indoor thermal comfort. The simulation
and experimental results of this controller have shown positive energy saving while maintaining indoor
thermal comfort.
1 INTRODUCTION
Due to the significant increase of energy consumption
in buildings, energy saving strategies have become
the first priority in energy policies in most countries
around the world. In 2006, United States of America
had used about 35% of the total energy for HVAC
systems (US EIA, 2017). About 50% of the world’s
total electrical energy is consumed by HVAC systems
(Fagan, Refai and Tachwali, 2007). However, most of
the medium-small commercial building is still using
small typed of HVAC control system.
Many approaches have been published by
researchers including the algorithms to control the
energy of HVAC systems. A classification of the
control systems named model predictive control
(MPC) were presented including classical control,
hard control, soft control, hybrid control and other
control techniques (Afram and Farrokh, 2014). The
research then focused on the comprehensive review
of MPC techniques and comparisons with other
control techniques. Generally, MPC provides
superior performance in terms of lower energy
consumption, better transient response, robustness to
disturbances and consistent performance under
varying conditions. An HVAC control strategies
which exploit the existence of a Wireless Sensor
Network (WSN) which is capable of distributing
temperature and zone occupancy information was
analyzed. The research focused on a technique called
“Adaptive Algorithm” which requires an additional
parameter which is the expected residence time of the
occupants for each zone to be controlled (Dimitris,
Evangelos, John and Odysseus, 2014). An
occupancy-based feedback control algorithm for
variable-air volume HVAC systems that is applicable
to the under-actuated case in which multiple rooms
share the same HVAC equipment was implemented.
Despite the inability to condition rooms
independently, comfort was found to be well
maintained and significant energy savings was
offered (Jonathan, Saket, Siddharth, Rahul and
Prabir, 2014).
In this paper, a method of using the least enthalpy
difference theory is proposed. Focusing on small
commercial buildings, experiments have been done to
apply the least enthalpy difference algorithm which
provides the optimal setting of the dry bulb
temperature and relative humidity for the air
conditioning system. With this, the intelligent sensing
control system with the theory applied is built to
obtain an energy saving algorithm.
2 METHODOLOGY
This study focused on reducing the energy
consumption of HVAC system of small commercial
buildings while maintaining the indoor comfort. The
least enthalpy difference theory is introduced and
64
Lin, H., Wu, M., Chen, G. and Tan, Y.
Intelligent Thermal Control Method for Small-Size Air Conditioning System.
DOI: 10.5220/0006690900640069
In Proceedings of the 7th International Conference on Smart Cities and Green ICT Systems (SMARTGREENS 2018), pages 64-69
ISBN: 978-989-758-292-9
Copyright
c
2019 by SCITEPRESS – Science and Technology Publications, Lda. All rights reserved
implemented into the HVAC control system.
Simulation and experiments are done to prove that the
controller based on this algorithm shows a better
result in energy saving and thermal comfort.
2.1 Theory
In this study, the least enthalpy difference theory is
used as the algorithm of the HVAC control system.
The algorithm uses the indoor air temperature and
relative humidity as the feedback of the control
system in order to maintain the indoor thermal
comfort. According to ASHRAE Standard 55-2010,
conditioned area with temperature and its relative
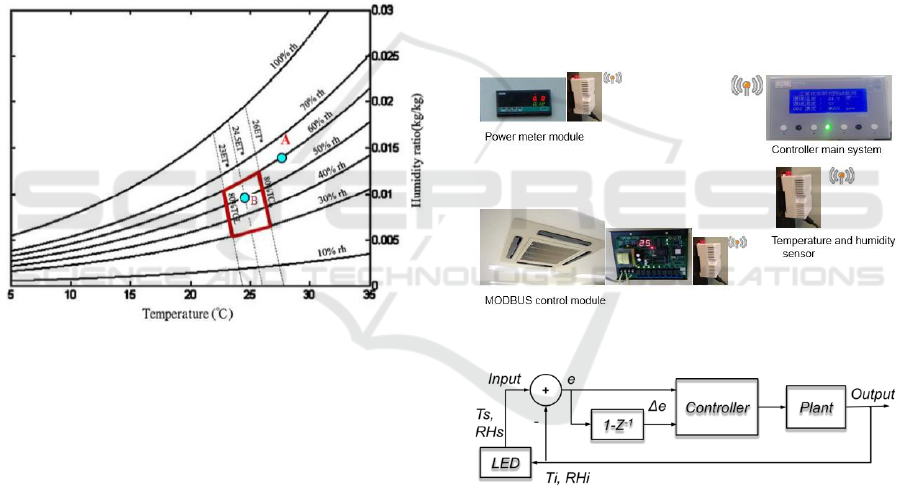
humidity within the comfort zone boundary as shown
in Figure 1 is defined as an area with 80% comfort.
The comfort zone is set between 23ET* to 26ET*
with a relative humidity ranging from 30% to 60%.
Figure 1: Psychrometric Chart.
According to the theory, if the measured
temperature and relative humidity is at the outside of
the comfort zone (point A) in the psychrometric chart,
the enthalpy of point A will be calculated. The control
system will then find a point B which is in the comfort
zone and has the closest enthalpy value as point A.
The temperature of point B will be set as the
temperature of the air conditioner. In order to achieve
this, 100 points are plotted in the comfort zone which
means that there will be point B
1
to point B
100
. Thus,
when the surrounding temperature and relative
humidity is measured as point A, one of the points B
will be selected as the temperature of the air
conditioner which is closest to point A.
2.2 Hardware Configuration
The control system includes a controller main system,
MODBUS control module, temperature and humidity
sensor and a power meter module. The main system
consists of a temperature sensor, humidity sensor and
CO
2
concentration sensor. There are also two sub-
systems where each of them consists of a temperature
sensor and a humidity sensor. The power meter
records the energy consumption of every system and
transfers the data to Cloud Smart Portal.
2.3 Simulation
Simulation has been carried out in the laboratory to
compare the energy saving effect of the least enthalpy
difference theory. Figure 3 shows the block diagram
of the control system where the LED is the controller
based on the theory. The original air conditioner
control system operates without inserting the LED.
The feedback of the whole control system is the
temperature and relative humidity measured from the
area. After passing through LED, there will be an
input temperature for the air conditioner which is the
temperature of point B as mentioned in Section 2.1.
Figure 2: Hardware configuration of the control system.
Figure 3: Block diagram of the controller.
From the simulation done, the difference in
temperature detected from the surrounding after
installing the LED can be observed. Figure 4 shows
the difference in surrounding temperature (T
i
) while
Figure 5 shows the temperature set for the air
conditioner by LED (T
s
).
When the LED is not in used, the T
s
is always set
at 24°C and it remains the same throughout the
operation time. When the LED is in used, the T
s
is
controlled according to the theory of the least
enthalpy where it ranges from 23°C to 26°C.
Intelligent Thermal Control Method for Small-Size Air Conditioning System
65
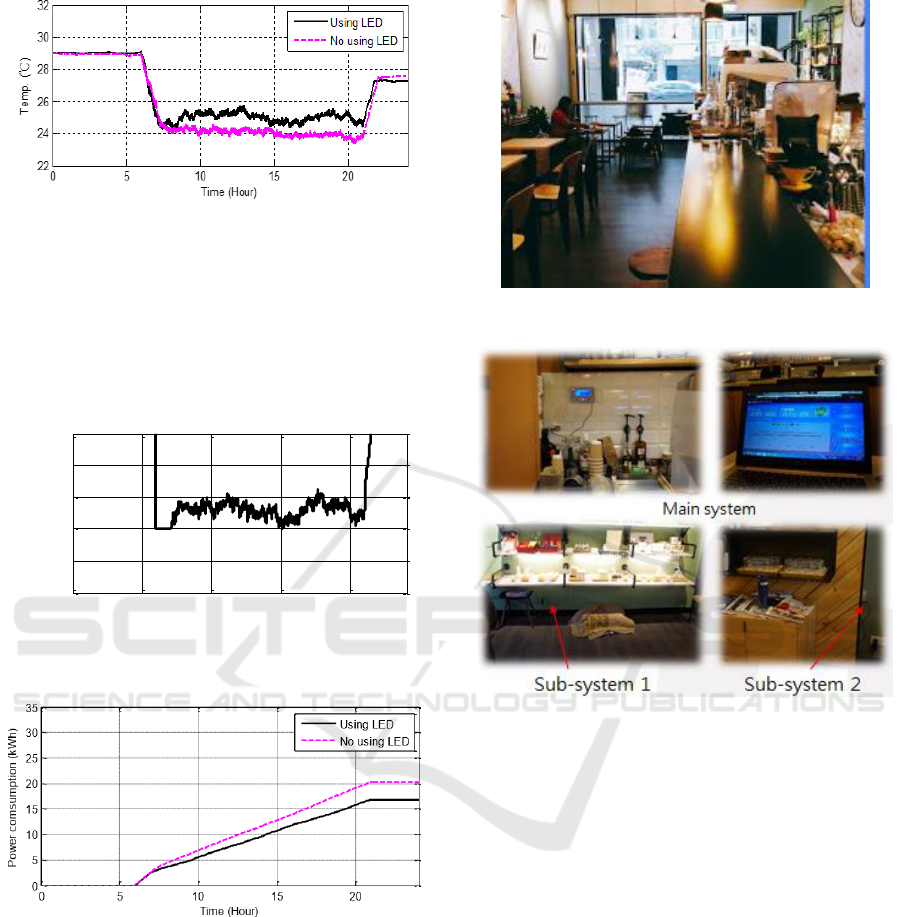
Figure 4: Difference in temperature with and without LED
(Ti).
From the result of the simulation, we can observe
a difference in energy consumption after installing the
control system. According to Figure 6, the control
system has shown a significant energy saving of
3kWh compared to the control system of the air
conditioner itself.
Figure 5: Setting temperature (Ts).
Figure 6: Difference in energy consumption.
2.4 Experiment
After obtaining positive results from the simulations,
experiments were performed in a coffee shop by
setting up the control system in the air conditioner of
the shop. Figure 7 shows the shop selected while
figure 8 shows the installation of the control system.
In the month of July, ten working days have been
selected as the experiment period. The operating hour
of the shop is from 7.30am to 7.30pm every day. The
area of the shop is about 59.5m
2
with a capacity of 3
workers and 20 customers.
Figure 7: Coffee shop selected for the experiment.
Figure 8: Control system in the shop.
Experiments 1 to 5 were carried out without using
the least enthalpy difference theory on 5
th
July, 7
th
July, 8
th
July, 11
th
July and 12
th
July. Thus, the
controller of the air conditioner itself was used. For
these five experiments, the controller set the
temperature of the air conditioner at 24°C without
obtaining the surrounding temperature and humidity
of the shop as feedback of the control system. The
energy consumption of the shop for these five days is
calculated and tabulated. Some other parameters such
as temperature, relative humidity and concentration
of carbon dioxide are also recorded.
As for experiments 6 to 10, they were done on 1
st
July, 4
th
July, 13
th
July, 17
th
July and 18
th
July with the
theory of least enthalpy difference applied. The
original control system of the air conditioner is
replaced with our control system. By using the theory,
the temperature of the air conditioner is set ranging
from 23°C to 26°C according to the surrounding
temperature and humidity. The energy consumption
and other parameters are also recorded.
0 5 10 15 20
22
23
24
25
26
27
Temperature (
℃ )
Time (hour)
SMARTGREENS 2018 - 7th International Conference on Smart Cities and Green ICT Systems
66
3 RESULT
3.1 Experimental Result
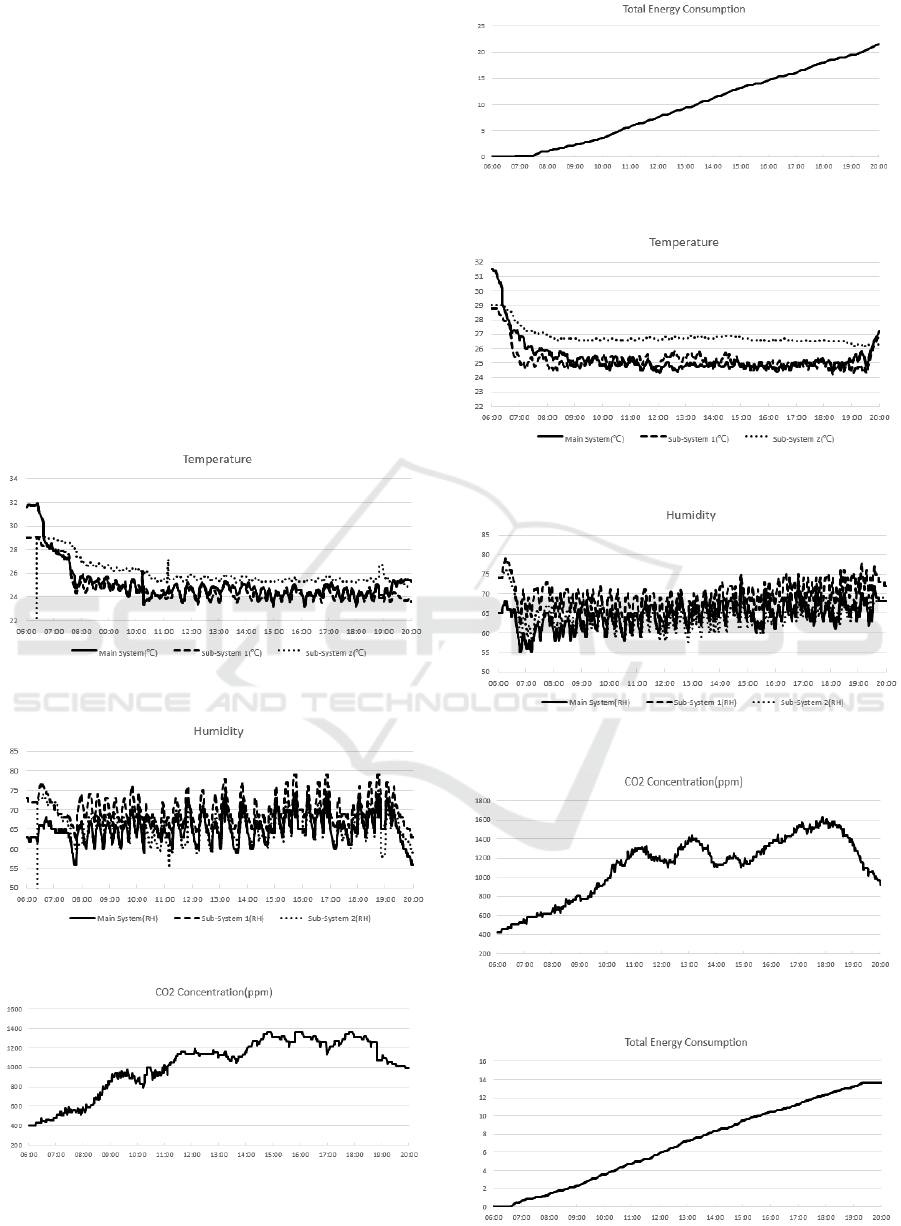
The data obtained from each of the experiment is
rearranged and graphs are plotted. Graphs plotted for
experiment 1 and experiment 6 are shown as
examples.
Figure 9 to 12 shown the parameters recorded for
experiment 1 (5/7) during the operation hour of the
coffee shop which is from 7.30am to 7.30pm. For
experiment 1, the least enthalpy difference theory is
not applied where LED is not in used.
Figure 13 to 16 shown the parameters recorded for
experiment 6 (1/7) during the operation hour of the
coffee shop. For experiment 6, the least enthalpy
difference theory is applied where the LED installed
is on. The average value of each parameter is obtained
and tabulated as shown below.
Figure 9: Temperature of experiment 1.
Figure 10: Humidity of experiment 1.
Figure 11: CO
2
concentration of experiment 1.
Figure 12: Total energy consumption of experiment 1.
Figure 13: Temperature of experiment 6.
Figure 14: Humidity of experiment 6.
Figure 15: CO
2
concentration of experiment 6.
Figure 16: Total energy consumption of experiment 6.
Intelligent Thermal Control Method for Small-Size Air Conditioning System
67

Table 1: Average temperature.
Experiment
Average Temperature (°C)
Main
System
Sub-
System 1
Sub-
System 2
1 (5/7)
25.14
24.80
25.31
2 (7/7)
25.35
24.49
25.84
3 (8/7)
24.97
24.37
26.18
4 (11/7)
25.31
24.62
26.33
5 (12/7)
25.23
24.65
25.23
6 (1/7)
25.37
25.21
26.81
7 (4/7)
25.35
25.08
25.38
8 (13/7)
25.15
24.71
26.36
9 (17/7)
25.35
25.27
27.13
10 (18/7)
25.28
24.96
26.58
Table 2: Average humidity.
Experiment
Average Humidity (RH)
Main
System
Sub-
System 1
Sub-
System 2
1 (5/7)
65.22
69.95
63.93
2 (7/7)
64.41
70.52
64.32
3 (8/7)
65.80
70.88
64.64
4 (11/7)
65.65
71.60
65.40
5 (12/7)
64.12
69.48
61.29
6 (1/7)
64.41
69.52
64.25
7 (4/7)
65.03
70.59
64.08
8 (13/7)
65.02
70.06
64.70
9 (17/7)
63.98
68.64
62.45
10 (18/7)
65.37
70.57
65.12
Table 3: CO
2
concentration.
Experiment
CO
2
Concentration (ppm)
1 (5/7)
1020.60
2 (7/7)
920.28
3 (8/7)
988.26
4 (11/7)
1131.44
5 (12/7)
1082.32
6 (1/7)
1108.41
7 (4/7)
1060.65
8 (13/7)
1006.44
9 (17/7)
1013.86
10 (18/7)
1047.72
Table 1 to table 3 show the average values of the
parameters that are recorded on the respective
experiment days during the operation hours. The
energy consumption of the experiments and the
energy saving effect of the controller are calculated
and tabulated as below:
Table 4: Energy consumption of experiment 1-5.
Experiment 1 – 5 (Without LED)
Date
Energy Consumption (kWh)
5/7
21.57
7/7
20.50
8/7
20.14
11/7
20.95
12/7
22.38
ΣkWh=105.54
Table 5: Energy consumption of experiment 6–10.
Experiment 6 – 10 (With LED)
Date
Energy Consumption (kWh)
1/7
13.62
4/7
18.65
13/7
18.65
17/7
13.61
18/7
18.49
ΣkWh=83.02
105.54 − 83.02
105.54
× 100% = 21.34%
As shown in the table, the application of the least
enthalpy difference theory has efficiently saved
21.34%.
3.2 Discussion
According to Section 3.1, the total energy
consumption of experiment 1 to 5 is 105.54 kWh
whereas the total energy consumption of experiment
6 to 10 is 83.02 kWh. From the result, we find out that
the control system has saved 22.52 kWh of energy
which is equivalent to 21.34% of energy saving.
By applying the least enthalpy difference theory,
the setting temperature of the air conditioner varies
from time to time according to the surrounding
temperature and relative humidity. With this, the
temperature set for the air conditioner ranges from
23°C to 26°C resulting in slightly higher surrounding
SMARTGREENS 2018 - 7th International Conference on Smart Cities and Green ICT Systems
68

temperature and with lesser fluctuations. Even though
the surrounding temperature is slightly higher, it is
still within the thermal comfort zone. When the
theory is not in used, the temperature of the
surrounding varies according to the amount of
customers (CO
2
concentration) which shows a greater
fluctuation. This shows that with the theory applied,
the temperature set for the air conditioner is more
stable and thus, consuming less energy and at the
same time, maintaining the comfort of the indoor
climate.
4 CONCLUSION
This research project has combined the thermal
comfort and the least enthalpy difference theory to
control the temperature of the air conditioner
according to the change in surrounding temperature
and relative humidity. Maintaining the thermal
comfort, the theory has successfully shown an energy
saving around 20%. In conclusion, the control system
with the least enthalpy difference theory applied has
efficiently reduced the energy consumption with the
thermal comfort maintained.
ACKNOWLEDGEMENTS
The authors would like to thank the Bureau of Energy
of the Ministry of Economic Affairs of Taiwan for
sponsoring this research work.
REFERENCES
U.S. Energy Information Administration (EIA), 2017.
https://www.eia.gov
Fagan J. E., Refai H., Tachwali Y., 2007. Minimizing HVAC
Energy Consumption Using a Wireless Sensor Network.
Industrial Electronics Society, IECON, The 33
rd
Annual
Conference of the IEEE, Taipei, Taiwan
Afram A., Farrokh J., 2014. Theory and Applications of
HVAC Control Systems – A review of Model Predictive
Control (MPC). Building and Environment, 72,
pp. 343-355.
Dimitris S., Evangelos Z., John S., Odysseus T., 2014.
Energy Control Algorithms for HVAC Systems.
International Energy Conference. Cavtat, Croatia.
Jonathan B., Saket K., Siddharth G., Rahul S., Prabir B.,
2015. Energy-Efficient Control of Under-Actuated
HVAC Zones in Commercial Buildings. Energy and
Building, Vol.93, pp. 160-168
ASHRAE. ANSI/ASHRAE Standard 55-2010, Thermal
Environmental Conditions for Human Occupancy,
American Society of Heating, Refrigerating and Air-
conditioning Engineer Inc,.
Intelligent Thermal Control Method for Small-Size Air Conditioning System
69
