
Large-scale Agent-based Multi-modal Modeling of Transportation
Networks
System Model and Preliminary Results
Ahmed Elbery
1
, Filip Devorak
2
, Jianhe Du
3
, Hesham A. Rakha
3
and Matthew Klenk
2
1
Department of Computer Science, Virginia Tech, Blacksburg, VA 24061, U.S.A.
2
Palo Alto Research Center (PARC), A Xerox Company, 3333 Coyote Hill Road, Palo Alto, CA 94304, U.S.A.
3
Virginia Tech Transportation Institute, 3500 Transportation Research Plaza, Blacksburg, VA 24061, U.S.A.
Keywords:
Large-scale Modeling, Agent-based Modeling, Multi-modal Systems.
Abstract:
The performance of urban transportation systems can be improved if travelers make better-informed decisi-
ons using advanced modeling techniques. However, modeling city-level transportation systems is challenging
not only because of the network scale but also because they encompass multiple transportation modes. This
paper introduces a novel simulation framework that efficiently supports large-scale agent-based multi-modal
transportation system modeling. The proposed framework utilizes both microscopic and mesoscopic modeling
techniques to take advantage of the strengths of each modeling approach. In order to increase the model sca-
lability, decrease the complexity and achieve a reasonable simulation speed, the proposed framework utilizes
parallel simulation through two partitioning techniques: spatial partitioning by separating the network geo-
graphically and vertical partitioning by separating the network by transportation mode for modes that interact
minimally. The proposed framework creates multi-modal plans for each trip and tracks the travelers trips on
a second-by-second basis across the different modes. We instantiate this framework in a system model of
Los Angeles (LA) supporting our study of the impact on transportation decisions over a 5 hour period of the
morning commute (7am-12pm). The results show that by modifying travel choices of only 10% of the trips a
significant reduction in traffic congestion is achievable that results in better traffic flow and lower travel times.
1 INTRODUCTION
The performance of transportation systems is a criti-
cal factor that affects the human standard of life. The
environmental impact of the transportation sector has
major effects on human health (Levy et al., 2010).
Traffic congestion not only increases fuel consump-
tion and emission levels, but also wastes traveler ti-
mes. Moreover, the congestion experienced by trave-
lers increases the stress and affects the individual so-
cial interactions (Boniface et al., 2015). As a result of
all these economic, social, psychological and health
impacts, the academic community has devoted sig-
nificant research efforts to improving transportation
system performance. While the majority of these stu-
dies use simulation (Osorio and Selvam, 2015), (Zehe
et al., 2015), (Zhang et al., 2017), there are signifi-
cant modeling challenges including scaling, calibra-
ting, and validation issues that impact the accuracy of
the results. In this paper, we present a novel agent-
based framework for modeling of large-scale trans-
portation systems. The presented framework supports
city-level networks with different modes of transpor-
tation (cars, buses, railways, walking, biking, and car-
pooling). The proposed framework utilizes both mi-
croscopic and mesoscopic simulation to leverage their
respective strengths of accuracy and scalability. The
framework spatially partitions the network enabling
distinct portions of the region to micro-simulated in
parallel, and vertically partitions the network into lay-
ers represented loosely interacting modes. In this
way, we can utilize the available processing resour-
ces either using single or multiple machines. The
framework is capable of tracking individual trave-
lers on a second-by-second basis from their origin to
their destination across transportation modes. To the
best of our knowledge, the proposed framework is the
first tool that supports an agent-based city-level trans-
portation system, combining both microscopic with
mesoscopic simulations, tracking individual travelers
and vehicles on a second-by-second basis, and sup-
porting multi-modal mobility. We instantiate this fra-
Elbery, A., Dvorak, F., Du, J., A. Rakha, H. and Klenk, M.
Large-scale Agent-based Multi-modal Modeling of Transportation Networks.
DOI: 10.5220/0006690301030112
In Proceedings of the 4th International Conference on Vehicle Technology and Intelligent Transport Systems (VEHITS 2018), pages 103-112
ISBN: 978-989-758-293-6
Copyright
c
2019 by SCITEPRESS – Science and Technology Publications, Lda. All rights reserved
103

mework into a system to study the impact of routing
on travel time and fuel consumption in the Greater
LA city from 7am to 12pm. In terms of the paper la-
yout, the paper first introduces the related literature.
Because of space limitations, the system is described
briefly. The section following the literature review
provides an overview of the system architecture, com-
ponents, and the high-level operations. Subsequently,
the last two sections demonstrate the case study on the
Greater LA network along with preliminary results.
2 PREVIOUS WORK
The benefits of modeling large-scale transportation
networks have attracted attention over the last three
decades. In 1997, the TRANSIMS simulation tool
(Nagel et al., 1996) was used to simulate the traf-
fic in large areas for traffic planning purposes. The
research work in (Nagel et al., 1996) uses discrete
space modeling for the traffic micro-simulation based
on the cellular automaton approach (White and Enge-
len, 1993), where the road is separated into cells (of
length 7.5 meters) which are either empty or occupied
by one car. It uses a simple algorithms for car follo-
wing and lane changing. The use of cellular automa-
ton makes this system fast, however, it cannot accu-
rately capture observed transportation phenomena in-
cluding car following, lane changing, and gap accep-
tance. In 2002, TRANSIMS was updated to better in-
clude the impact of the congestion on the system per-
formance and it was run on a parallel cluster for fifty
iterations to achieve better trip planning (Cetin et al.,
2002). TRANSIMS has been used to model the Swit-
zerland network in the morning peak hours using pa-
rallel computation (Raney et al., 2003), (Balmer et al.,
2004). Then, in 2012, TRANSIMS was used in (Zhao
and Sadek, 2012) to evaluate the performance of the
transportation network of the Buffalo-Niagara metro-
politan area during significant snow events. However,
the authors mentioned that extensive efforts are requi-
red to make the simulated network realistic in terms of
network configuration, lane connectivity, pocket lane
and signal locations. In (Guo et al., 2013) the same
modeler was used to evaluate the impact of dynamic
routing on the fuel consumption. Similar to TRAN-
SIMS, our proposed framework supports the paral-
lel computation either on multi-core or even multi-
ple machines. However, in TRANSIMS the defini-
tion of the microscopic simulation is limited to the
demand, that is, each trip is simulated individually
as an agent. But, the links and the mobility of the
vehicles on these links are modeled using a parallel
queuing approach (Cetin and Nagel, 2002). These
queuing models are inaccurate in estimating the link
travel time especially in congestion situations such as
the LA morning commute. Furthermore, it cannot
capture the accelerations/decelerations events of each
vehicle that have a significant impact on the fuel con-
sumption and emissions. In contrast to TRANSIMS,
the proposed framework uses continuous space mo-
del for the micro-simulation, which is the enabler to
capture the many of the mobility parameters. A hy-
brid traffic modeler was presented in (Burghout et al.,
2005), (Burghout and Wahlstedt, 2007), (Yang and
Morgan, 2006), (Balakrishna et al., 2009) to model
large-scale traffic networks. The hybrid modeler si-
mulates different network links with different fidelity
levels (microscopic, or mesoscopic levels), where mi-
croscopic simulation was applied to areas of specific
interest, while simulating a large surrounding network
in lesser detail with a mesoscopic model. In this way,
it can provide a customized performance and simula-
tion speed. In our proposed system, we also utilize
microscopic-mesoscopic hybrid modeling. However,
in our proposed model, we do not have this spatial
separation between the microscopic and mesoscopic
simulations. In the proposed system, links are as-
signed to the simulator based on their importance in
the network In (Ahn et al., 2012), (Ahn and Rakha,
2013), the authors used the INTEGRATION software
to fully microscopically model the dynamic routing
on the fuel consumption in the downtown Cleveland
and Columbus, Ohio, USA, in the case of different sy-
stem market penetration rates and congestion levels.
The network has about 3,000 links with a traffic de-
mand of 65,000 vehicles per hour during the morning
peak hour. Our proposed framework uses parallel IN-
TEGRATION instances enabling our system to cap-
ture the morning commute of 1.2M vehicles. In 2015,
the authors of (Zehe et al., 2015) proposed the Sca-
lable Electro-Mobility Simulation (SEMSim), an ar-
chitecture for a cloud-based platform, as a proof of
concept to use the cloud for simulation of large-scale
transportation systems. The authors used this model
to simulate the network of Singapore that has about
500,000 private owned vehicle. However, the mo-
del uses simple vehicle characteristics (e.g., kinema-
tic model) and driving behavior models. In contrast
(Zehe et al., 2015), our proposed framework is based
on mature models that have been validated against ob-
served transportation phenomena and supports travel
across different transportation modes. Compared to
the MATSIM (Balmer et al., 2009), which is conside-
red the state of the art in simulating large-scale trans-
portation system, our proposed model is not only an
agent-based simulation. In addition to that, it utilizes
a hybrid simulation approach, it is also capable of mi-
VEHITS 2018 - 4th International Conference on Vehicle Technology and Intelligent Transport Systems
104

croscopically simulating all the transportation aspects
including demand, mobility, traffic signals, and road
network aspects, as will be described in next section
3.
3 THE PROPOSED MODEL
In this paper, we redefine the state-of-the-art of mo-
deling and simulation of large-scale transportation sy-
stems by introducing a new framework that is capable
of modeling large city level transportation systems.
To achieve both the required accuracy and scalability,
the proposed model utilizes both microscopic and me-
soscopic modeling techniques. The microscopic si-
mulation defined in this paper includes all the aspects
of simulation: demand, mobility, and network. From
the demand perspective, our framework models each
individual vehicle as an agent in the network that in-
teracts with other vehicles as well as with the traffic
signals and road control signs. It also provides dyna-
mic demand modeling, that is, traffic demand changes
throughout the simulation. From the mobility stand-
point, the proposed framework tracks every indivi-
dual vehicle at a time resolution of deci-second (0.1
seconds). These features are gained basically from
the microscopic nature of the INTEGRATION traf-
fic simulator (Rakha et al., 2012) utilized in propo-
sed model. Based on this time resolution, it captu-
res all the driving events by using validated models
for car following, lane changing and gap acceptance.
The model also can simulate different stochastic mo-
bility phenomena such as stochasticity in speed cal-
culation, route selection and driver aggressiveness in
acceleration/deceleration events. From the network
standpoint, many network topological details such as
link control methods (stop sign, yield sign, and traf-
fic signals), lane striping, lane prohibition, and high
occupancy vehicles (HOV) lanes were modeled in this
framework. To the best of our knowledge, none of the
current traffic simulators support all these features for
large-scale networks. The proposed framework also
incorporates other simulators for the modeling of the
railway, pedestrian and biking travel modes in addi-
tion to buses and carpooling. However, the details of
these simulators are beyond the scope of this paper,
but will be described in more detail in separate papers.
An important advantage of the proposed framework
is its ability to track each trip on a second-by-second
basis across different modes. Because of the compu-
tational cost required for the above-mentioned simu-
lations, the proposed framework uses two partitioning
techniques: vertical and spatial. Vertical partitioning
combines mesoscopic and microscopic road vehicle
simulation along with mode specific simulations for
walking, biking, and trains. Spatial partitioning divi-
des the microscopic network into smaller geographic
regions. A simulation controller divides each trip into
sub-trips to be simulated in different processes and
monitors each sub-trip to ensure consistency. Before
describing the model, the following subsection gives
some definitions that will be used in the model.
3.1 Definitions
Global-network: The global road network includes
all the road links in the area of interest. Each link is
marked to be in either the micro-network, the meso-
network or the train and pedestrian networks.
Meso-network: The meso-network is the connected
subset of the links in the global-network that is simu-
lated mesoscopically.
Micro-network: The micro-network is the connected
subset of links in the global-network that is simulated
microscopically.
Sub-network: A sub-network is a spatial partition of
the micro-network. Sub-networks are simulated mi-
croscopically using INTEGRATION software.
Zones: Nodes that can act as an origin or destina-
tion of the traffic. To have a fully connected network,
each zone in the micro-network is mapped to a corre-
sponding zone in the meso-network. However, some
zones in the meso-network do not exist in the micro-
networks.
Interconnection Zones (IZones): Interconnection
zones are correspondences between zones in different
networks. For example, for the micro-meso network
connectivity, the zones exist in both micro and meso
networks are IZones.
Trip: A trip is a travelers planned path from origin
zone to destination zone in the global-network. A
single trip can go through multiple network layers
(multi-modal trips) and/or multiple sub-networks. For
example, in the trip shown in Figure 1, a person can
drive his/her car on the local road (in meso-network)
from his/her home to the main road. Then, he/she
continues driving on the main road in the micro-
network (where he/she travels through two micro sub-
networks). Then he/she parks his/her car and walks
(on the pedestrian network layer) to the nearest rai-
lway station (rail network) from which he/she takes
the train. Then he/she walks again to his/her work.
3.2 Vertical Partitioning
The main roads, the arterial roads and highways are
the most influential roadway segments of the city
transportation network. These roads can significantly
Large-scale Agent-based Multi-modal Modeling of Transportation Networks
105
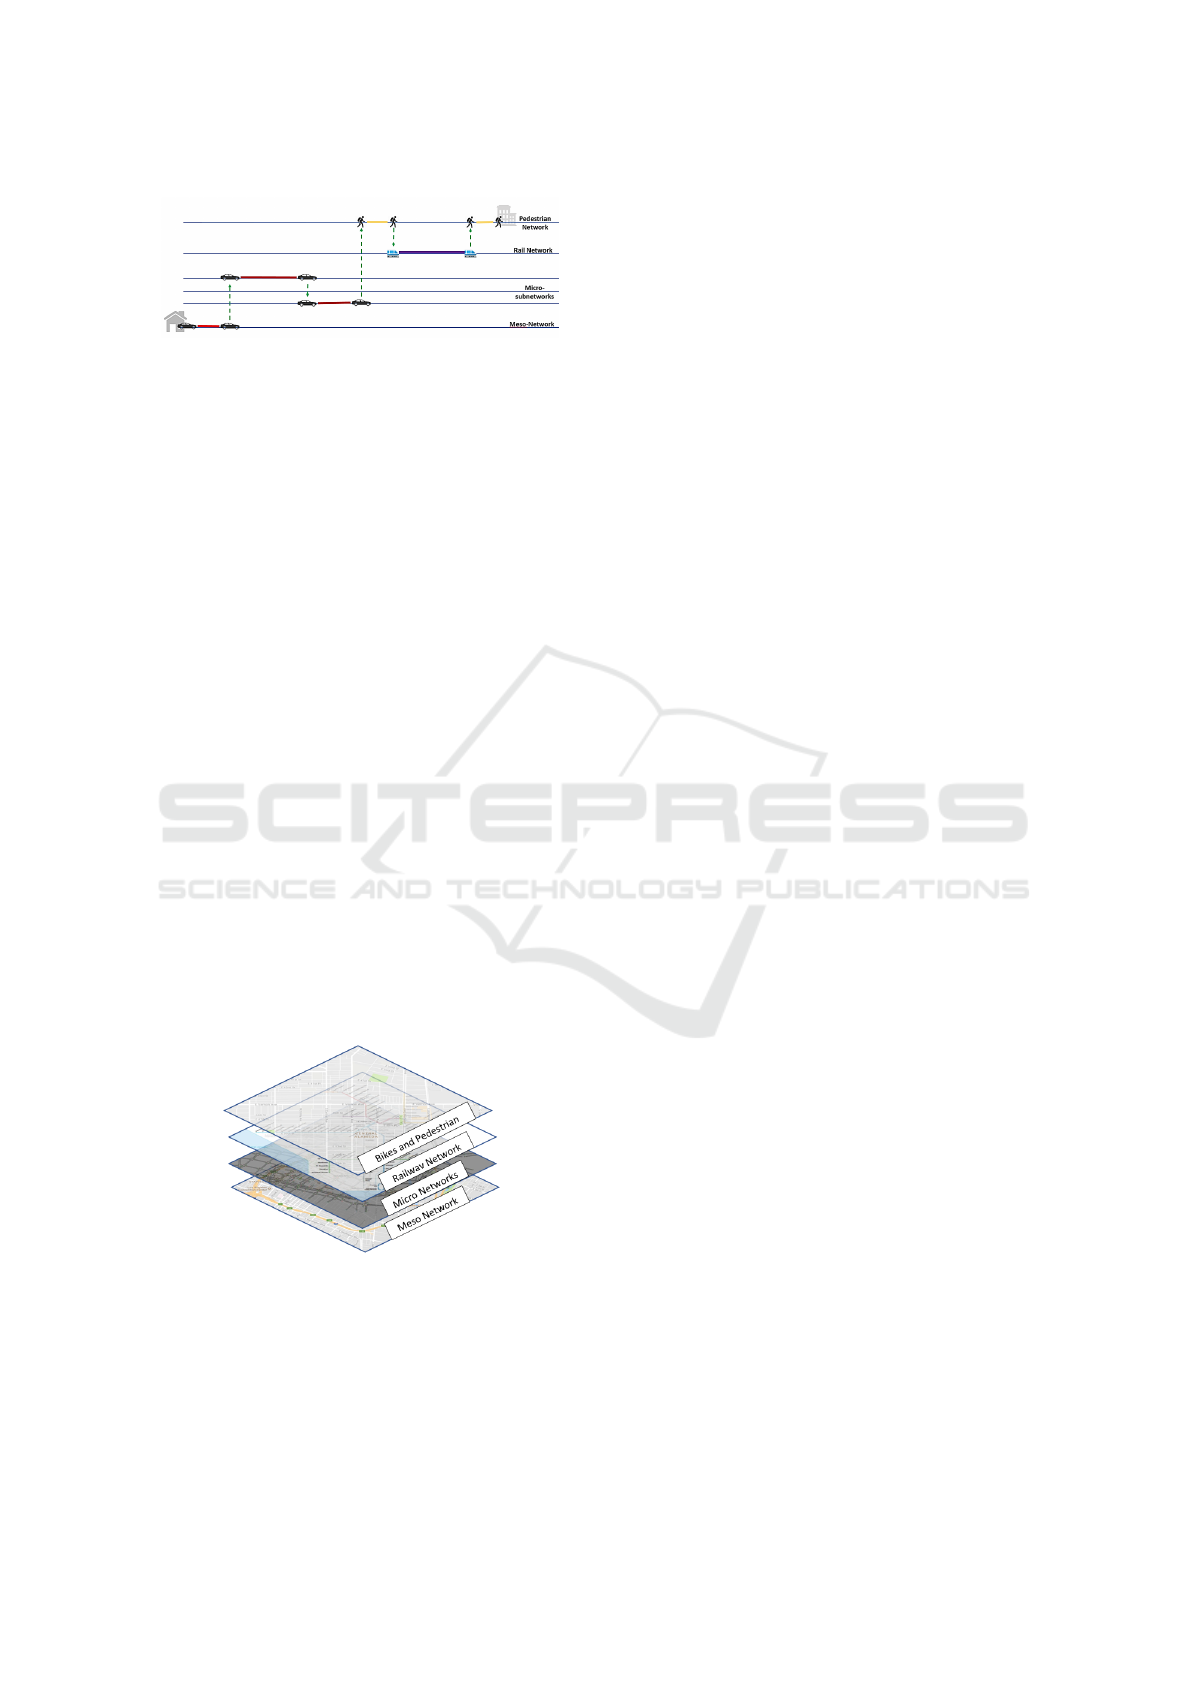
Figure 1: Multimode trip example.
affect the network performance. For example, conge-
stion on a main road can affect thousands of vehicles.
On the other hand, the local roads that connect the
main roads to residential areas are of low importance
because of their low traffic flow rates. However, we
cannot totally ignore these local roads because they
contribute to the travel time and fuel consumption of
the vehicles. In the proposed framework, the criti-
cal links (main roads, arterial roads, and highways)
are simulated microscopically which gives the hig-
hest possible fidelity for this portion of the network.
Alternatively, the local roads are modeled mesosco-
pically to capture their impacts while reducing the
modeling and computational requirements. Conse-
quently, the framework has two mandatory layers: the
meso-network and the micro-network layers. In addi-
tion, the framework supports layers for other transpor-
tation modes such as railways and pedestrians. Figure
2 demonstrates the layering concept. A traveler uses
more than one transportation mode means moving
him/her from one network to another, consequently
from one simulator to another. These interactions be-
tween different simulators are managed by a simula-
tion controller (SC). Simulations notify the SC when
a traveler finishes a sub-trip at an IZone. The SC finds
the next sub-trip for this traveler and sends him/her to
the appropriate simulator. The IZone must exist in the
next network to guarantee the connectivity of the trip.
Figure 2: Partitioning the network into different layers.
Based on the scale of the area of interest, the
micro-network can be divided into a set of sub-
networks. Each sub-network can run individually. In
this way, we can utilize the available resources, and
increase the simulation speed. There is a trade-off
between modeling speed and accuracy. The larger
the sub-network size, the slower the simulation speed,
but the higher the accuracy of the simulation results.
Within a subnetwork, the simulator models impacts
between all connected road links (e.g., spilling the
vehicles queue back from one link to its upstream
link, and the interactions between vehicles in the in-
tersection). Selecting the appropriate sub-network si-
zes depends on the total network size and the available
computational resources.
3.3 Traveler Types
In our framework, there are two types of travelers;
background and controlled.
Background Travelers: background travelers create
the network traffic conditions in each network, such
as congestion levels in the micro-network and meso-
networks; and vehicle loading on public transit vehi-
cles, etc. In the micro-network, INTEGRATION
tracks every individual traveler (both background and
controlled). In the other simulators, the travelers of
the background traffic are not tracked individually,
instead they are used to estimate the network state
(e.g., congestion levels, train loads) in order accura-
tely calculate the travel time and fuel consumption.
Controlled Travelers: Each controlled traveler repre-
sents a person traveling from an origin to destination
at a particular time. A planner creates a trip for each
controlled traveler and the simulation controller ensu-
res the traveler traverses the networks in the appro-
priate simulators. Each controlled trip is tracked on a
second-by-second basis in all the transportation mo-
des. Moreover, the controlled trip can be re-routed or
re-planned, while the person is traveling.
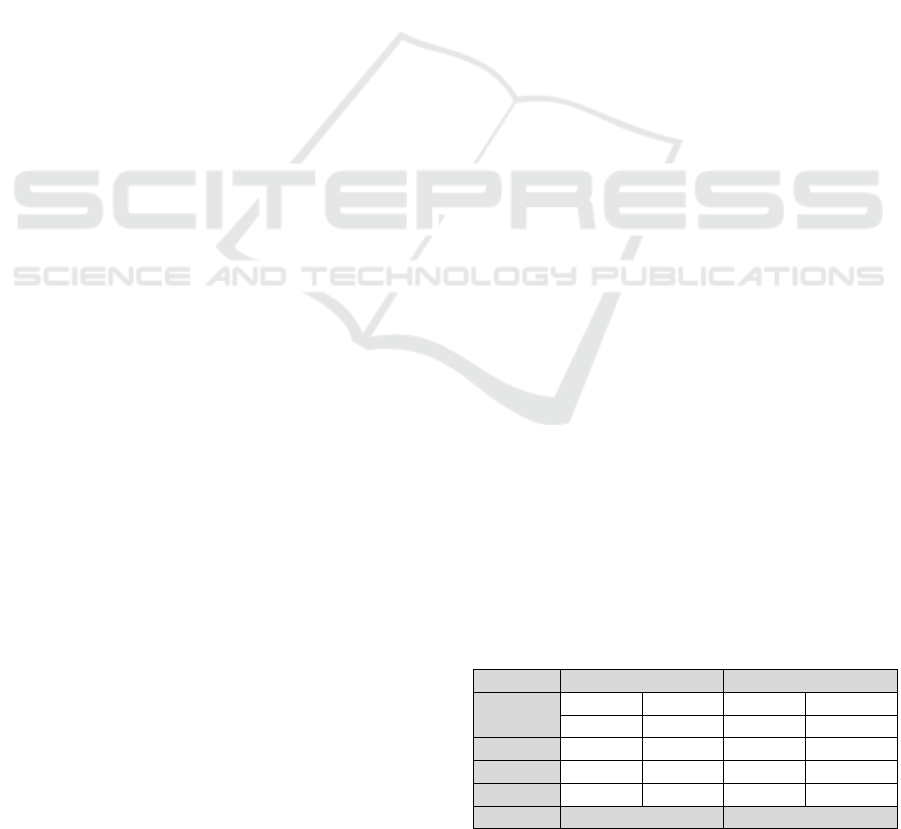
3.4 System Architecture and
Components
Figure 3 shows the general architecture of the pro-
posed framework. A basic idea is separating the sy-
stem software components from the hardware com-
ponents. The communication layer is the enabler to
transparently run this system on different infrastructu-
res with minimal configuration changes. The commu-
nication layer utilizes the RabbitMQ implementation
(Videla A., 2012) of the Advanced Message Queuing
Protocol (AMQP) (Fernandes et al., 2013). The exe-
cution layer of the system consists of two plans: (1)
the planning and simulation plan which is responsible
for simulating trips and creating the multimodal rou-
tes for the controlled trips (2) the control plan which is
responsible for controlling and managing the different
system components. The framework has the compo-
nents shown in in Figure 4. The input data repository
VEHITS 2018 - 4th International Conference on Vehicle Technology and Intelligent Transport Systems
106
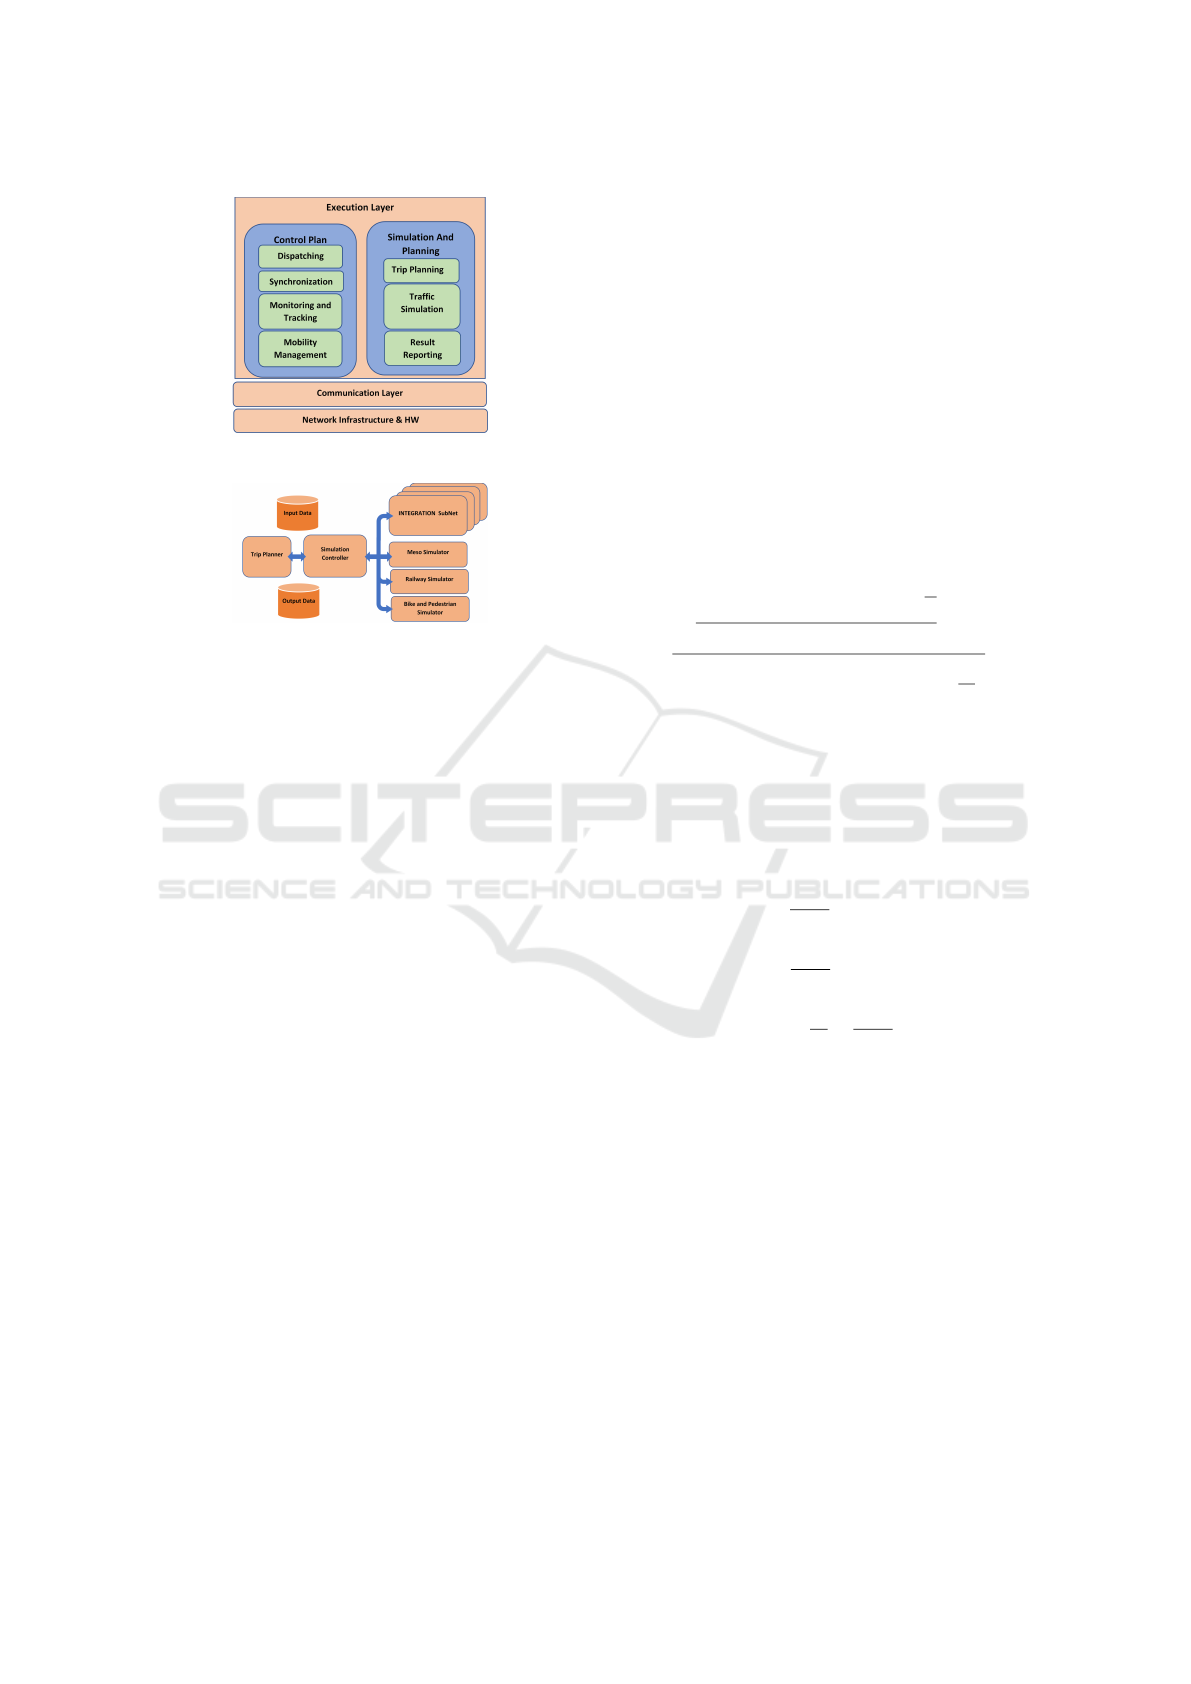
Figure 3: System architecture.
Figure 4: System components.
contains all the required input data to be used by the
system components. For example, the road maps for
both the meso-network, micro-network and the sub-
networks are stored in this database along with the
OD inputs that represent the traffic demand, transit
schedules, energy models and transit loading. The
SC manages the different simulations. When star-
ted, each simulation module imports the correspon-
ding input files from the input database then it initi-
alizes its environment and starts its internal synchro-
nization procedure that communicates to the SC. Due
to space limitation, we will give a brief overview of
the operation for only the basic components including
micro-simulator, meso-simulator, planner and the SC
focused on additions not reported in previous rese-
arch.
3.5 INTEGRATION and Micro-Models
Micro-simulation using INTEGRATION software is
the focus our framework. INTEGRATION is a
discrete-time continuous-space trip-based microsco-
pic traffic simulation and optimization model which is
capable of modeling networks with thousands of cars.
It is characterized by its accuracy that comes from its
microscopic nature and its small time granularity. IN-
TEGRATION provides 10 traffic assignment/routing
options with a full support of five vehicle classes, each
class has its own parameters and routing trees.
3.5.1 INTEGRATION Car Following Model
INTEGRATION updates the vehicle speed and lo-
cation every decisecond based on a user-specified
steady-state speed-spacing relationship along with the
speed differential between the subject vehicle and
the heading vehicle. INTEGRATION uses the vari-
able power vehicle dynamics model to estimate the
vehicle’s tractive force. Consequently, it implicitly
accounts for gear-shifting on vehicle acceleration,
which ensures a realistic estimation of the vehicle
acceleration. More specifically, the model compu-
tes the vehicle’s tractive effort, aerodynamic, rolling,
and grade-resistance forces, as described in details in
the literature (Rakha et al., 2001), (Rakha and Lucic,
2002). In INTEGRATION, the car-following model
computes the speedu
n
(t +t) of the following vehicle
(n) at the new time step t+t as (Rakha et al., 2012):
u
n
(t + ∆t) = min
(
u
n
(t) + a
n
(t)∆t ,
−c
1
+ c
3
u
f
+
¯
S
n
(t + ∆t) −
√
A
2c
3
,
s
u
(n−1)
(t + ∆t)
2
+ d
max
(
¯
S
n
(t + ∆t) −
1
k
j
)
)
(1)
where
A =
c
1
−c
3
u
f
¯s
n
(t + ∆t)
2
−4c
3
¯s
n
(t + ∆t)u
f
−c
1
u
f
−c
2
(2)
and c
1
,c
2
, and c
3
are the model constants which are
computed as:
c
1
=
u
f
k
j
u
2
c
(2u
c
−u
f
) (3)
c
2
=
u
f
k
j
u
2
c
(u
f
−u
c
)
2
(4)
c
3
=
1
q
c
−
u
f
k
j
u
2
c
(5)
and the vehicle ¯s
n
(t + ∆t)spacing is computed as:
¯s
n
(t + ∆t) = x
(n−1)
(t) −x
n
(t)+
u
(n−1)
(t) −u
n
(t)
∆t + 0.5a
(n−1)
(t + ∆t)∆t
2
(6)
Here a
n
(t) is the acceleration of the vehicle n; u
f
is the free-flow speed of the roadway; u
c
is the ro-
adway speed-at-capacity; q
c
is the roadway capacity;
k
j
is the roadway jam density; x
n
(t) and x
(n−1)
(t) are
the positions of the subject vehicle the lead vehicle at
time t; d
max
is the maximum acceptable deceleration
level (m/s
2
).
Large-scale Agent-based Multi-modal Modeling of Transportation Networks
107

3.5.2 Delay Computation
Within INTEGRATION, the delay D
l
n
experienced by
the vehicle n is computed for each traveled link l ,
as the difference between the vehicles simulated tra-
vel time and the free flow speed speed travel time for
this link (Dion et al., 2004). And the total delay D
n
experienced by the subject vehicles is computed as:
D
n
=
∑
(l ∈ the vehicle path)
D
l
n
=
∑
(l ∈ the vehicle path)
Z
t
l
1
t
l
0
(u
f
−
u(t)
u
f
)dt
(7)
where t
l
0
and t
l
1
are the times at which the vehicle en-
ters and exits the link l respectively.
3.5.3 Fuel Consumption and Emissions
Computing the fuel consumption and emission levels
is important to capture the travel costs and environ-
mental effects of transportation decisions. The IN-
TEGRATION software is capable of computing the
second-by-second fuel consumed; vehicle emissions
of carbon dioxide (CO2); carbon monoxide (CO);
hydrocarbons (HC); oxides of nitrogen (NOx); and
particulate matter (PM). The micro-simulator uses the
VT-Micro model (Rakha et al., 2004) to calculate
the second-by-second fuel consumption and emissi-
ons for each vehicle in the micro-network.
3.6 Meso-simulator
The meso-simulator is implemented as a discrete
event simulation (M.H., 1989). The events represent
the instant of reaching a network node through some
link, at which moment a new event is generated for
the next link and is added to the discrete event queue.
The discrete event queue is an ascending sequence of
events ordered by the time of their occurrence. The
meso-simulator is given paths in the meso-network to
be simulated together with the initial start time. The
first event for each path then consists of the first node
in the path and the start time, while all other events
are generated as a consequence of the initial event.
In the meso-simulator, each road link has its configu-
ration parameters such as free-flow speed, speed-at-
capacity, and jam density. In addition, each road link
has state information which includes the number of
vehicles on this link, and a queue that has these vehi-
cles. This state information is updated by the events
happening on the subject link, such as a vehicle enters
the link or a vehicle exits the link. The average speed
and travel time for each individual vehicle are calcu-
lated based on the current state of the link at the time
the vehicle enters that link. The arrival of a vehicle
to a given link triggers the meso simulator to calcu-
late its average speed and travel time, subsequently,
to schedule another event at the time in which vehi-
cle expected to exit that link. At the exit time, the
meso-simulator estimates the fuel consumption of the
vehicle on this link and adds it up to the vehicles total
fuel consumption.
3.7 Planner
Each controlled traveler has an origin, destination and
a travel window. The main task of the planner is the
planning of these multi-modal routes for the control-
led trip. The planner also is responsible for updating
or changing these routes whenever needed. During
a window that begins 30 minutes before the earliest
possible departure time for the controlled traveler, the
planner starts planning the trip by using the up-to-date
cost and timing information reported from each in-
dividual simulator. It also uses the connectivity in-
formation between the different sub-networks and/or
layers in order to create the optimal route for the sub-
ject trip. The trip can be replanned or rerouted after
the trip starts. For example, if the traveler can not ca-
tch the train at the scheduled time, or he/she can not
board the scheduled bus because the bus is full, the
responsible simulator notifies the SC which requests
the planner to find an alternative route for the traveler.
3.8 Simulation Controller
The SC is the core component of the model which is
responsible for:
• Initializing the simulation,
• Synchronizing the different simulators,
• Moving travelers between layers/sub-networks,
• Tracking the individual controlled trips.
In the initialization process, the SC reads parame-
ters such as the simulation duration and the locati-
ons of the input files for each simulation component.
Then it reads in the network files, builds the requi-
red graphs for the networks, and checks for the ap-
propriate connectivity among the different layers/sub-
networks. It also builds a list of all the controlled
trips. Then, it starts the different simulators (INTE-
GRATION, meso-simulator, bike and pedestrian si-
mulator (BPSim), and railway simulator (RailSim))
and waits for all of them to initialize. When a simula-
tor starts, and initializes its own environment, it must
send the first synchronization request to the SC and
wait for the simulation start messages from the SC.
When all the simulators are ready, the SC allows them
VEHITS 2018 - 4th International Conference on Vehicle Technology and Intelligent Transport Systems
108
to start the simulation. During the simulation, all the
simulators must be synchronized at pre-specified in-
tervals. This period is defined as the maximum sy-
nchronization interval, which is a system-wide vari-
able., its defualt value is 1 second. After this time
interval, the simulator can not progress the simula-
tion process until permitted by the SC. When the SC
identifies that all the simulators reached the same si-
mulation time, it allows them to run the next interval.
During the simulation, the SC receives the state in-
formation about each controlled trip or sub-trip from
each simulator. Consequently, it can track every in-
dividual controlled trip in different networks/layers
and is responsible for moving the traveler from one
sub-network/layer to another. By doing so, the SC
establishes the connectivity between different sub-
networks/layers. For example, when a driver finishes
his/her sub-trip on the meso-network (say, IZone1)
and needs to be moved to the micro network, the meso
simulator informs the SC to 1) update the trip infor-
mation (travel time, fuel consumption, current loca-
tion, , etc.); 2) pull the trip information from its da-
tabase and find the destination of the next sub-trip
on the micro sub-network (say, Z2); and 3) request
the corresponding INTEGRATION instance to start a
new sub-trip in its network from IZone1 to Z2 and
passes the initial route for this sub-trip ot INTEGRA-
TION. In this case, INTEGRATION may defer the
start time of this vehicle if the link to which the vehi-
cle should enter is at jam density.
4 CASE STUDY: LA NETWORK
AND PRELIMINARY RESULTS
We use this system to model the overall city of LA
in the peak hours. This section describes the network
and the preliminary simulation results.
4.1 LA Networks
To build the micro-network and meso-network, we
used three different data sources: (1) NavTeq is used
for generating nodes and links, (2) OpenStreetMap
is used for intersection traffic control information,
and (3) Google Maps are used for validating road
attributes including the number of lanes, one-way
streets, speed limits, bus lane locations, etc. The
global-network has 62,984 nodes and 181,840 links,
as shown in Figure 5-a. The LA area is divided into
five sub-networks shown in Figures 5-b through 5-
f. The walking and biking simulators use the meso-
network as input. Our system model includes the lar-
gest operator of public rail and buses in LA, LA Me-
tro. LA Metro bus service includes 170 lines, 15,967
bus stops, and 854,693 boardings/day. LA Metro rail
service includes 6 passenger rail lines, 93 stations,
and 359,861 boardings/day. Station level boarding
data were provided by LA metro along with speci-
fications of the vehicle fleet.
4.2 Traffic Calibration
The traffic is created based on real data from Perfor-
mance Measurement System (PEMS) database. The
count and speed data from PEMS database are ag-
gregated and the traffic demand between each Origin-
Destination (OD) pair is estimated using the Queen-
sOD (Aerde et al., 2003) software which utilizes the
Maximum Likelihood Least Relative Error (LRE) ap-
proach. A portion of these trips is used as control-
led travelers, while the remaining are modeled as the
background. The background travelers are modeled in
each network separately based on the calibrated traf-
fic for each sub-network as shown in Table 1. The
vehicle count in Table 1 is the total traffic on each
sub-network that includes both the controlled and the
background traffic.
5 SIMULATION RESULTS
We created the system model to enable assessing po-
tential system-wide effects of individual transporta-
tion decisions across the LA region. We ran two
scenarios for the LA area. In the base scenario, all
the travelers make travel decisions by themselves. In
the controlled scenario, the controlled travelers (10%
of the driving population) are given directions regar-
ding modes and routes by the planner. Our hypot-
heses are that the controlled case will result in an
energy reduction and a reduced network congestion
level. So, in the micro-network routing configura-
tion, the Sub-population Feedback Eco-Assignment
(ECO) (Ahn and Rakha, 2013) is used for the control-
led traffic, while the Time-Dependent Sub-Population
Feedback Assignment (SFA) (Rakha et al., 2012) is
used for the background traffic. In the base scena-
rio, since it does not have controlled traffic, only the
Table 1: Sub-network sizes.
Sub-net Nodes Links Signals Vehicles
1 743 1691 256 404,191
2 940 2251 361 447,948
3 1625 3561 459 592,343
4 741 1724 237 445,857
5 647 1507 203 362,415
Sum 4696 10734 1516 2,252,754
Large-scale Agent-based Multi-modal Modeling of Transportation Networks
109
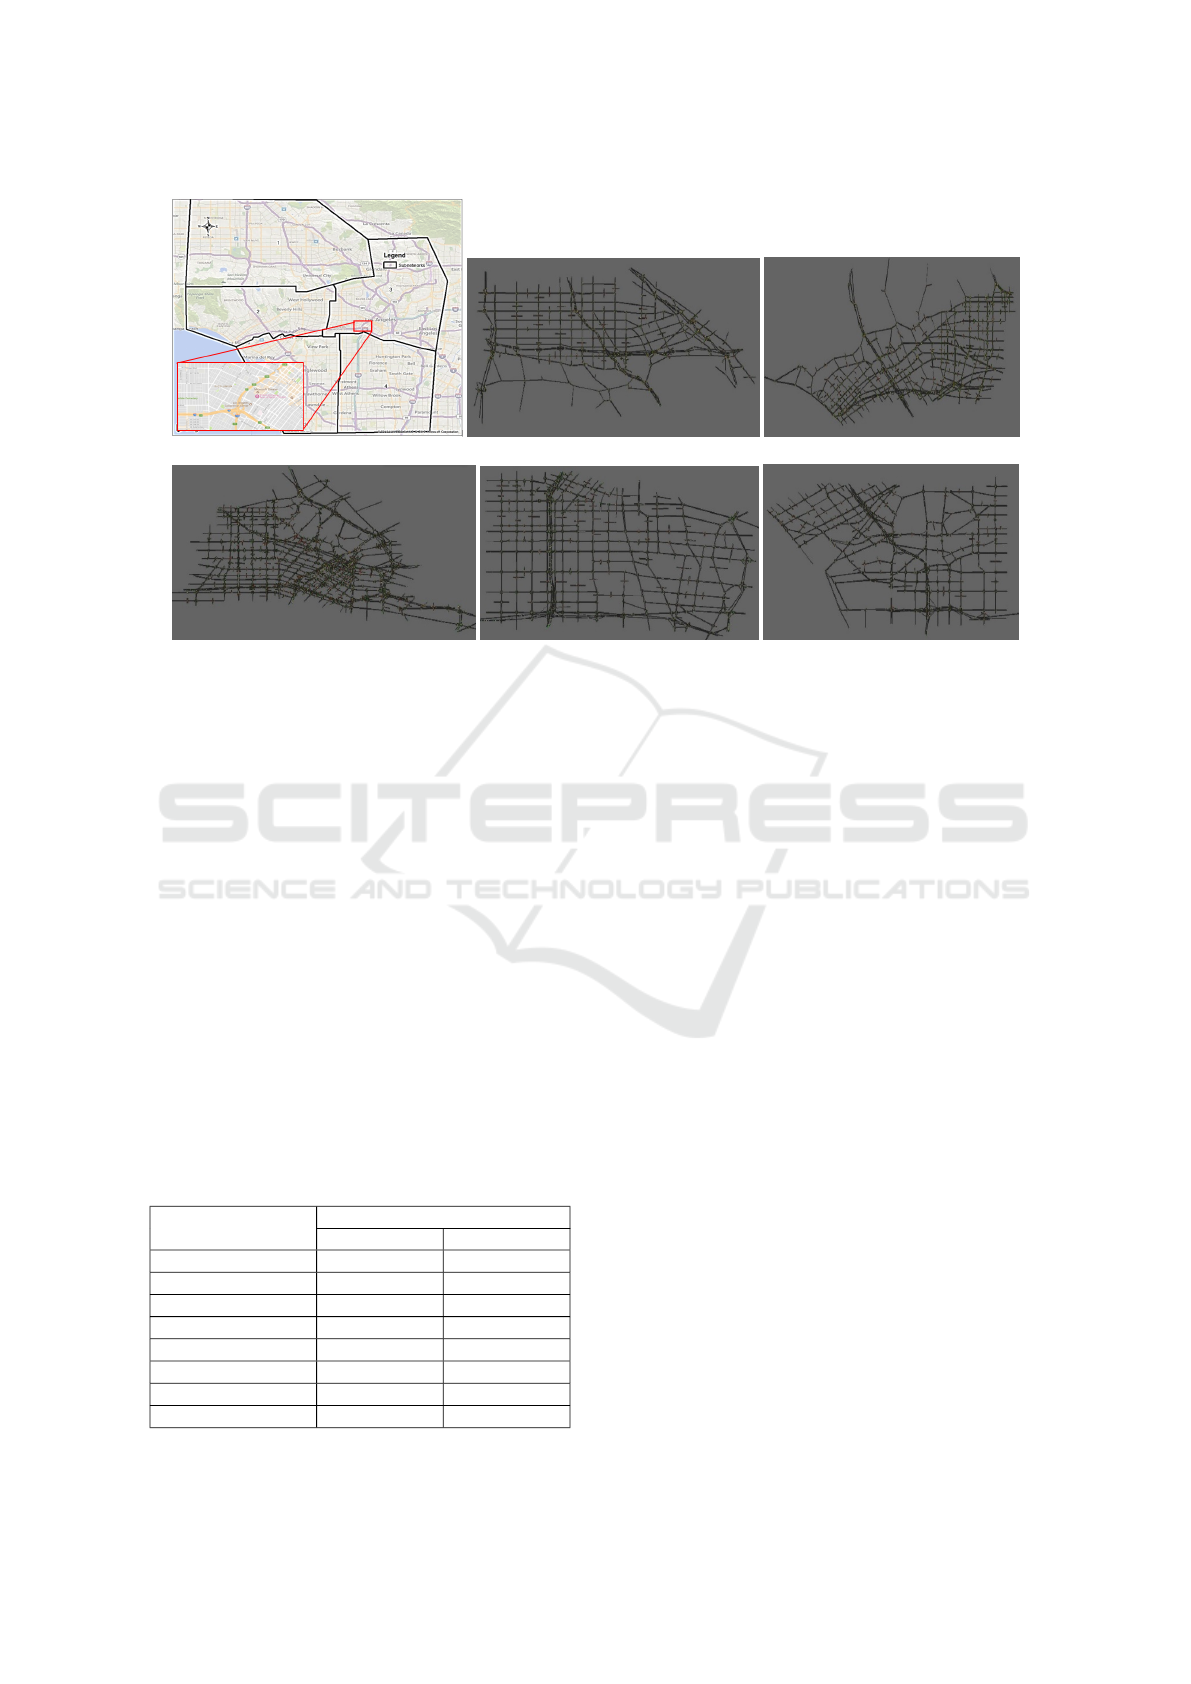
(a) LA network (b) Subnet 1 (c) Subnet 2
(d) Subnet 3 (e) Subnet 4 (f) Subnet 5
Figure 5: LA total network and micro-subnetworks.
SFA traffic assignment was run. All the other simu-
lator use the energy as the routing metric. Further-
more, we expect a controlled travel mode distribution
to be dominated by driving in the micro and meso-
networks. The global network traffic calibration sho-
wed that there were approximately 1.3 million vehicle
trips in Greater LA area. When calibrating these ODs
for the micro-networks, it generated 2.25 million trips
as shown in Table 1. The reason for this large diffe-
rence is that a portion of the global trips pass through
multiple sub-networks, being divided into multiple
sub-trips across the sub-networks. Table 2 shows the
system-wide comparison for the traveled distance, we
can notice that the traveled distance decreases for the
micro-network, while it increases for other modes as
the 10% of controlled trips are planned over multi-
ple transportation modalities. Combining the results
in Tables 2 and 3 together, we can notice that in the
micro-network the vehicle’s average traveled distance
Table 2: System wide traveled distance comparison.
Transportation Traveled Distance (Km)
Mode Base Controlled
Walking 0 1,418.6
Cycling 0 147,246.8
Riding Bus 0 3,886.4
Riding Train 0 9,230.5
Driving on Micro 18,298,072.8 17,760,530.8
Driving on Mesok 616,105.2 791,424.0
Carpooling 0 356,549.1
Total 18,914,178.0 19,070,286.2
is about 8 km and the vehicle average travel time is
about 39 minutes in the base case. In the controlled
case, the vehicle’s average traveled distance remains
approximately the same while the vehicle average tra-
vel time is reduced to approximately 23 minutes de-
monstrating that by controlling 10% of the traffic,
the vehicles moving on the main roads and highways
(micro-network) achieved a 40% saving in the total
travel time. Table 3 also shows that those vehicles
achieved about an 18% saving in the fuel consump-
tion, and their average delay is reduced by about 46%.
Shifting the controlled trips to the public transit sy-
stem is energy efficient because the increases in the
energy consumption by the buses and trains due to the
extra passenger loads is less than the savings accrued
as a result of a reduction in the traffic congestion. Ho-
wever, some of these savings come at the cost of an
increment of energy consumption in other transpor-
tation modes. Specifically, the energy consumed in
both the meso-network and the public transit increa-
sed by 110% from 270028 to 568737 KW-hr. We have
to mention that the system wide comparison of the
fuel/energy is not possible in the current version be-
cause some of energy/fuel consumption models have
not been implemented in the various sub-models.
6 CONCLUSION
The paper proposes and describes a novel multi-
modal large-scale agent-based transportation network
VEHITS 2018 - 4th International Conference on Vehicle Technology and Intelligent Transport Systems
110
Table 3: Micro-network results for base and controlled sce-
narios.
Subnet Number of vehicle Trips Total Travel Time (s) Total Delay (s) Fuel Consumed (Liter)
Number Base Controlled Base Controlled Base Controlled Base Controlled
1 404,191 399,298 1,425,241,984 737,314,176 725,780,800 223,516,944 839,149 580,246
2 447,948 399,301 716,592,000 370,059,488 374,176,480 201,135,536 580,276 448,206
3 592,343 539,949 1,466,868,736 907,472,448 702,194,240 437,199,680 901,559 714,016
4 445,857 402,510 1,126,294,656 602,945,728 544,548,864 318,766,464 704,458 544,593
5 362,415 337,392 588,823,424 306,889,216 295,441,600 126,577,376 499,629 383,526
Sum 2,252,754 2,078,450 5,323,820,800 2,924,681,056 2,642,141,984 1,307,196,000 3,525,071 2,670,588
Sub-network Average/veh 2363.25 1407.15 1172.85 628.93 1.56 1.28
modeling system that has a wide spectrum of appli-
cation. The proposed system is capable of modeling
large urban cities including different transportation
modes of travel (driving, biking, walking, riding a
bus, riding a train, and carpooling). This system is
tested by modeling the Greater LA Area during the
morning peak period. The preliminary results show
that the network is currently very congested, with an
average speed of approximately 12.3 km/hr. The re-
sults also show that by re-planning 10% of the trips,
the performance of the network can be significantly
improved. An important future effort is to improve
the system to achieve faster simulation speeds. Cur-
rently, the average simulation speed is approximately
half real-time, i.e. every virtual second is simula-
ted in 2 actual seconds. We also plan to improve
the mesoscopic traffic simulator to achieve better esti-
mates of energy consumption, delay, and travel time.
It is also important to study the complexity of the
system by quantifying its simulation speed and me-
mory usage for different demand levels. An advan-
tage of a detailed system model, like the one propo-
sed in this paper, is that it enables modeling mode
changes for different scenarios including traffic inci-
dents, construction, and special events. We intend to
explore potential savings that could result from infor-
med decision-making by groups of travelers in these
scenarios.
REFERENCES
Aerde, M., Rakha, H., and Paramahamsan, H. (2003).
Estimation of origin-destination matrices: Relati-
onship between practical and theoretical considerati-
ons. Transportation Research Record: Journal of the
Transportation Research Board, (1831):122–130.
Ahn, K. and Rakha, H. A. (2013). Network-wide impacts of
eco-routing strategies: a large-scale case study. Trans-
portation Research Part D: Transport and Environ-
ment, 25:119–130.
Ahn, K., Rakha, H. A., and Moran, K. (2012). System-
wide impacts of eco-routing strategies on large-scale
networks. In Transportation Research Board 91st An-
nual Meeting, number 12-1638.
Balakrishna, R., Morgan, D., Slavin, H., and Yang, Q.
(2009). Large-scale traffic simulation tools for plan-
ning and operations management. IFAC Proceedings
Volumes, 42(15):117–122.
Balmer, M., Nagel, K., and Raney, B. (2004). Large-scale
multi-agent simulations for transportation applicati-
ons. In Intelligent Transportation Systems, volume 8,
pages 205–221. Taylor & Francis.
Balmer, M., Rieser, M., Meister, K., Charypar, D., Le-
febvre, N., and Nagel, K. (2009). Matsim-t: Archi-
tecture and simulation times. In Multi-agent systems
for traffic and transportation engineering, pages 57–
78. IGI Global.
Boniface, S., Scantlebury, R., Watkins, S., and Mindell, J.
(2015). Health implications of transport: evidence of
Large-scale Agent-based Multi-modal Modeling of Transportation Networks
111

effects of transport on social interactions. Journal of
Transport & Health, 2(3):441–446.
Burghout, W., Koutsopoulos, H., and Andreasson, I.
(2005). Hybrid mesoscopic-microscopic traffic simu-
lation. Transportation Research Record: Journal of
the Transportation Research Board, (1934):218–255.
Burghout, W. and Wahlstedt, J. (2007). Hybrid traffic si-
mulation with adaptive signal control. Transportation
Research Record: Journal of the Transportation Re-
search Board, (1999):191–197.
Cetin, N. and Nagel, K. (2002). Parallel queue model ap-
proach to traffic microsimulations. In Proceedings of
Swiss Transportation Research Conference.
Cetin, N., Nagel, K., Raney, B., and Voellmy, A. (2002).
Large-scale multi-agent transportation simulations.
Computer Physics Communications, 147(1-2):559–
564.
Dion, F., Rakha, H., and Kang, Y.-S. (2004). Comparison of
delay estimates at under-saturated and over-saturated
pre-timed signalized intersections. Transportation Re-
search Part B: Methodological, 38(2):99–122.
Fernandes, J. L., Lopes, I. C., Rodrigues, J. J., and Ullah, S.
(2013). Performance evaluation of restful web servi-
ces and amqp protocol. In Ubiquitous and Future Net-
works (ICUFN), 2013 Fifth International Conference
on, pages 810–815. IEEE.
Guo, L., Huang, S., and Sadek, A. W. (2013). An evaluation
of environmental benefits of time-dependent green
routing in the greater buffalo–niagara region. Journal
of Intelligent Transportation Systems, 17(1):18–30.
Levy, J. I., Buonocore, J. J., and von Stackelberg, K. (2010).
Evaluation of the public health impacts of traffic con-
gestion: a health risk assessment. Environmental He-
alth, 9(1):65.
M.H., M. (1989). Simulating Computer Systems: Techni-
ques and Tools. MIT press.
Nagel, K., Rickert, M., and Barrett, C. L. (1996). Large
scale traffic simulations. In International Conference
on Vector and Parallel Processing, pages 380–402.
Springer.
Osorio, C. and Selvam, K. K. (2015). Solving large-scale
urban transportation problems by combining the use
of multiple traffic simulation models. Transportation
Research Procedia, 6:272–284.
Rakha, H., Ahn, K., and Trani, A. (2004). Development of
vt-micro model for estimating hot stabilized light duty
vehicle and truck emissions. Transportation Research
Part D: Transport and Environment, 9(1):49–74.
Rakha, H. and Lucic, I. (2002). Variable power vehicle dyn-
amics model for estimating truck accelerations. Jour-
nal of transportation engineering, 128(5):412–419.
Rakha, H., Lucic, I., Demarchi, S. H., Setti, J. R., and
Aerde, M. V. (2001). Vehicle dynamics model for pre-
dicting maximum truck acceleration levels. Journal of
transportation engineering, 127(5):418–425.
Rakha, H. A., Ahn, K., and Moran, K. (2012). Integra-
tion framework for modeling eco-routing strategies:
Logic and preliminary results. International Journal
of Transportation Science and Technology, 1(3):259–
274.
Raney, B., Cetin, N., V
¨
ollmy, A., Vrtic, M., Axhausen, K.,
and Nagel, K. (2003). An agent-based microsimula-
tion model of swiss travel: First results. Networks and
Spatial Economics, 3(1):23–41.
Videla A., J. W. (2012). RabbitMQ in action: distributed
messaging for everyone. MANNING.
White, R. and Engelen, G. (1993). Cellular automata and
fractal urban form: a cellular modelling approach to
the evolution of urban land-use patterns. Environment
and planning A, 25(8):1175–1199.
Yang, Q. and Morgan, D. (2006). Hybrid traffic simula-
tion model. In Transportation Research Board 85th
Annual Meeting, number 06-2582.
Zehe, D., Knoll, A., Cai, W., and Aydt, H. (2015). Semsim
cloud service: Large-scale urban systems simulation
in the cloud. Simulation Modelling Practice and The-
ory, 58:157–171.
Zhang, C., Osorio, C., and Fl
¨
otter
¨
od, G. (2017). Efficient
calibration techniques for large-scale traffic simula-
tors. Transportation Research Part B: Methodologi-
cal, 97:214–239.
Zhao, Y. and Sadek, A. W. (2012). Large-scale agent-based
traffic micro-simulation: Experiences with model re-
finement, calibration, validation and application. Pro-
cedia Computer Science, 10:815–820.
VEHITS 2018 - 4th International Conference on Vehicle Technology and Intelligent Transport Systems
112
