
A Model Predictive Control based Peak Shaving Application for a
Grid Connected Household with Photovoltaic and Battery Storage
Deepranjan Dongol, Thomas Feldmann and Elmar Bollin
Institute of Energy Systems Technology (INES), Offenburg University of Applied Sciences,
Am Güterbahnhof 1a, 77652, Offenburg, Baden-Württemberg, Germany
Keywords: Mixed Integer Quadratic Programming, Peak Shaving, Model Predictive Control.
Abstract: The increase in households with grid connected Photovoltaic (PV) battery system poses challenge for the
grid due to high PV feed-in as a result of mismatch in energy production and load demand. The purpose of
this paper is to show how a Model Predictive Control (MPC) strategy could be applied to an existing grid
connected household with PV battery system such that the use of battery is maximized and at the same time
peaks in PV energy and load demand are reduced. The benefits of this strategy are to allow increase in PV
hosting capacity and load hosting capacity of the grid without the need for external signals from the grid
operator. The paper includes the optimal control problem formulation to achieve the peak shaving goals
along with the experiment set up and preliminary experiment results. The goals of the experiment were to
verify the hardware and software interface to implement the MPC and as well to verify the ability of the
MPC to deal with the weather forecast deviation. A prediction correction has also been introduced for a
short time horizon of one hour within this MPC strategy to estimate the PV output power behavior.
1 INTRODUCTION
In Germany, households with grid-connected
photovoltaic (PV) systems have increased
significantly over the years as a result of favorable
feed-in tariff and subsidy policy. Households with
PV installations are typically under 10 kWp and
comprise about 15% of the total installed PV power
in Germany (Wirth and Schneider, 2013). A low-
voltage (LV) distribution grid with a pool of such
household prosumers can be considered to be a
distributed renewable energy source. Apart from
influencing the electricity price in the market and the
renewable energy policies, such a situation poses a
challenge to the technical aspect of the distribution
grid. This is particularly a problem for the residential
network where the mismatch in power generation
and load demand result in a high PV feed-in.
Distribution lines are designed to deliver power
from distribution stations to the consumers. The
power-flow reversal resulting from the integration of
prosumers who feed energy into the grid causes the
voltage to rise at the coupling point. The VDE AR-N
4105 grid standard in Germany allows only a
maximum 3% increase in the nominal voltage
caused by PV penetration (Spring and Witzmann,
2014). A case of an overvoltage problem in
Germany due to high PV feed-in into the distribution
grid has been presented in (Stetz et al., 2013). In
order to keep the voltage within the permissible
limit, the regulation in Germany suggests the feed-in
to be restricted to 70% of the installed peak PV
power capacity (Spring and Witzmann, 2014). But
this often leads to power curtailments of useful PV
power (Weniger et al., 2014; Castillo-Cagigal et al.,
2011). In a conventional PV battery operation, the
controller does not foresee PV energy production or
load demand. The controller knows the State of
Charge (SOC) of the battery only for the present
time. As such, the battery is often completely
charged before the peak PV energy production
period, which results in a high PV feed-in and
therefore cannot mitigate the voltage rise problem
(Castillo-Cagigal et al., 2011). In such a situation,
the feed-in limit can only be achieved by active
power curtailment (Tonkoski et al., 2011) or reactive
power control (Turitsyn et al., 2010; Weckx et al.,
2014).
The use of a battery allows the household
prosumers to achieve Demand-Side Management
(DSM) for themselves at a local level, independent
of the grid operator. DSM is a concept to improve
54
Dongol, D., Feldmann, T. and Bollin, E.
A Model Predictive Control based Peak Shaving Application for a Grid Connected Household with Photovoltaic and Battery Storage.
In Proceedings of the 7th International Conference on Smart Cities and Green ICT Systems (SMARTGREENS 2018), pages 54-63
ISBN: 978-989-758-292-9
Copyright © 2018 by SCITEPRESS – Science and Technology Publications, Lda. All rights reserved
the energy consumption behavior of the consumers,
primarily for economic operation and in order to
maximize the consumption of renewable energy by
balancing the mismatch in energy production and
load demand. Real-Time Price (RTP), Time of Use
(TOU) and Critical Peak Pricing (CPP) are seen as
key DSM programs to reduce the peak load demand
in the grid (Herter, 2007; Palensky, 2011; Yang et
al., 2014). In recent years , the concepts of
automated home systems have also emerged as a
part of Demand-Response (DR) strategies for the
optimal scheduling of electrical appliances in order
to respond to the price-driven DSM programs
(Costanzo et al., 2011; Di Giorgio and Liberati,
2014; Moraiset et al., 2014).
In this work, the optimal control problem has
been formulated for a single grid electricity price
and single feed-in tariff scenarios, which is very
likely to remain a standard for a long time.
Therefore, the optimal control problem presented in
this paper is not dictated by price but rather by the
predicted PV output power and the load-demand
profile. From an economic operation point of view
and considering the cost benefits by using the
battery from (Riffonneau et al., 2011), it is
justifiable to assume that maximizing the use of the
battery is cost-effective for the prosumer. In order to
implement the optimal control problem and to deal
with the forecast uncertainties, the MPC approach
has gained increased attention in recent years. Its
ability to update itself based on the measurement of
the system and to re-optimize the power flow at each
control-time interval – which is also known as the
receding horizon approach – has been presented in
(Wu et al., 2015; Parisio et al., 2014). Most of the
optimal control problems are developed with an
understanding that the receding horizon feature of
the MPC can handle the forecast uncertainties, as
mentioned by (Arnold and Andersson, 2011).
Therefore, the MPC approach can be considered to
be the state of the art for the implementation of
optimal control problems. In this paper, the proposed
MPC is applied to the existing system in the
laboratory for preliminary tests and it is assumed
that the size of the battery is enough to shave the
peak PV energy to avoid active power curtailment or
exceed the feed-in limit.
2 METHODOLOGY
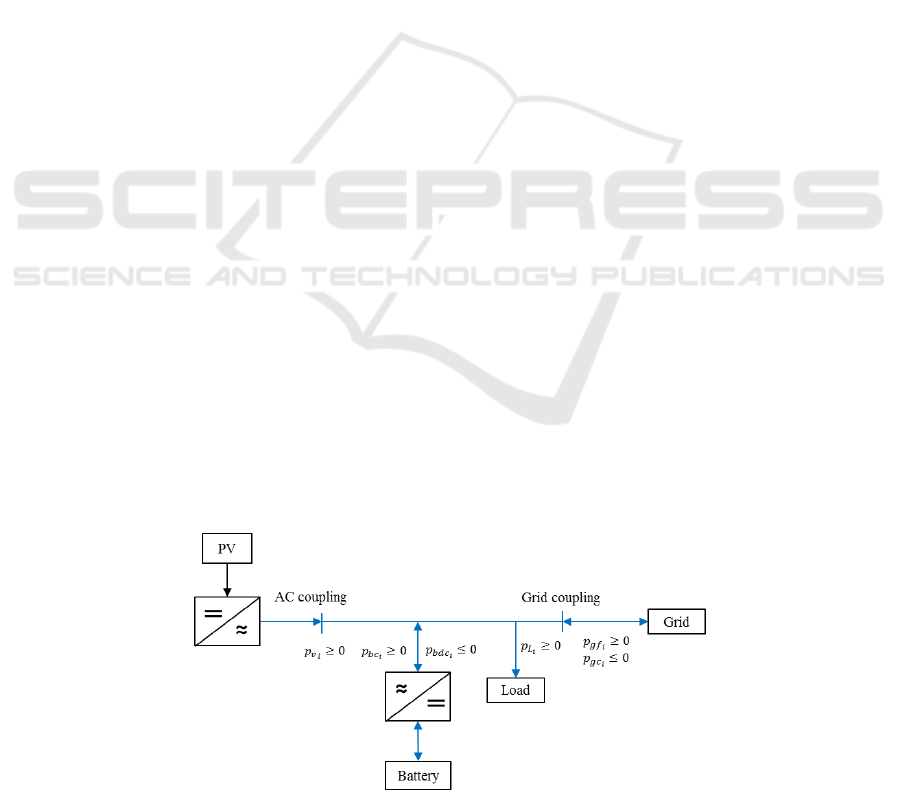
The schematic of a household with a grid-connected
PV battery system is shown in Figure 1. At any time
interval, P
v
i
is the output power of the installed PV,
P
L
i
is the load demand, P
bc
i
is the battery charging
power, P
bdc
i
is the battery discharging power, P
gf
i
is
the power fed into the grid, and P
gc
i
is the grid
power consumption. The sign convention of
respective variables for the optimal power problem
is consistent throughout this paper, as shown in
Figure 1. The grid is used as a virtual storage to take
in any surplus energy from the PV and as a backup
when the load demand exceeds the battery converter
size or when the stored battery energy is not
sufficient. The power flow within the system
satisfies the power-flow balance which can be
expressed as
P
v
i
- P
L
i
=P
gf
i
+P
bc
i
+P
bdc
i
+P
gc
i
(1)
2.1 Battery Storage Dynamics
A linear power-flow model was used to represent the
dynamic behavior of the battery and to thus measure
the battery SOC. The battery model is discretized as
(2)
The battery energy for the time interval i+1 is
calculated as the sum of battery energy
and the
Figure 1: Schematic of the grid-connected PV battery system.
A Model Predictive Control based Peak Shaving Application for a Grid Connected Household with Photovoltaic and Battery Storage
55

battery power flow P
bc
i
or P
bdc
i
at time interval i.
is the duration of the time interval. In this paper, the
duration of the time interval for the optimal control
problem is defined as 10 minutes. The efficiency of
the charging and discharging processes is defined by
variables η
ch
and η
dch
respectively. The battery
converter components consume power from the
battery and are represented by
which was
considered to be constant throughout the battery
operation. For the optimal control problem, if
is the nominal capacity of the battery, the battery
SOC’s percentage is expressed as
SOC
i+1
=
x
i+1
E
batt
×100
(3)
In order to avoid the concurrent charging and
discharging of the battery, a logical condition of
arises. It is represented as a linear
inequality by using binary variables as follows:
P
bc
i
=
0 ≤ P
bc
i
≤ P
Max
, if δ
bc
=1
0 , otherwise
(4)
P
bdc
i
=
-P
Max
≤ P
bdc
i
≤ 0 , if δ
bdc
=1
0 ,otherwise
(5)
For the optimal control problem, Eq. 4 and Eq. 5 can
be reformulated as
0 ≤ P
bc
i
≤ P
Max
∙δ
bc
i
(6)
-P
Max
∙δ
bdc
i
≤ P
bdc
i
≤ 0
(7)
Here,
is the maximum rated power of the
battery converter. Eq. 4 and Eq. 5 indicate that
battery charging or discharging only occur when the
corresponding binary variables δ
bc
or δ
bdc
are 1
respectively. Therefore, the concurrent charging and
the discharging of the battery is avoided by defining
a binary inequality constraint as
δ
bc
i
+ δ
bdc
i
≤ 1
(8)
Eq. 8 shows that either
or
can have the
value of 1. Battery operation is restricted by its rated
capacity to store the maximum level of energy as
well as the Depth of Discharge (DOD) provided by
the battery manufacturer for the recommended level
of discharge. This constraint on the battery SOC can
be expressed as
x
Min
≤ x
i+1
≤ x
Max
(9)
x
Min
= 1 - DOD∙x
Max
(10)
Here, x
Max
= E
batt
is the rated capacity of the battery.
2.2 Interaction with the Grid
As in the case of the battery, binary variables are
introduced in order to avoid the concurrent grid
feed-in and grid power consumption to reformulate
the logic constraint of P
gf
i
∙P
gc
i
=0 as
P
gf
i
=
0 ≤ P
gf
i
≤ P
v
i
, if δ
gf
= 1
0 , otherwise
(11)
P
gc
i
=
-P
g
Max
≤P
gc
i
≤0 , if δ
gc
=1
0 , otherwise
(12)
δ
gf
i
+ δ
gc
i
≤ 1
(13)
For the optimal control problem, Eq. 11 and Eq. 12
can be expressed as
0 ≤ P
gf
i
≤ P
v
i
∙δ
gf
i
(14)
-P
g
Max
∙δ
gc
i
≤ P
gc
i
≤ 0
(15)
In Eq. 14, the maximum grid feed-in is restricted by
the PV output power P
v
i
. Likewise, in Eq. 15, the
maximum grid consumption P
g
Max
is defined as the
maximum possible grid consumption for the system.
P
g
Max
is set to a very high fixed value compared to
the peak-power demand so that the required grid
consumption always takes place within it.
This has been done to make the solution feasibleIt
doesn’t affect the optimal solution due to the power-
flow balance constraint of Eq. 1. The concurrent grid
feed-in and grid consumption is avoided with Eq.
13. Furthermore, the battery is not allowed to
interact with the grid as the optimal control problem
is designed for a maximum usage of self-produced
electricity by using the battery for a single grid
electricity price and a single feed-in tariff scenario.
Therefore, the charging of the battery from and its
discharging to the grid is forbidden, which leads to
the logical conditions P
bc
i
∙P
gc
i
=0 and P
bdc
i
∙P
gf
i
=0,
which are then expressed as
δ
gf
i
+δ
bdc
i
≤1
(16)
δ
gc
i
+δ
bc
i
≤1
(17)
2.3 Optimal Control Problem
The PV power output is defined in a N×1 vector as
P
v
=
p
v
i
… p
v
i+N-1
T
over the prediction horizon
of 24 hours, where N is the number of time steps.
Similarly, the load demand over the prediction
horizon is defined in a N×1 vector as P
L
=
SMARTGREENS 2018 - 7th International Conference on Smart Cities and Green ICT Systems
56
p
L
i
… p
L
i+N-1
T
.The difference between the
predicted PV output power and the predicted load
demand for each time interval over the prediction
horizon is defined in a new N×1vector as P
in
=P
v
-
P
L
=
p
in
i
… p
in
i+N-1
T
.
The vector
provides the reference for the battery
operation over the prediction horizon. For a
prediction horizon of 24 hours, the number of time
intervals N with a time interval of 10 minutes is
obtained as, N= (24×60) 10
=144.
The objective of the optimal control problem
formulation is to find the optimal values for
and
so as to reduce the PV feed-in to the grid as
well as grid power consumption. As the problem has
reference and target variables along with binary
constraints, the optimal control problem has been
formulated as a Mixed Integer Quadratic (MIQP)
problem as
min
u
1
2
u
i
T
Ru
i
i+N-1
i
(18)
Subject to: Eq. 1 - 3, Eq. 6 - 9 and Eq. 13 - 17
Where,
u
i
=
P
in
i
-P
bc
i
P
in
i
-P
bdc
i
P
gc
i
and R=
100 0 0
0 100 0
0 0 2000
.
The quadratic penalty on P
gc
i
2
ensures that the grid
power consumption is very low, with peaks reduced.
The penalties on the squared differences P
in
i
- P
bc
i
2
and P
in
i
- P
bdc
i
2
ensure that the battery power flow
reaches as close as possible to the reference P
in
,
thereby prioritizing the peaks. Due to the power flow
balance in Eq. 1, the value of P
gf
i
is obtained
automatically from the optimal solution. The
weighting matrix R has been defined by the user to
be suitable for this process.
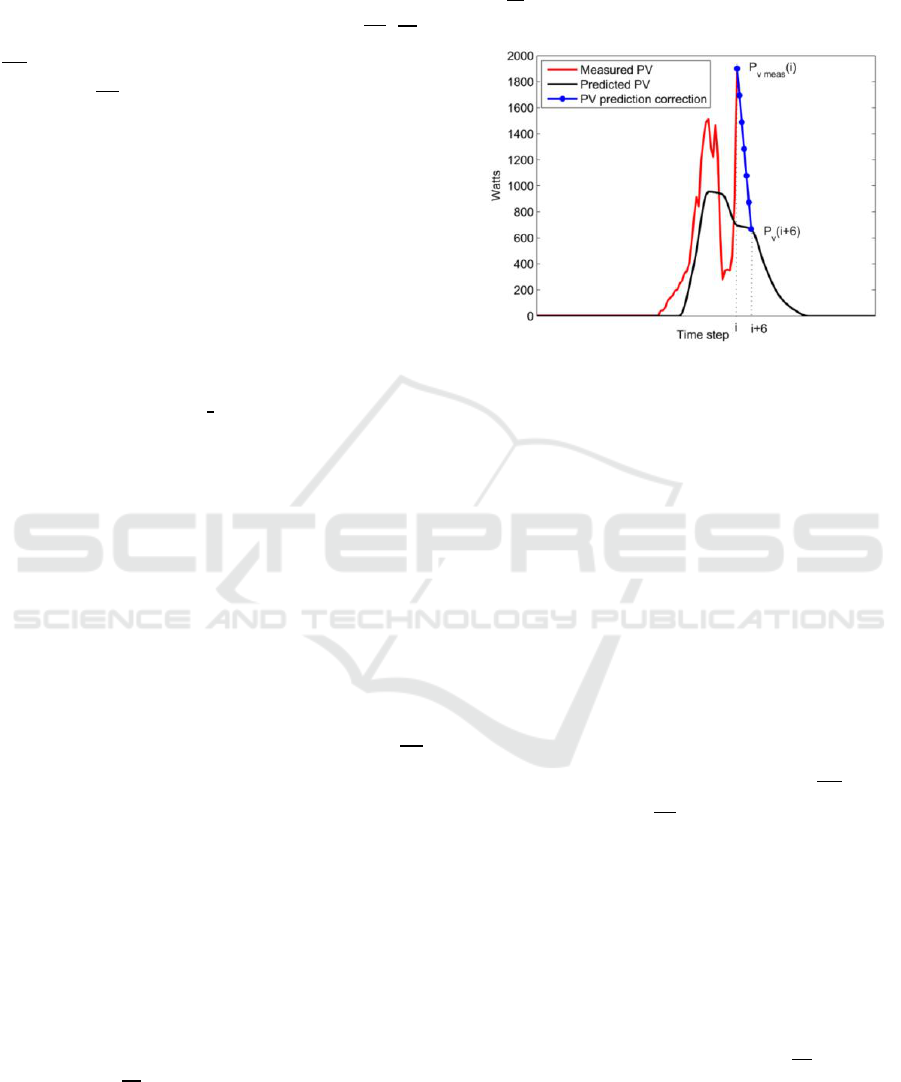
2.4 PV Power-Prediction Update
To correct the PV prediction, a linear interpolation
for the next 1 hour was applied based on the PV
power measurement at an interval. This correction
procedure is also shown in Figure 2. The initially
predicted PV data from the day-ahead forecast is
available as P
v
=
p
v
i
… p
v
i+N-1
with a time
resolution of 10 minutes. So for a given time
interval, if P
v
meas
i
is the measured PV output power
and P
v
i+6
the initially predicted value at an hour-
ahead interval i+6, the formula for the linear
interpolation between two points is given by
P
c
=P
v
meas
i
+i
- i∙( (P
v
i+6
- P
v
meas
i
) ((i+6)-i))
(19)
Where, i
ϵ [i+1 ,i+5]
Figure 2: PV prediction-correction method by using linear
interpolation.
3 MPC STRATEGY
The proposed MPC implementation scheme for the
experiment is shown in Figure 3. The weather
forecast data are collected every 24 hours from the
weather service provider. The global solar insolation
(G
h
), the ambient temperature (T
amb
) and relative
humidity data (r
h
) are obtained as weather forecast
data for every hour. The predicted PV output power
with the prediction model described in (Schmelas et
al., 2015) is then interpolated for every 10 minutes
by using Piecewise Cubic Hermite Data
interpolation. The load profile prediction is collected
from the database. The predicted PV data P
v
, along
with the load profile P
L
and the initialized battery
SOC x
i
from the measurement is then provided so as
to solve the optimal control problem, which results
in a sequence of optimal control values:
u
i
,u
i+1
,u
i+2
,…u
i+N-1
. Only the first optimal value u
i
for the first control interval i is provided as a local
command to the battery converter in order to control
battery power flow. Towards the end of each control
time interval, the measured PV output power is used
to correct the PV prediction which then updates the
predicted PV output-power profile as P
v
. The load
profile is automatically updated within the system.
Load demand was considered to be perfect and
virtual as there was no real load available due to the
limitations in the laboratory infrastructure. So the
A Model Predictive Control based Peak Shaving Application for a Grid Connected Household with Photovoltaic and Battery Storage
57
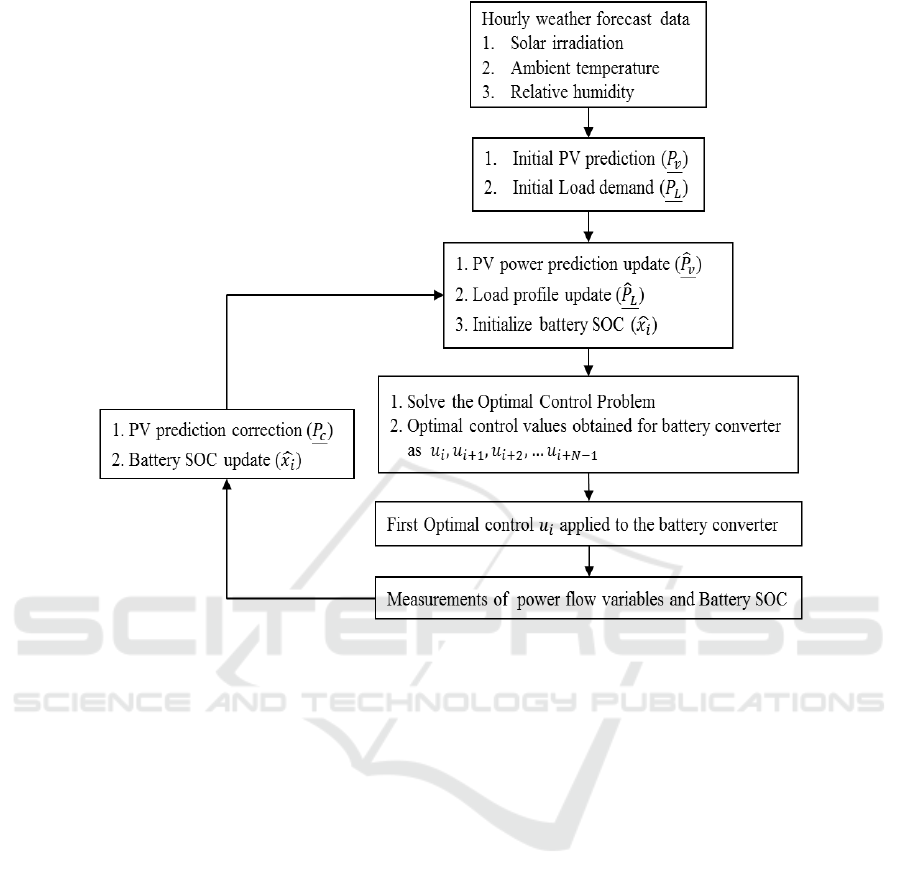
Figure 3: Proposed MPC approach used for the experiment.
optimal discharging of the battery was considered to
fulfill the load-demand case. There is also no real
grid power consumption, but only the reduction in
the load demand .The expected grid power
consumption is calculated from the power-flow
balance in Eq. 1. The measured battery SOC x
i
is
used again in order to update and initialize before
another optimal control problem is solved. This
process is then repeated online.
3.1 Experiment Setup Description
The schematic of the MPC implemented in the
laboratory system is shown in Figure 4. The
experiment setup consisted of an installed 2.1 kWp
PV system. The PV installation was AC-coupled
with the experimental micro-grid by using a 2.2
kWp PV inverter. A 1.8 kWp battery converter
connected the battery with this micro-grid. It was
used to control battery power flow based on the
command given to it. A deep-discharge 3 kWh
lithium-ion battery was used for the experiment.
This micro-grid was also coupled with the main grid.
As mentioned before, the load demand is virtual and
has only been shown for the sake of representation.
It should be noted that the measurements P
v
meas
, P
bc
,
P
bdc
and x were measured directly from the real
system. However, since P
L
is virtual, P
gc
was
derived from the calculation. The schematic of the
communication between the hardware and the
software interface used in this experiment is shown
in Figure 5. The weather forecast data and the load-
demand profile were read from a MS-SQL server
database. The weather forecast data were updated
every 24 hours. These data were loaded into
MATLAB by using SQL commands. The optimal
control problem was solved in MATLAB using
CPLEX solver. The optimal value of battery power
flow for the corresponding control time interval was
transferred from MATLAB into the SQL server
database by using SQL commands. LABVIEW was
used as an interface between the SQL server
database and the CX2040 Beckhoff Programmable
Logic Controller (PLC) by using the OPC UA
communication protocol to visualize the process.
Otherwise, the PLC could read directly from the
MS-SQL server database as well. The PLC then sets
the optimal battery power-flow value in the battery
SMARTGREENS 2018 - 7th International Conference on Smart Cities and Green ICT Systems
58
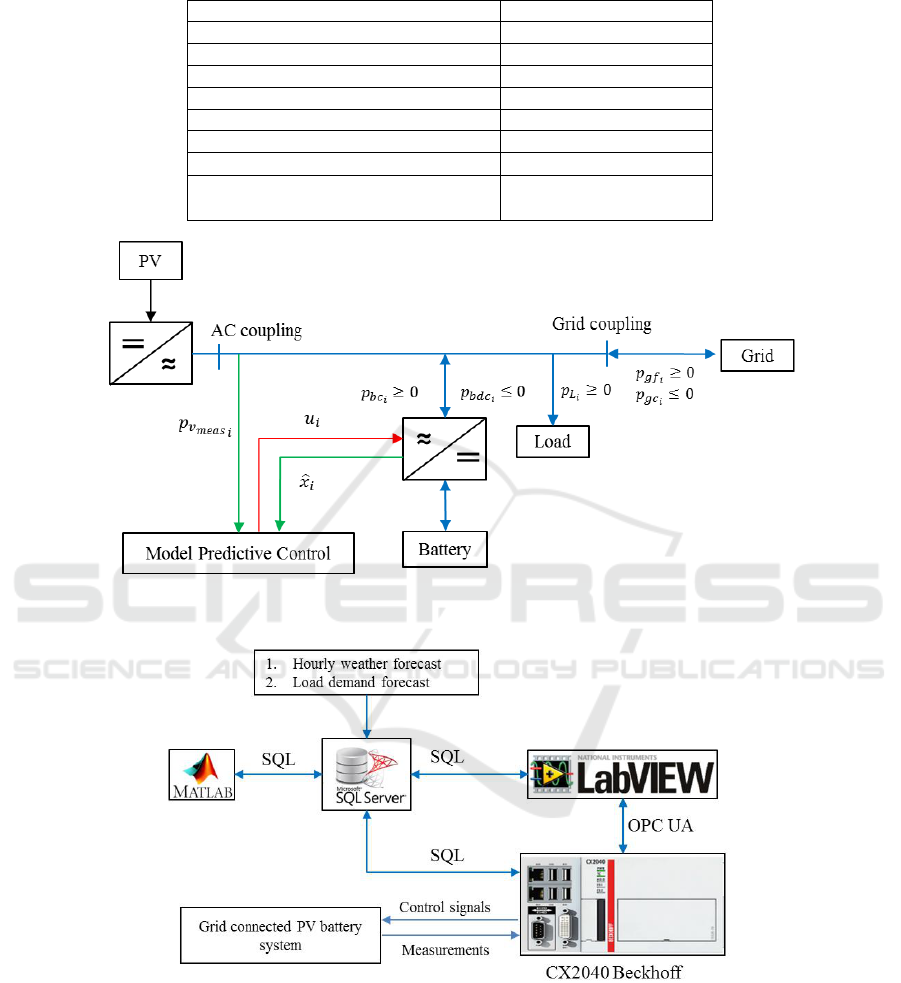
Table 1: System specification in the experiment setup.
System description
Specification
Installed PV array capacity
2.1 kWp
Installed PV inverter capacity
2.2 kWp
Nominal battery capacity (
)
3 kWh
SOC
Max
100 %
SOC
Min
15 %
Battery converter size (
)
1.8 kWp
Battery charging efficiency (
)
85 %
Battery discharging efficiency
(
)
95 %
Figure 4: Schematic of the experiment setup using the proposed MPC strategy.
Figure 5: Schematic of communication between MPC and PV battery system.
converter, as well as taking relevant measurements
from the system. The PLC also writes the measured
data into the SQL server database which is then
loaded into the MATLAB. This approach was
chosen since the MATLAB 2014a version does not
support the OPC UA protocol.
The system parameters used for the experiment
are shown in Table 1.
A Model Predictive Control based Peak Shaving Application for a Grid Connected Household with Photovoltaic and Battery Storage
59

3.2 Preliminary Experiment Results
In order to test the effectiveness of the proposed
MPC strategy, the preliminary experiment was
conducted during the consecutive cloudy days of
October 11 and 12 in 2016. These two days were
chosen based on weather forecast data. The results
presented in this paper are mean values of the
measurements over the control interval. The initially
predicted and the measured PV output power at the
end of the experiment is shown in Figure 6, with
huge deviations as expected. The experiment results
from the proposed MPC strategy are shown in
Figure 7 and Figure 8. They are presented with a
time resolution of 10 minutes. The results show that
the PV prediction-correction method is able to
estimate the behavior of PV output power. Its
random peaks due to clouds have been detected.
This, along with the receding horizon feature of the
MPC, is able to optimally control battery power
flow, effectively dealing with the deviations in the
PV prediction errors. The battery charging is
optimally controlled when peaks in PV power
production occur. Furthermore, the optimal
discharge of the battery reduced the peak-load
demand during the evening and the following
morning, owing to the receding horizon feature of
the MPC. The loss in the battery due to self-
consumption from the power electronics of the
converter was measured to be around 10 watts. Due
to the optimal discharge of the battery, the Load
Demand Reduction (LDR) is high for the higher
values of load demand, as shown in Figure 9. The
LDR was calculated as
LDR (%)= P
dc
i
P
L
i
×100
(20)
The resulting SOC profile for this experiment is
shown in Figure 10. Since a linear power-flow
model of the battery was used to predict the battery
SOC, it is quite understandable that the non-linear
dynamics of the battery were not captured well. As
can be seen in Figure 10, there was a sudden
increase in the SOC from 17 to 18 hours. If a very
complex non-linear model of the battery is to be
used, the entire problem formulation becomes non-
linear and non-convex and hence, the optimal
control problem needs to be reformulated as a
Dynamic Programming (DP) problem (Riffonneau et
al., 2011). However, in our case, the continuous
update of the SOC restricted battery operation within
its defined SOC boundary conditions and allowed
for an optimal use of the battery. Therefore, the
linear power-flow model is still effective to estimate
the behavior of the battery.
But there is a limitation in this experiment with
respect to the time resolution of the MPC. When the
change in PV power production with respect to time
(ΔP
v
Δt
) was faster than the MPC time resolution
of 10 minutes, the controller was not able to take any
control action. Figure 10 shows that due to this,
during the first charging period after 11 and 13
hours, the battery charging power was at times more
than the surplus PV output power. This situation can
also be seen after 17 and 18 hours as well as after 34
and 36 hours. So during this time, grid power was
consumed in order to charge the battery, which was
an error. There was also a PV feed-in to the grid
after 16, 38 and 39 hours due to this time-resolution
limitation. The time required for one complete MPC
loop in an interval for this experiment was around
seconds from obtaining the predicted and
measured data to solving the optimal control
problem and finally sending the control signal to the
battery converter. It should be noted that increasing
the time resolution of the optimal control problem
also reduces the speed of solving it. And with a
further increase in time resolution, the problem
might get beyond the solver’s capability. This was
the reason to consider 10 minutes as a benchmark
time resolution for this experiment – as the goal was
only to verify the behavior of the MPC, which was
as expected. Since this was just a preliminary test,
the MPC performance does provide a motivation to
upgrade the MPC strategy for real-time operation.
The use of a two-level control by using optimal
scheduling and an MPC loop (as presented in
(Petrollese et al., 2016) provides a scope of
upgrading the MPC approach used in this
experiment for real-time application. Despite the fact
that the experiment results were not as ideal as
expected, the behavior of the proposed MPC
approach in dealing with the weather forecast
uncertainties (as for PV energy prediction) and the
disturbance (as with the battery SOC) were well-
captured.
SMARTGREENS 2018 - 7th International Conference on Smart Cities and Green ICT Systems
60
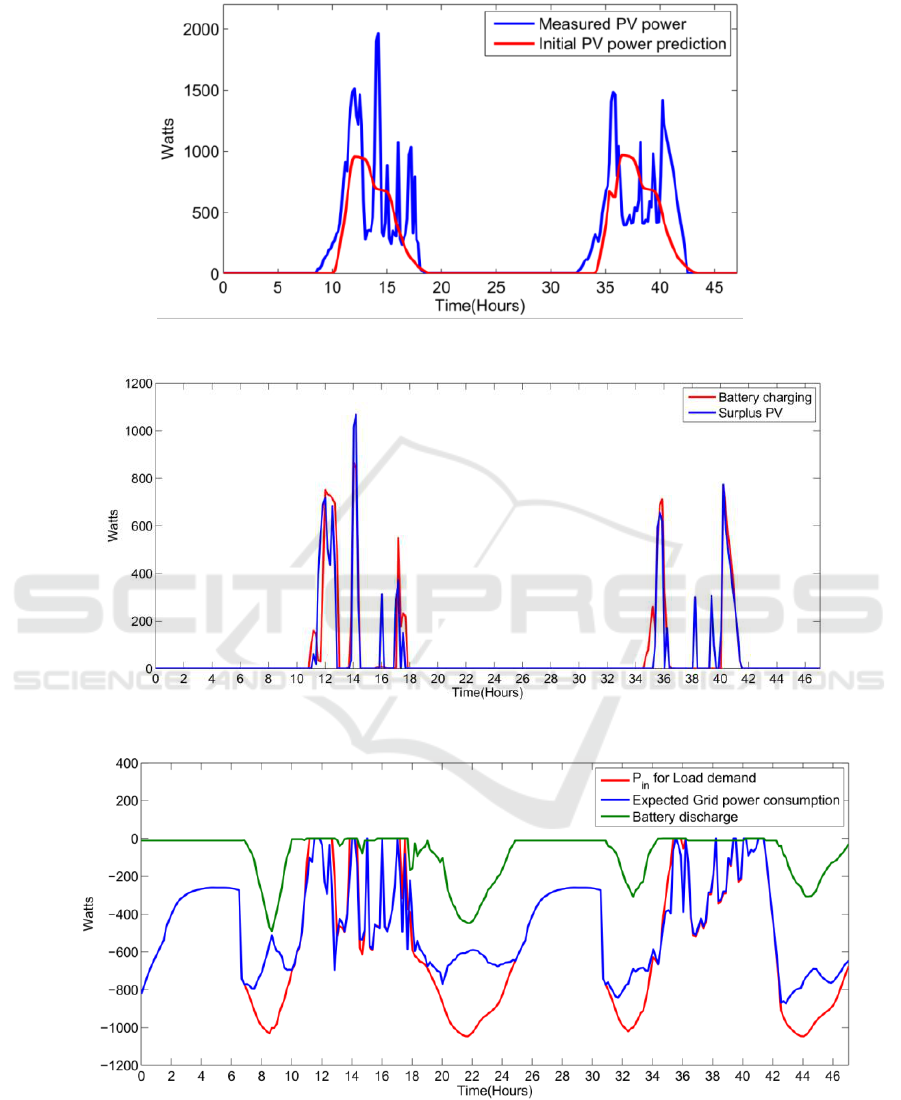
Figure 6: Predicted and measured PV power output.
Figure 7: Experiment results for the optimal charging of the battery.
Figure 8: Experiment results for the optimal discharge of the battery.
A Model Predictive Control based Peak Shaving Application for a Grid Connected Household with Photovoltaic and Battery Storage
61
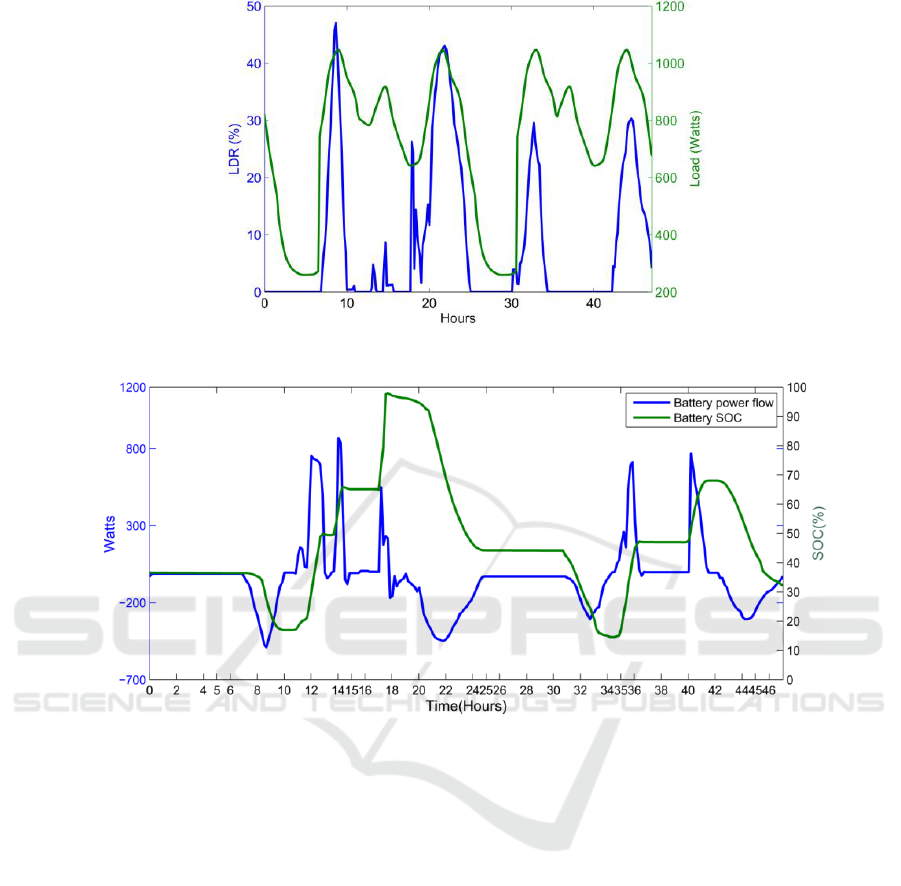
Figure 9: Reduction in Load demand from the experiment.
Figure 10: Experiment results for the battery SOC profile.
4 CONCLUSIONS
The experimental results show that the optimal
control problem formulated for the peak shaving
application of the battery always prioritizes the
peaks in the surplus PV and the load demand
respectively, as well as maximizing the use of the
battery. The problem formulation is consistent for
the given size of the system. This allows the
prosumer to maximize the use of self-produced
electricity and to conduct its own DSM. This way,
the prosumer can conduct its own energy
management for the benefit of the grid without the
need for any external control signals.
Preliminary results with the proposed MPC
approach show the ability of the system to deal with
the forecast uncertainties. The experiment results
also show that the PV power-prediction correction
method, together with the moving horizon feature of
the MPC, is able to estimate the behavior of PV
output power and deal with forecast uncertainties.
For the time resolution of 10 minutes (as used in this
work), the MPC is not able to take decisions for the
deviations that occur within this time interval. So the
MPC is still not perfect, and future work is intended
to improve its strategy for real-time application.
From the experimental results, it was also deduced
that with an effective load-prediction model and
correction method, the MPC can effectively deal
with the load uncertainty as well, which is also part
of the future work.
REFERENCES
Castillo-Cagigal, M., Caamano-Martín, E., Matallanas, E.,
Masa-Bote, D., Gutiérrez, A., Monasterio-Huelin, F.,
and Jiménez-Leube, J. (2011). PV self-consumption
SMARTGREENS 2018 - 7th International Conference on Smart Cities and Green ICT Systems
62

optimization with storage and active DSM for the
residential sector. Solar Energy, 85(9), 2338-2348.
Costanzo, G. T., Kheir, J., and Zhu, G. (2011, June). Peak-
load shaving in smart homes via online scheduling. In
Industrial Electronics (ISIE), 2011 IEEE International
Symposium on (pp. 1347-1352). IEEE.
Di Giorgio, A., and Liberati, F. (2014). Near real time load
shifting control for residential electricity prosumers
under designed and market indexed pricing models.
Applied Energy, 128, 119-132.
Arnold, M., and Andersson, G. (2011, August). Model
predictive control of energy storage including
uncertain forecasts. In Power Systems Computation
Conference (PSCC), Stockholm, Sweden (Vol. 23, pp.
24-29).
Herter, K. (2007). Residential implementation of critical-
peak pricing of electricity. Energy Policy, 35(4),
2121–2130.
Wirth, H., and Schneider, K. (2015). Recent facts about
photovoltaics in Germany. Fraunhofer ISE, 92.
Morais, H., Faria, P., and Vale, Z. (2014). Demand
response design and use based on network locational
marginal prices. International Journal of Electrical
Power and Energy Systems, 61, 180-191.
Palensky, P., and Dietrich, D. (2011). Demand side
management: Demand response, intelligent energy
systems, and smart loads. IEEE transactions on
industrial informatics, 7(3), 381-388.
Parisio, A., Rikos, E., Tzamalis, G., and Glielmo, L.
(2014). Use of model predictive control for
experimental microgrid optimization. Applied Energy,
115, 37-46.
Petrollese, M., Valverde, L., Cocco, D., Cau, G., and
Guerra, J. (2016). Real-time integration of optimal
generation scheduling with MPC for the energy
management of a renewable hydrogen-based
microgrid. Applied Energy, 166, 96-106.
Riffonneau, Y., Bacha, S., Barruel, F., and Ploix, S.
(2011). Optimal power flow management for grid
connected PV systems with batteries. IEEE
Transactions on Sustainable Energy, 2(3), 309-320.
Schmelas, M., Feldmann, T., da Costa Fernandes, J., and
Bollin, E. (2015). Photovoltaics energy prediction
under complex conditions for a predictive energy
management system. Journal of Solar Energy
Engineering, 137(3), 031015.
Spring, A., Becker, G., and Witzmann, R. (2014, June).
Grid Voltage Influences Of Reactive Power Flows Of
Photovoltaic Inverters With A Power Factor
Specification Of One. In Cired Workshop-Rome (pp.
11-12)..
Stetz, T., Marten, F., and Braun, M. (2013). Improved low
voltage grid-integration of photovoltaic systems in
Germany. IEEE Transactions on Sustainable Energy,
4(2), 534-542.
Tonkoski, R., Lopes, L. A. C., and El-Fouly, T. H. M.
(2010, July). Droop-based active power curtailment
for overvoltage prevention in grid connected PV
inverters. In Industrial Electronics (ISIE), 2010 IEEE
International Symposium on (pp. 2388-2393). IEEE.
Turitsyn, K., Sulc, P., Backhaus, S., and Chertkov, M.
(2010, October). Local control of reactive power by
distributed photovoltaic generators. In Smart Grid
Communications (SmartGridComm), 2010 First IEEE
International Conference on (pp. 79-84). IEEE.
Weckx, S., Gonzalez, C., and Driesen, J. (2014).
Combined central and local active and reactive power
control of PV inverters. IEEE Transactions on
Sustainable Energy, 5(3), 776-784.
Weniger, J., Bergner, J., and Quaschning, V. (2014).
Integration of PV power and load forecasts into the
operation of residential PV battery systems. In 4th
Solar Integration Workshop (pp. 383-390).
Wu, Z., Tazvinga, H., and Xia, X. (2015). Demand side
management of photovoltaic-battery hybrid system.
Applied Energy, 148, 294-304.
Yang, J., Zhang, G., and Ma, K. (2014). Matching supply
with demand: A power control and real time pricing
approach. International Journal of Electrical Power
and Energy Systems, 61, 111-117.
A Model Predictive Control based Peak Shaving Application for a Grid Connected Household with Photovoltaic and Battery Storage
63
