
Making the Cloud Work for Software Producers: Linking
Architecture, Operating Cost and Revenue
Pierangelo Rosati
1
, Frank Fowley
1
, Claus Pahl
2
, Davide Taibi
3
and Theo Lynn
1
1
Irish Centre for Cloud Computing and Commerce, Dublin City University, Dublin, Ireland
2
Faculty of Computer Science, Free University of Bozen-Bolzano, Bolzano, Italy
2
Laboratory of Pervasive Computing, Tampere University of Technology, Tampere, Finland
Keywords: Cloud Migration, Total Cost of Ownership, Monetization, Architecture Migration, Software Producer.
Abstract: Cloud migration is concerned with moving an on-premise software system into the cloud. In this paper, we
focus on software producers adopting the cloud to provide their solutions to enterprise customers. Their
challenge is to migrate a software product, developed in-house and traditionally delivered on-premise, to an
Infrastructure-as-a-Service or Platform-as-a-Service solution, while also mapping an existing traditional
licensing model on to a cloud monetization model. The analysis of relevant cost types and factors of cloud
computing generate relevant information for the software producers when deciding to adopt cloud computing,
and defining software pricing. We present an integrated framework for informing cloud monetization based
on operational cost factors for migrating to the cloud and test it in a real-life case study. Differences between
basic virtualization of the software product and using fully cloud-native platform services for re-architecting
the product in question are discussed.
1 INTRODUCTION
Cloud computing is increasingly the computing
paradigm of choice for enterprises worldwide. Cloud
computing is particularly attractive from a business
perspective since it requires lower upfront capital
expenditure, and improves operational and organiza-
tional efficiencies and agility (Armbrust et al., 2010;
Leimbach et al., 2010; Marston et al., 2011; Berman
et al., 2012). Similarly, from a technical perspective,
the benefits of the cloud are well documented
including on-demand, self-service, resource pooling
and rapid elasticity (Armbrust et al., 2010).
Notwithstanding these benefits, cloud computing
adoption also generates significant challenges for
software producers (SPs), particularly for those
offering a Software-as-a-Service (SaaS) model. SPs
typically migrate their software to a third-party
platform (Infrastructure-as-a-Service – IaaS – or
Platform-as-a-Service – PaaS) and their customers
access it from this new multi-tenant architecture. In a
cloud environment both SPs and their customers are
typically charged on a pay-per-use or subscription
basis. Furthermore, SPs do not have control of
customers’ service usage; in such a context, it is
crucial for SPs to identify the right architectural
configuration to meet service level agreement (SLA)
obligations at the minimum cost. Being charged on a
per-use basis also represents a radical change in the
producers’ cost and revenue models and introduces
additional uncertainty in cash flow forecasting
(Dillon et al., 2010). Furthermore, the actual cost of
the migration process might be substantial for SPs
and for their legacy customers, while nonexistent for
cloud-native SPs. According to the Cloud Native
Computing Foundation, modern cloud-native
systems have the following properties:
container-packaged;
dynamically managed by a central
orchestrating process;
microservice-oriented.
Cloud-native architectures have technical
advantages in terms of isolation and reusability, thus
reducing cost for maintenance and operations. PaaS
clouds with their recent support for containerized
microservice architectures are the ideal environments
to create cloud-native systems.
While the service and payment/revenue model are
the same in both scenarios, the total cost of ownership
(TCO) is substantially different due to the migration
costs. Rationally, SPs should offer their software at a
higher price to compensate their migration costs,
364
Rosati, P., Fowley, F., Pahl, C., Taibi, D. and Lynn, T.
Making the Cloud Work for Software Producers: Linking Architecture, Operating Cost and Revenue.
DOI: 10.5220/0006679303640375
In Proceedings of the 8th International Conference on Cloud Computing and Services Science (CLOSER 2018), pages 364-375
ISBN: 978-989-758-295-0
Copyright
c
2019 by SCITEPRESS – Science and Technology Publications, Lda. All rights reserved

however this may not always be competitively
feasible or desirable.
While architectural challenges in migration have
been ad-dressed (Jamshidi et al., 2013; Pahl and
Xiong, 2013), research exploring the link between
cloud architecture and TCO, and therefore on pricing
cloud services from an SP perspective is lacking.
The main objective of this paper is to explore the
impact of two cloud architectural options, IaaS (basic
virtualization) and PaaS (cloud-native), on SPs’
operating costs. We present an initial framework for
operating cost factors and dependencies, and a
practical process for architecture-related cost
estimation.
This paper is organized as follows. Section 2
reviews related work and presents the cloud migration
context. Section 3 introduces the overall framework
and process. Sections 4 and 5 focuses on the IaaS- and
PaaS-based cost calculation respectively. In Section
6, we validate and illustrate our contribution using a
case study. We end with some conclusions and
observations for future research.
2 ARCHITECTURE MIGRATION
CONTEXT
2.1 Context and Related Work
Traditionally, enterprise software was licensed under
a packaged, perpetual or server license, and
customers were typically required to purchase
technical support and maintenance packages for a
predefined period (Ferrante, 2006). The cost of
software development, production and marketing was
offset against the license fees, typically paid upfront
by the customer.
The introduction of cloud computing accelerated
the adoption of two new licensing models:
subscription and utility-based licensing. The former
involves an enterprise customer purchasing a license
for a pre-defined time period whereas the latter
involves charging the customer on a pay-per-use
basis. Key advantages for the enterprise customer
include (i) less upfront expenditure in licensing and
(ii) no additional fees for fixes, upgrades or feature
enhancements (Ferrante, 2006). The shift from a
product orientation to a service orientation is a
significant disruption for SPs, not only from a
strategic perspective but also from a cost- and
revenue- recognition perspective. Cost and revenues,
indeed, are spread over time and producers do not
receive additional fees for upgrades. This resulted in
a significant business model readjustment (DaSilva et
al., 2013). Such changes do not apply to cloud-native
SPs such as start-ups. Giardino et al. (2015) observe
that cloud computing is particularly beneficial for
start-up companies since it significantly lowers the
initial investment in IT infrastructure.
Cost savings are a major factor in cloud adoption
(CFO Research, 2012; Bain and Company, 2017),
however ex-ante TCO estimation is not
straightforward due to the presence of long-term and
hidden costs of operating in the cloud which tend to
be ignored or underestimated (ISACA, 2012). From
an SP perspective, this represents a major concern
since properly mapping the costs of the cloud
represents the basis for adequate and effective pricing
strategies. This process has become more and more
important for SPs due to increasing competition in the
cloud environment, where SPs are sometimes forced
to deliver services whose costs exceed revenues
(Durkee, 2010).
TCO is the most adopted costing model in both
research and practice (Strebel and Stage, 2010) and
has been defined as “a procedure that provides the
means for determining the total economic value of an
investment, including the initial capital expenditures
(CapEx) and the operational expenditures (OpEx)”
(Filiopoulou, 2015, p. 278). TCO estimation
frameworks used for traditional on-premise
infrastructure need to be adapted to the cloud world
to reflect different cost drivers (Martens et al, 2012;
Walterbusch et al, 2013).
Strebel and Stage (2010) applied a TCO-based
decision model for business software application
deployment, while running simulations on hybrid
cloud environments. The decision model only
included a comparison of operational IT costs, such
as server and storage expenses and the external
provisioning by means of cloud computing services.
Reference (Li et al., 2009) formulated a TCO model
and identified the factors involved in the utilization
cost. This model consists of the total cost of all
servers and resources used to provide the service.
Cloud implementation and operating costs were
divided into eight different categories that mainly
represent fixed costs, such as setting-up and
maintenance costs that providers need to bear during
the whole lifecycle. Ilan (2011) presents a cost
comparison between virtual managed nodes and local
managed servers and storage, but neglects important
cost components like licenses, training, licensing and
maintenance. Finally, Walterbusch et al. (2013)
presents a comprehensive TCO model for the three
main cloud service models (i.e. IaaS, PaaS and SaaS),
and map into their model different cost components
Making the Cloud Work for Software Producers: Linking Architecture, Operating Cost and Revenue
365

across four phases of cloud computing, i.e., initiation,
evaluation, transition, operation. Costs related to
system failure and backsourcing or discarding are
listed but not included in the model since they are, by
their nature, contingent to situation contexts and
therefore difficult to translate in a mathematical
formula.
Despite the large number of studies on software
architecture-related factors for consideration in
migration, and, likewise, the large number of studies
related to TCO for cloud computing, there is a lack of
papers seeking to estimate the TCO for cloud
migration in conjunction with architecture concerns.
The extant literature is typically focused on ex-post
calculation of costs and profits independently from
the wider situational context, and typically considers
only cloud operational cost. For example,
Andrikopoulos et al. (2013) proposes a decision
support system which includes a cost calculator based
on per-use cost components only. Jinesh (2010)
presents a TCO estimation of migrating to Amazon
Web Services (AWS) that includes per-use charges
only. Similarly, Anwar et al. (2015) examine cost-
aware cloud metering for scalable services.
2.2 Two Migration Business Cases
Cloud computing adoption can dramatically change a
company business model and internal organization,
and requires investing a significant amount of
resources in the migration process. In such a context,
an ex-ante evaluation of costs and potential benefits
that such an investment may generate is crucial for
effective decision-making. In this paper, we consider
two discernible migration business types:
The migration of existing legacy customers
with perpetual licenses;
New customers with no existing economic
relationship with the SP.
In the first case, there is a significant post-migration
discontinuity in the vendor-customer relationship and
the nature of the billing. From the customer
perspective, the business case can be made by
comparing the as-is and the to-be solution, however
this is anything but a trivial process (ISACA, 2012).
There may be time, effort and additional hidden costs
related to the migration that need to be included in the
ex-ante evaluation and recovered by both SPs and
their customers (ISACA, 2012). In the second case,
customers can make their choice on the basis of the
perceived value of the service per se. In both cases a
key consideration for SPs is the amount of cost they
can sustain to generate a positive margin on their sale
over a defined time period.
TCO is used to estimate the cost of cloud investments
from the initial sourcing through to the end of the
cloud usage, whether that is the backsourcing of
information, or the client switching to other services
or providers. While the measured nature of the cloud
allows for a detailed ex-post cost analysis, ex-ante
cost estimation can be complicated due to the
uncertainty associated with multi-tenancy and
resource pooling. Similarly, while there are clear cost
savings in cloud computing there are also intangible
cost components which are more difficult to estimate
(ISACA, 2012).
By its very nature, cloud computing enables
enterprise customer scale up and down on-demand
without the ties associated with a substantial upfront
investment. Thus, forecasting the customer lifetime
(and associated value) for a cloud customer can be
difficult. Suddenly, they can leave or radically modify
their usage, since switching costs in the cloud are
significantly lower than on-premise. Notwithstanding
this, enterprise customers and SPs require a practical
approach to measuring cloud TCO.
3 INTEGRATED MIGRATION
FRAMEWORK AND PROCESS
Typically, a cloud migration is organized around an
architectural transformation of the legacy system,
independent of cost and pricing considerations. We
propose an integrated process for migration planning:
Analyze and model: use a set of migration
patterns to determine structural cloud
architecture aspects;
Right-scaling: conduct a feasibility study to
validate quality requirements such as
scalability;
Right-pricing: determine pricing for the
software service based on analysis of direct
operational costs driven by predicted usage and
experimental consumption figures generated
from the feasibility study.
While a comprehensive discussion of cloud migration
patterns, processes and issues are presented in
Jamshidi et al. (2014) and Taibi et al. (2017), right-
scaling and pricing need further discussion.
3.1 Problem 1: Right-Scaling of SaaS
Software
SPs seeking to migrate to the cloud need to find the
right architectural configuration to meet the necessary
service level agreement (SLA) obligations at the
CLOSER 2018 - 8th International Conference on Cloud Computing and Services Science
366

minimum cost. Therefore, a key question for a
decision maker is: how many components can I host
on a fixed cloud compute resource with a pre-defined
latency performance target for a forecasted number of
users of a particular application with a forecasted mix
of application operation usage?
Changes in usage require changes in the number
and/or configuration of cloud resources used, which
may result in additional costs. Estimation of the
expected usage level or patterns is needed to predict
when scaling, and related additional costs, may occur.
Furthermore, storage and networking charges are akin
to commodities that can be consumed on a per-unit of
usage basis. The compute costs are more difficult to
predict since they are determined by the users’ use of
the application. In this paper, we consider a virtual
SLA-backed service that is not entirely fixed in terms
of computational and storage resources allocated.
Finally, the actual capacity of the offered cloud
service may fluctuate over time affecting potential
economies of scale and application performance.
Only the cloud service provider, and not the SP, can
monitor the underlying service availability thus, the
first problem is right-scaling i.e., to size a predicted
workload to a machine (configuration) profile. This
requires usage prediction to configure IaaS or PaaS
through an experimental pre-migration feasibility
study, and represents the basis for an accurate
estimation of operational costs. For SPs, right-scaling
reduces overprovisioning and therefore usage cost of
their cloud infrastructure.
3.2 Problem 2: Right-Pricing of
SaaS-delivered Products
Monetization refers to how organizations capture
value i.e. when, what and how value is converted into
money (Baden-Fuller and Haefliger 2013). Despite
the fact that how SPs price and monetize their cloud
offering is beyond the scope of the TCO framework
adopted in this paper, it is important to understand as
the TCO represents a critical component of SPs’
pricing decision. A monetization framework for SPs
usually comprise three models, namely:
Architecture model: the source and target
architecture need to be considered together
with planned changes in functional or non-
functional properties;
Cost model: the expected direct operational
costs need to be estimated including basic
infrastructure and platform costs, additional
features for external access and networking,
internal quality management, and development
and testing costs, and mapped into the TCO
estimation;
Revenue model: expected revenues based on a
selected pay-per-use or subscription model.
From an SP perspective, the relationship between
cloud cost and price (P) can represented as follows:
=×
1+
(1)
Where μ represents the percentage of profit the
producer aims to obtain. Understanding how SaaS
usage translates in to IaaS costs is of primary
importance for SPs since the SaaS income should
cover the corresponding infrastructure costs. The
interplay between these three models ultimately
determines the attractiveness of the cloud offering of
an SP in the marketplace.
Relevant questions are: (a) which factors are static
and might be considered as a baseline for the cost
calculation? (b) What are the additional costs for
scaling up beyond the baseline? And (c) what is the
best combination of cost and revenue model that
maximize profit in the short- and long-term?
3.3 Total Cost of Ownership and Cost
Factors
TCO in a strict sense, is the sum of the initial
investment required to purchase an asset (CapEx)
plus the operating costs that the cloud generates
(OpEx). When choosing among alternatives, SPs
should look at both components of TCO to evaluate
the investment properly. Migration costs tend to be
omitted in cloud TCO estimations even though they
can be substantial and change the overall return on
investment. TCO calculation can be formalized as
follows:
= +
(2)
In the context of our study, OpEx includes fixed
(e.g. location and size) and variable (i.e., usage) IaaS
Cost components while CapEx includes migration
and implementation costs (e.g. development and
testing, project management etc.). Walterbusch et al.
(2013) provide a comprehensive list of cost
components that may be considered for estimating
TCO of SP cloud migration.
In order to estimate the cost associated with the
expected SaaS usage, we consider costs at the SP
level. In terms of IaaS operational costs for an SP we
focus on compute, storage and network resources
since they usually represent the most significant cost
components. IaaS costs can be categorized as (i) fixed
(size, availability, location, and other supplemental
and/or premium services), or (ii) variable (i.e., usage
of all respective IaaS resources). Like other fixed cost
factors, reconfiguration is possible, but not
considered in this paper. Availability is considered as
a contractually guaranteed property and it is assumed
to be fixed.
Making the Cloud Work for Software Producers: Linking Architecture, Operating Cost and Revenue
367

4 IaaS COST CALCULATION
PROCESS
The nature of the cloud makes it difficult to determine
the input variables of the TCO model, but, we will
see, architecture quality concerns such as
performance and availability can drive this process.
Cloud architecture qualities, and corresponding costs,
can be influenced by compute, storage and network
resources. Figure 1 summarizes the cost estimation
process that we will now apply.
Figure 1: Costing SaaS Usage - Estimation Process.
4.1 Cost Estimation Process
In a cloud migration scenario, an SP needs to migrate
the system architecture of the product and change the
corresponding cost and revenue models at the same
time. As highlighted before, the new models heavily
depend on expected or predicted usage, both of which
are difficult to estimate. In fact, any estimation of
SaaS usage volumes will determine IaaS usage
requirements but customers’ usage can be subject to
temporary peaks that might generate spikes in costs
due to ineffective IaaS usage.
Estimation complexity varies between the two
business cases identified earlier, i.e., migrated or
cloud-native application. Usage patterns of the
existing customer base can be determined with
reasonably high accuracy, as opposed to an expansion
into a new a customer base with unknown behavior.
process for costing a SaaS service from an SP
perspective. The initial two phases are about usage
estimation at both the SaaS and IaaS level. SaaS
usage can be mapped onto IaaS by experimental
means using feasibility studies or other mechanisms.
A third phase is concerned with IaaS cost estimation,
which is driven by the usage estimation and SLA
obligations. IaaS configuration heuristics can be used
to identify the most efficient infrastructure
configuration. The fourth and final phase is related to
pricing the SaaS service based on the outcome of the
previous stages.
4.2 Architecture Selection and
Cost/Revenue Prediction
From an SP perspective, the selection criteria of a
cloud provider include fees and billing model. Many
IaaS providers offer monthly basic subscription fees
with additional fees for premium services such as
scalability, access (e.g., IP endpoint, network
bandwidth) or monitoring and advanced self-
management. An SP requires a clear comparison of
costs and revenues resulting from the cloud adoption.
This has to be an “apples to apples” comparison
(ISACA, 2012). Even though we primarily discuss
IaaS, similar assumptions can be made for PaaS
services. PaaS-level costs need to address both
development and deployment and need to be aligned
with SaaS-level income.
4.3 Heuristics – Resource Cost
Modeling and Right-Scaling
In order to make this more practically relevant, we
can look at the different resource types and compare
them in terms of utilization and cost fluctuations in
common deployments (and resulting impact on cost
estimation).
Cost modeling for compute versus storage services
are fundamentally different. Storage is more
predictable and current cloud service pricing models
support a commodity-style costing. Compute cost is
more complicated to predict and contributes
disproportionately to the achievement of economies
of scale. SPs need to make configuration assumptions
which may or may not prove to be accurate. Scenario
analysis may help to achieve better estimation.
For illustration purposes, a simple initial
configuration of IaaS resources could be based on 80
percent reserved and 20 percent on-demand instances.
This combines reliable core provisioning without
overprovisioning for extra demand (in which case on-
demand instances are acquired). The benefits of this
strategy are:
60-80 percent utilization of used instances is
achievable if the reserved instances deal with
peak demand;
Up to 50 percent cost reduction compared to
on-demand instances only.
Another factor impacting resource requirement is the
nature of the architecture. Stateless, loosely-coupled
architectures help accommodate extra demand and
enable scalability by just using additional resources
on-demand without much start-up costs (transfer of
state to other resources).
4.4 An Exemplar Pricing Model
In order to understand pricing models of IaaS and
PaaS providers, we report exemplar categories and
common pricing models (Table 1). This is largely
Estimate
SaaS Usage
Estimate
I/PaaS Usage
Cost I/PaaS
Usage
Cost SaaS
Usage
CLOSER 2018 - 8th International Conference on Cloud Computing and Services Science
368
built on Azure pricing information, but is typical of
other providers.
Relevant pricing models focus primarily on storage in
GB and transactions (read/write). A proper estimation
of IaaS costs associated with a SaaS application
provisioning is needed in order to (i) select the
technically best option, and (ii) estimate the costs for
hosting the SaaS application, for example, in a PaaS
cloud. Quality concerns other than the expected
workload (e.g. availability expectations, failover
strategy etc.) have to be considered in the process as
well. Effectively, the estimation process needs to
include the number of storage units and total size as
an input, and the costs, estimated over a defined
period, with predicted growth, and for different
replication options as an output.
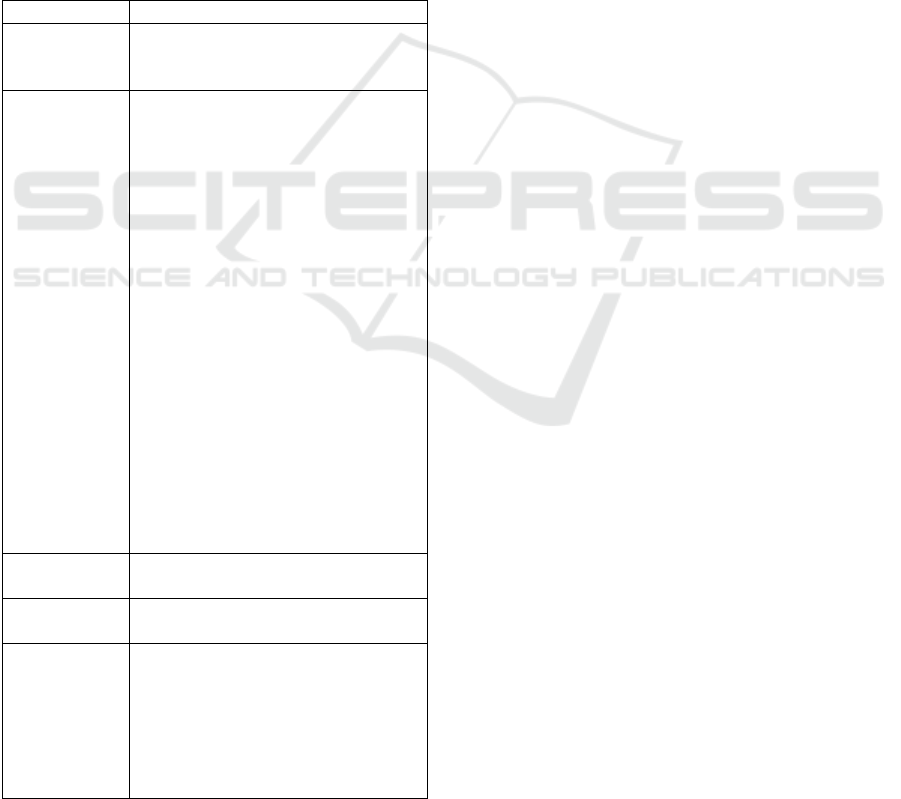
Table 1: Storage Cost Component.
Component Description
Region Slightly different rates might apply per
region (relevant if data location
regulations apply).
Replication It is a mechanism to deal with down-
time and increase reliability. Sample
configurations:
Local Redundant – a number of copies
of data, all in the same data-center and
region of the storage account, across
different fault or upgrade domains.
Zone Redundant – a number of copies
of data, all in different data-centers,
which has slightly less throughput than
Local redundancy.
Geo Redundant – a number of copies of
data, all in different data-centers, with a
back-up, separate multiple saves in a
specific secondary region to allow to
recover from Region failure.
Read-Only Geo Redundant – the same
as geo redundancy with read access to
secondary data.
All replication operations are done
asynchronously.
Size It depends on actual amount of Gbytes
stored.
Transactions Number of Read/Write Blob
Operations.
Data Transfer It is measured. Sample costing:
Data Ingress Network Data Transfer is
free.
Data Egress Network Data Transfer is
free if in the same region.
Data Egress Data Transfer between
regions or out of a region is charged.
A further complication is that pricing models between
platform providers are difficult to compare due to
different definitions of price components.
Consequently, a formal and clear estimation
framework for an economic evaluation of different
solutions to deliver a SaaS service is needed.
5 CLOUD-NATIVE PaaS
ARCHITECTURE MAPPING
In the previous section, we discussed the
implementation of a SaaS product on an IaaS set of
services. Now we consider the adoption of PaaS to
provision a SaaS product. We assume here a
migration to a PaaS architecture to be cloud-native in
style, i.e., platform services, such as databases, are
provided as packaged services in a microservice style.
The migration to PaaS is more demanding
particularly where many native PaaS services are
used. Notwithstanding this, the cost estimation may
be easier. This will also further clarify the impact of
cloud software architecture on costs and revenues.
5.1 PaaS Migration
From an SP perspective, a PaaS solution has two main
benefits: (i) development costs can be mapped and
associated with the migration, and (ii) more accurate
estimation of deployment costs.
An important consideration for SPs is whether to fully
adopt the cloud as both a delivery and a development
platform. While moving software development to a
PaaS cloud allows software producers to further
reduce upfront capital expenditure, it may limit
technical options in the future. Another important
consideration is whether to have a staged migration.
Through basic virtualization, a simple VM-based
IaaS solution might emerge. The ultimate objective
would be to move from VMs to so-called cloud-
native applications at the platform level that utilize
fully cloud-based services for development and
deployment. Consequently, this provides a more
metered and granular cost model.
5.2 Staged Migration Towards
Cloud-Native
For illustration purposes, we assume that the SP
wishes to migrate a traditional stacked application
with application, middleware, DBMS and disk
storage support that runs in an on-premise setting, to
Making the Cloud Work for Software Producers: Linking Architecture, Operating Cost and Revenue
369

the cloud. A stepwise migration from on-premise via
IaaS into a PaaS cloud can happen as follows:
Phase 1 – IaaS Compute Architecture: The
application can be packaged into VMs. License
fees for components of the application are
incurred as usual. The business problem is
scaling out; adding more VMs means adding
more license fees for every replicated
component. From a technical point of view,
multiple copies of data storage that are not in
sync might cause integrity problems.
Phase 2 – DaaS Storage: Refactor and extract
storage i.e. use a virtual data-as-a-service
(DaaS) solution for storage needs. This
alleviates the technical integrity problem cited
above.
Phase 3 – PaaS Cloud Data Storage: Package
the whole DBMS into single virtual machine.
This alleviates the business license fee problem
for the DBMS and simplifies data management,
but other license fees may still occur.
Phase 4 – Full Application Migration: Migrate
to a PaaS service. Apart from solving technical
problems, this significantly mitigates the
licensing fees issue.
This process results in a so-called cloud-native
application, which is scalable/elastic, clusterable,
multi-tenancy, pay-per-use, and self-service.
6 ILLUSTRATION AND
VALIDATION – CASE STUDY
We now illustrate the estimation process presented in
Section V using a case study. The estimation process
was applied to an SP migrating a legacy client-server
on-premise single-tenant enterprise application to the
cloud by re-designing, re-engineering and recoding
the system as a cloud application. The SP is a small-
medium enterprise which provides a document
management application. Its application has over
1,000 existing client installs and in this case study, we
present the TCO estimation of migrating 240 of these
to the new cloud platform over a 3-year period. The
main business requirements for the SP to adopt the
cloud were (i) to pursue flexibility across different
devices and situational contexts, and (ii) to increase
the customer base through new market entries. The
solution requires meeting high-volume data storage
and processing needs.
6.1 Application Overview
The application is a Document Management System
(DMS), which enables a user to scan paper documents
from enterprise-grade scanners and save them on a
cloud store as electronic images. Documents are
classified under custom types, such as invoice or
delivery docket, and specific metadata templates are
used to store searchable tagged data against the
documents for future retrieval and reporting. The
application has been designed and coded specifically
to run as a cloud application on the Microsoft Azure
public cloud platform.
6.2 TCO Calculation
The TCO is made up of the implementation costs of
the new cloud application and the cloud charges
incurred in running the new system on Microsoft
Azure.
Estimated implementation costs (CapEx) were
classified into seven implementation phases:
Business Analysis, Cloud Architecture Design, Data
Design, Security Framework Design, Development
and Test, Performance and Costs Analysis. It should
be noted that the calculations do not include the
operational costs of migrating the customers to the
new cloud web application.
The application is a multi-process system since it
comprises a web server compute resource and a
separate image processing compute resource.
However, the functional dependency between these
do not need to be considered in the TCO analysis
since the image processing worker VM acts
completely asynchronously to the web server role
web requests which continue regardless of the state of
the image processor. Therefore, we have calculated
the multi-tenant VM requirements based on a simple
linear multiplication of the CPU load per tenant.
IaaS usage charges (OpEx) are estimated considering
the two most relevant cost components:
A cloud data store – made up of a NoSQL Table
structure (using the Azure Table service) and
an object store (using the Azure Blob Storage
service). Table and blob storage are platform
services that allow a more fine-grained costing.
As such, these need to be considered on an
individual service base.
A cloud compute architecture – made up of a
separate compute resource for the web server
of the web application (Web Role Virtual
Machine), and a separate compute component
for carrying out the image processing
functions, such as barcode reading (Worker
Role Virtual Machine).
Our calculation is based on the Azure services pricing
reported in Tables 2, 3, and 4. In order to forecast the
CLOSER 2018 - 8th International Conference on Cloud Computing and Services Science
370
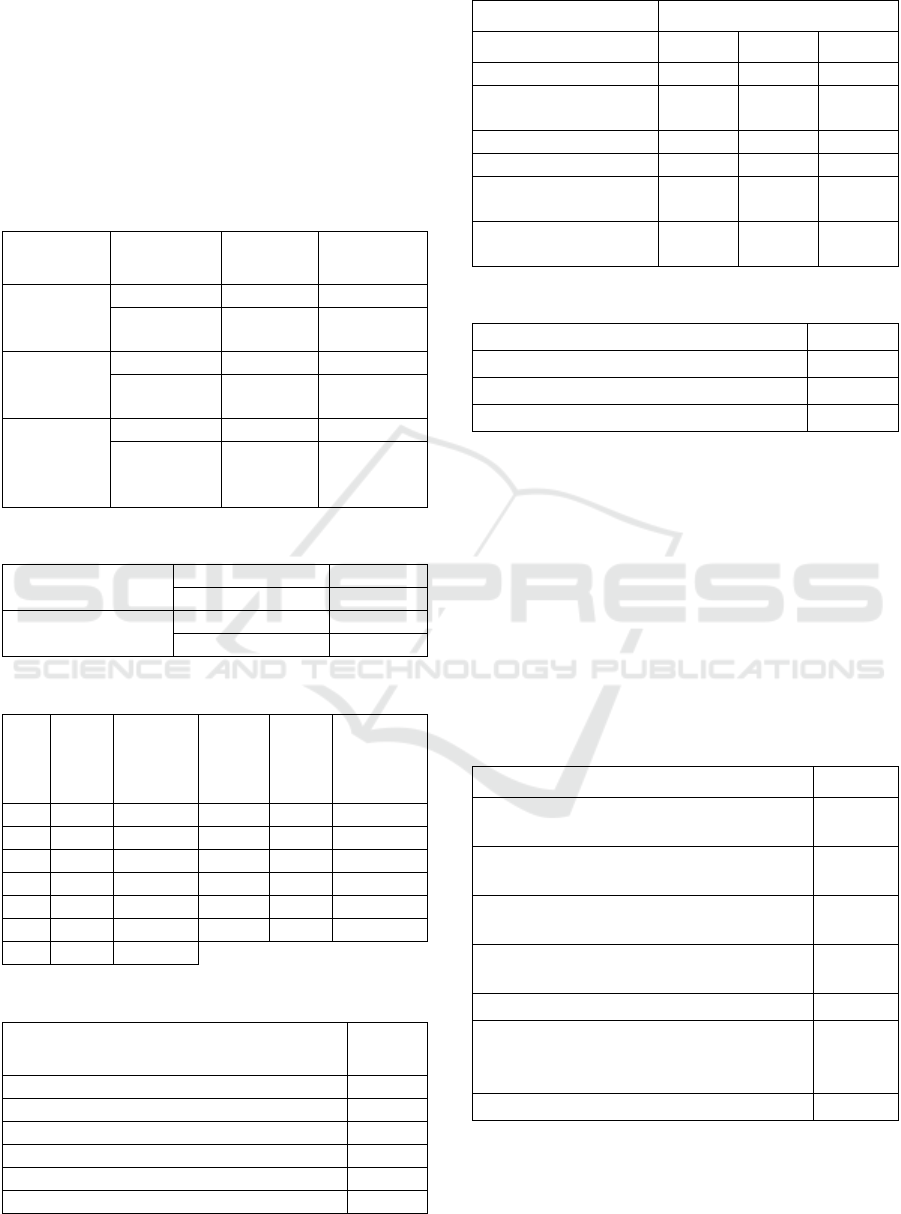
usage of cloud storage resources, we used actual
historical data over an eleven-month period from an
existing average-sized tenant with a typical
application usage pattern. To estimate the computing
resources required, we monitored the usage and
performance statistics during a snapshot of the
operational use of the application by the same typical
user. Tables 5, 6, and 7 summarize the usage profile
adopted in the calculation.
Table 2: Blob Storage Prices.
Service Redundancy Cool Tier
General
Purpose
Price per
GB/Month
space
Local € 0.013 € 0.020
Geo € 0.025 € 0.041
Price per
10,000
transactions
Local € 0.084 € 0.003
Geo € 0.169 € 0.003
Price per
GB data
access
write
Local € 0.002 -
Geo € 0.004 -
Table 3: Table Storage Prices.
Price per
Entity/GB/Month
Local Redundant € 0.059
Geo Redundant € 0.085
Price per 10,000
transactions (PUT)
Local Redundant € 0.003
Geo Redundant € 0.003
Table 4: Compute Prices.
VM
Type
No. of
CPU
Cores
Annual
cost
Azure
VM (€)
VM
Type
No. of
CPU
Cores
Annual
cost Azure
VM (€)
a1 1 602.4 d4 8 8,937.00
a2 2 1,204.68 d1 v2 1 1,114.32
a3 4 2,409.36 d2 v2 2 2,236.20
a4 8 4,818.60 d3 v2 4 4,464.72
d1 1 1,114.32 d4 v2 8 8,937.00
d2 2 2,236.20 d5 v2 16 17,873.88
d3 4 4,464.72
Table 5: Usage Profile of a Typical Tenant.
Total Number of Scanned Documents per
annum
145,853
Average Document Table Entities per Month 14,675
Peak Entities per Day 3,551
Peak Entities per Hour 1,137
Average Table Entity Size in Bytes 2,160
Average Scanned Image File Size in KB 666
Average Template File Size in Bytes 2,200
Table 6: Forecasted Input Parameters.
Per Tenant End of Year
1 2 3
No. of documents 176,105 352,210 528,314
Document table size
(GB)
0.380 0.761 1.141
No. of image blobs 176,105 352,210 528,314
Image blobs size (GB) 117 235 352
Document Template
File Blobs
2 3 6
Total Template blob
storage (bytes)
4,400 8,800 13,200
Table 7: Summary Parameter Values.
Web Role Peak CPU Load 67.1%
Web Role Average CPU Load 31.5%
Worker Role Peak CPU Load 24.3%
Worker Role Average CPU Load 10.4%
6.3 Experimentation – Usage and Cost
Table 8 summarizes the estimated implementation
and migration costs for the SP (€168,647). The most
significant cost component, which represents 47.83%
of the overall migration costs, is by far consultancy
costs for design and development, followed by
security design (16.15%). Such a significant amount
of upfront migration costs further highlights the need
to include such costs into TCO estimation to inform
both adoption and pricing decisions.
Table 8: Migration and Implementation Costs.
Implementation Phase Cost (€)
Implementation Consultancy Costs –
Business Analysis (Contract hours)
16,078
Implementation Consultancy Costs –
Security Design (Contract hours)
27,237
Implementation Consultancy Costs –
Design and Development (Contract hours)
80,662
Project Management and Implementation
Design (Staff Salaries)
16,265
Development and Testing (Staff Salaries) 17,465
Non-Staff or Non-Contractor Costs
(Cloud Testbed subscription, test
equipment, travel)
10,940
Total 168,647
Tables 9, 10, and 11 summarize IaaS usage costs
estimated as a linear combination of usage parameters
and price of each service.
Making the Cloud Work for Software Producers: Linking Architecture, Operating Cost and Revenue
371
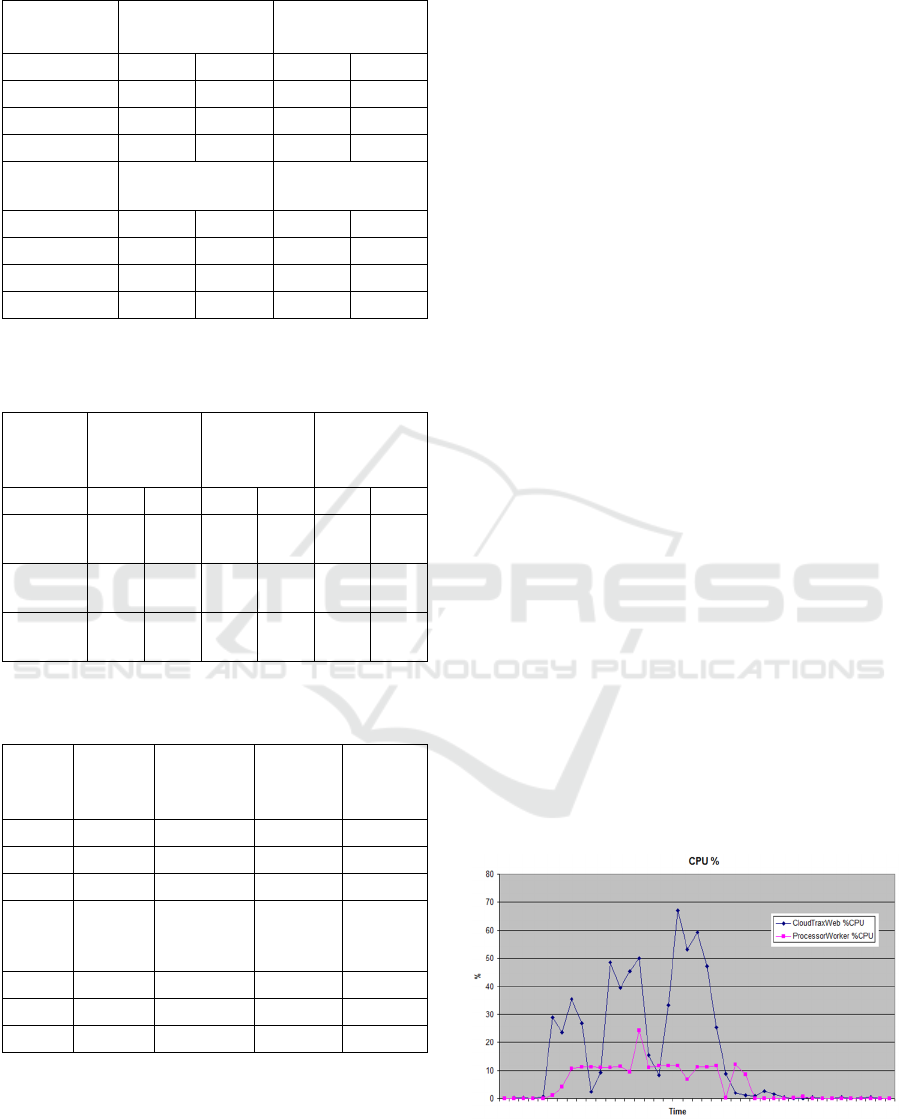
Table 9: Blob Storage Costs.
Costs per
tenant
Space Cost (€)
Transactions Cost
(€)
Redundancy Local Geo Local Geo
End year 1 8.87 17.80 1.48 2.97
End year 2 26.60 53.41 1.48 2.97
End year 3 44.33 89.02 1.48 2.97
Data Access
Write Cost (€)
Total Cost (€)
Redundancy Local Geo Local Geo
End year 1 1.48 2.96 11.83 23.73
End year 2 4.43 8.87 32.52 65.25
End year 3 7.39 14.78 53.21 106.77
Note: Blob storage costs for template files were ignored due to their
negligible amount.
Table 10: Table Storage Costs.
Costs
per
tenant
Space Cost
(€)
Transaction
s Cost (€)
Total Cost
(€)
Redund. LR GR LR GR LR GR
End
year 1
0.13 0.19 0.05 0.05 0.19 0.25
End
year 2
0.40 0.58 0.05 0.05 0.46 0.63
End
year 3
0.67 0.97 0.05 0.05 0.73 1.02
Note: LR (Local Redundant); GR (Geo Redundant); Redund.(Redundancy)
Table 11: Compute Costs.
End
year
Clients
migrated
Number
of VMs
(WeR)
Number
of VMs
(WoR)
Storage
Costs
(LR) (€)
1 80 5 2 946
2 80 14 5 3,548
3 80 24 8 7,805
Storage
Costs
(GR) (€)
Compute
Costs
(WS) (€)
Comput
e Costs
(IP) (€)
1 80 1,898 11,181 4,473
2 80 7,118 31,307 11,181
3 80 15,660 53,669 17,890
Note: WeR (Web Role); WoR (Worker Role); LR (Local Redundant); GR
(Geo Redundant); WS (Web Server VMs);IP (Image Processing VMs).
The use case we present in this paper involves a
significant image-processing component resulting in
high upload- and download- volumes and the in-cloud
processing of images. The most critical challenge at
the architectural level was to select the optimal
Virtual Machine type from the available types on the
Azure platform; we carried out a benchmark study of
the performance of the different “flavors” of the role
VMs, when running the data layer functions of the
new application. The costs presented in Tables 9, 10,
and 11 are based on the D2-v2 VM type which
represented the best trade-off between TCO and SLA
requirements on the basis of the average tenant usage.
Among different TCO components, compute is by far
the most significant (€129,701), and also the most
fluctuating resource (see Figure 2). As such, its
efficient and effective usage should be the main
concern of the SP. Storage, as predicted, is relatively
stable and predictable with essentially fixed costs (see
Figure 3), and accounts for a very tiny portion of the
TCO (€293.31 – 0.001%).
The heavy image processing, results in higher-than-
normal network bandwidth and storage requirements.
As a consequence, the observations should also hold
for applications with less data volume and would thus
cover the majority of typical transactional business
applications.
Note that these pragmatic/empirical observations
stem from experiments in a live feasibility study, and
have been implemented on the basis of the following
assumptions:
The existing deployment does not include any
data caching which would obviously reduce the
CPU overhead and data storage access costs.
No optimization of the queries to the table
service to optimize CPU load over the TCO
estimation period.
No performance tuning on the application
and/or on the platform during the TCO
estimation period.
There is no smoothing effect of multiple
tenants sharing the same application compute
resources.
Figure 2: Compute Usage Over a Twenty-Minute
Monitoring Period.
CLOSER 2018 - 8th International Conference on Cloud Computing and Services Science
372
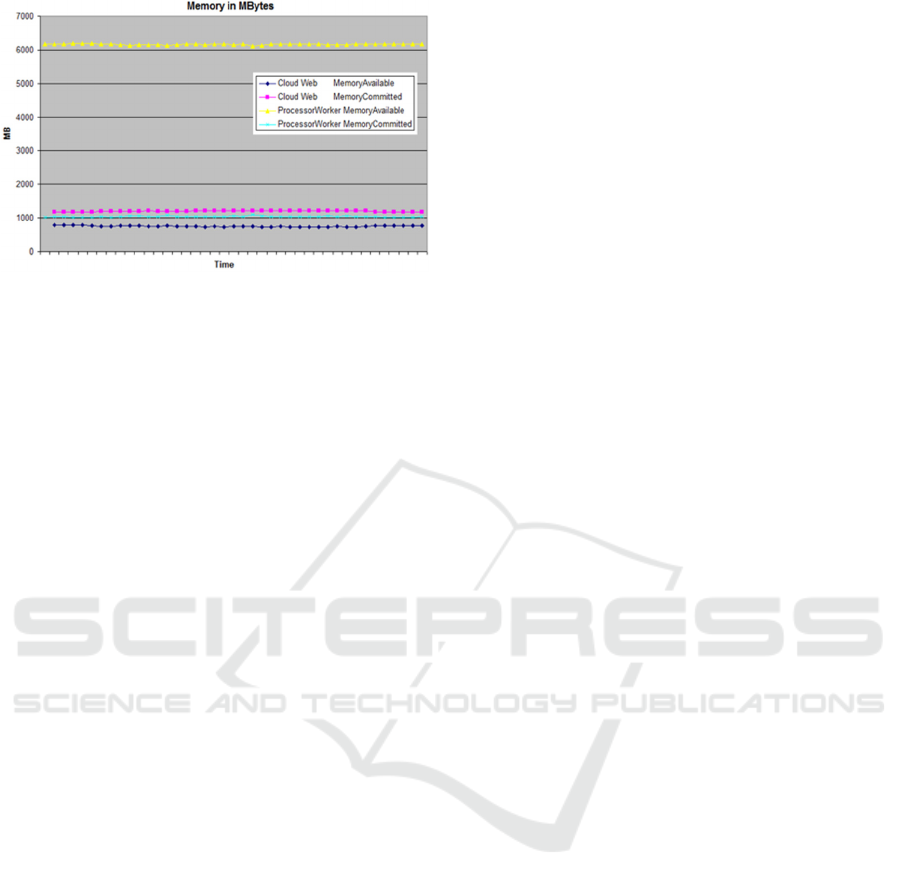
Figure 3: Storage Usage Over a Twenty-Minute Monitoring
Period.
7 CONCLUSIONS AND FUTURE
DEVELOPMENTS
Research has covered costing and migration
separately. Our literature review did not identify a
detailed framework that integrated both costing and
software architecture within a cloud migration
scenario. An investigation linking architectural
decisions and the impact on costing in cloud
migration is therefore important and this paper makes
an initial contribution in this context (Li et al., 2011).
We have identified the major components and
integrated them into an integrated framework to
estimate the cost of hosting a SaaS application on an
IaaS or PaaS platform, and to use this as the basis of
a SaaS licensing model. As a generic, formalized
model cannot exist due to the differences in factors
and account types between the IaaS/PaaS providers,
our aim was to identify the factors influencing this
calculation and to illustrate this through a real case
study.
No single formula, which allows right-scaling and
right-pricing to be easily determined, was identified
in our literature review. In this paper, we propose:
An approach for cost estimations in cloud
migration.
Heuristics for providing better estimation
accuracy.
An experimental determination of usage and
cost patterns for reliable cost.
We have focused on a business-to-business SP thus
our conclusion is not directly generalizable to
business-to-consumer SPs and consumer buyers.
Similarly, we have focused on migration and
operational costs as the primary cost unit and fees
paid as the main components of the cost of ownership.
Cloud adoption, like all IT investments, results in
direct tangible costs such as cloud resources but also
in intangible costs, e.g., change management, vendor
management, risk mitigation etc. (Misra and Mondal,
2011). We sought to explore and illustrate a relatively
simple but practical process for cost estimation in
cloud migration targeting small and medium
enterprises. Further studies may account for more
complex models suitable for larger and more mature
organizations. Similarly, we limited our case study to
one cloud service provider and a small number of
services. Future studies may seek to compare
functionality, quality and costs, but this stage has
been neglected in the literature (Gilia and S. Sood,
2013).
From an architecture perspective, container
technology and micro-service style architectures are
an increasing feature in the enterprise cloud and are
impacting cloud-native architectures. New
provisioning and payment models moving away from
pay-per-hour models towards payment by business
cycles are emerging in PaaS, linking the SaaS
provisioning costs for the software producer with the
platform.
Cloud service providers are also innovating in ways
that will impact how software producers
conceptualize costs and pricing. For example, AWS
Lambda is a compute service where code is uploaded
and the Lambda service executes the code using the
AWS infrastructure. The uploaded code is used to
create a so-called Lambda function. The AWS
Lambda service then handles provisioning and
managing the servers to run the code. The charging
model is innovative in that the user is charged based
on the number of requests for the software producers
functions and the time the software producer code
executes. Google has recently announced a similar
Cloud Functions model. These initiatives are too
recent to allow a deeper analysis of concerns.
However, they are worthwhile future research.
Our work shows that an integrated perspective
accommodating architecture, cost and revenue is
needed and that the traditional TCO approaches
cannot be applied without adaptation. Our paper
highlights the need for collaboration between
business, accounting and computer science
researchers in order to understand the implications for
costing, pricing and software design in the cloud
computing context. This may require not only
adaptation in common activity-based and resource-
based costing methodologies but also in software and
systems design.
ACKNOWLEDGEMENTS
The research work described in this paper was
supported by the Irish Centre for Cloud Computing
Making the Cloud Work for Software Producers: Linking Architecture, Operating Cost and Revenue
373

and Commerce, an Irish National Technology Centre
funded by Enterprise Ireland and the Irish Industrial
Development Authority.
REFERENCES
Andrikopoulos, V., Song, Z. and Leymann, F., 2013.
Supporting the migration of applications to the cloud
through a decision support system. IEEE Sixth
International Conference on Cloud Computing.
Anwar, A., Sailer, A., Kochut, A., Schulz, C.O., Segal, A.
and Butt, A.R., 2015. Cost-Aware Cloud Metering with
Scalable Service Management Infrastructure. CLOUD,
IEEE, pp. 285-292.
Armbrust, M., Fox, A., Griffith, R., Joseph, A.D., Katz, R.,
Konwinski, A., Lee, G. Patterson, D., Rabkin, A.,
Stoica, I. and Zaharia, M., 2010. A view of cloud
computing. Communications of the ACM, Vol. 53, No.
4, 2010, pp.50-58.
Baden-Fuller, C. and Haefliger, S., 2013. Business models
and techno-logical innovation. Long range planning,
Vol. 46, No. 6, 2013, pp.419-426.
Bain and Company, 2017. The Changing Faces of the
Cloud. Available from: http://www.bain.com/
publications/articles/the-changing-faces-of-the-
cloud.aspx [January 25, 2017].
Berman, S.J., Kesterson-Townes, L., Marshall, A. and
Srivathsa, R., 2012. How cloud computing enables
process and business model innovation. Strategy &
Leadership, Vol. 40, No. 4, pp.27-35.
CFO Research, 2012. The Business Value of Cloud
Computing: A Survey of Senior Finance Executives.
CFO Publishing. Available from: http://lp.google-
mkto.com/rs/google/images/CFO%2520Research-Goo
gle_research%2520report_061512.pdf [June, 2012].
DaSilva, C.M., Trkman, P., Desouza, K. and Lindic, J.,
2013. Disruptive technologies: a business model pers-
pective on cloud computing. Technology Analysis &
Strategic Management, Vol. 25, No. 10, pp. 1161-1173.
Dillon, T., Wu, C. and Chang, E., 2010. Cloud computing:
issues and challenges. IEEE international conference
on advanced information networking and applications,
pp. 27-33.
Durkee, D., 2010. Why Cloud computing Will Never Be
Free. Communications of the ACM, Vol. 53, No. 5,
2010, pp. 62-69.
Ferrante, D., 2006. Software Licensing Models: What’s Out
There?. IT Professional, Vol. 8, No. 6, pp.24-29.
Filiopoulou, E., Mitropoulo, P. and Tsadimas, A., 2015.
Integrating cost analysis in the cloud: A SoS approach.
11th International Conference on Innovations in
Information Technology (IIT).
Giardino, C., Bajwa, S.S., Wang X. and Abrahamsson, P.,
2015. Key Challenges in Early-Stage Software
Startups. XP Conference 2015.
Gilia, P. and Sood, S., 2013. Automatic Selection and
Ranking of Cloud Providers using Service Level
Agreements. International Journal of Computer
Applications, Vol. 72, No. 11, pp. 45-52.
Han, Y., 2011. Cloud computing: case studies and total
costs of ownership. Information technology and
libraries, Vol. 30, No. 4, pp. 198-206.
ISACA, 2012. Calculating Cloud ROI: From the Customer
Perspective. Available from: https://www.isaca.org/
knowledge-center/research/researchdeliverables/pages/
calculating-cloud-roi-from-the-customer-perspective.
aspx.
Jamshidi, P., Ahmad, A. and Pahl, C., 2013. Cloud
Migration Research: A Systematic Review. IEEE
Transactions on Cloud Computing, Vol. 1, No. 2, pp.
142-157.
Jamshidi, P., Pahl, C., Chinenyeze, S. and Liu, X., 2014.
Cloud Migration Patterns: A Multi-Cloud Service
Architecture Perspective. International Workshop on
Engineering Service Oriented Applications -
WESOA14.
Jinesh, V., 2010. Migrating your existing applications to the
aws cloud. A Phase-driven Approach to Cloud
Migration. Available from: http://docs.huihoo.com/
amazon/aws/whitepapers/Migrating-your-Existing-
Applications-to-the-AWS-Cloud-October-2010.pdf.
Leimbach, T., Hallinan, D., Bachlechner, D., Weber, A.,
Jaglo, M., Hennen, L., Nielsen, R.Ø., Nentwich, M.,
Strauß, S., Lynn, T. and Hunt, G., 2016. Potential and
Impacts of Cloud Computing Services and Social
Network Websites. Science and Technology Options
Assessment (STOA). Available from: http://www.
europarl.europa.eu/RegData/etudes/etudes/join/2014/5
13546/IPOL-JOIN_ET(2014)513546_EN.pdf. [15
August 2016].
Li, X., Li, Y., Liu, T. Qiu, J. and Wang, F., 2009. The
Method and Tool of Cost Analysis for Cloud
Computing. 2009 IEEE International Conference on
Cloud Computing, pp. 93-100.
Li, H., Zhong, L., Liu, J., Li, B. and Xu, K., 2011. Cost-
effective partial migration of VoD services to content
clouds. IEEE International Conference on Cloud
Computing, pp. 203-210.
Marston, S., Li, Z., Bandyopadhyay, S., Zhang, J. and
Ghalsasi, A, 1999. Cloud computing The business
perspective. Decision support systems, Vol. 51, No. 1,
pp.176-189.
Martens, B., Walterbusch, M. and Teuteberg, F., 2012.
Costing of cloud computing services: A total cost of
ownership approach. 45th Hawaii International
Conference on System Science (HICSS).
Misra, S.C. and Mondal, A., 2011. Identification of a
company’s suitability for the adoption of cloud
computing and modelling its corresponding Return on
Investment. Mathematical and Computer Modelling,
Vol. 53, No. 3, pp. 504-521.
Pahl, C. and Xiong, H., 2013. Migration to PaaS Clouds -
Migration Process and Architectural Concerns. IEEE
International Symposium on the Maintenance and
Evolution of Service-Oriented and Cloud-Based
Systems, pp. 86-91.
CLOSER 2018 - 8th International Conference on Cloud Computing and Services Science
374

Strebel, J. and Stage, A., 2010. An economic decision
model for business software application deployment on
hybrid cloud environments. Multikonferenz
Wirtschaftsinformatik, MKWI 2010.
Taibi, D., Lenarduzzi, V. and Pahl, C., 2017. Processes,
Motivations and Issues for Migrating to Microservices
Architectures: An Empirical Investigation. IEEE Cloud
2017.
Walterbusch, M., Martens, B. and Teuteberg, F., 2013.
Evaluating cloud computing services from a total cost
of ownership perspective. Management Research
Review, Vol. 36, No. 6.
Making the Cloud Work for Software Producers: Linking Architecture, Operating Cost and Revenue
375
