
The Calculation of Educational Indicators by Uncertain Gates
Guillaume Petiot
CERES, Catholic Institute of Toulouse, 31 rue de la Fonderie, Toulouse, France
Keywords:
Decision Making, Educational Information System, Possibility Theory, Possibilistic Networks, Uncertain
Gates.
Abstract:
Learning Management Systems allow us to retrieve a large scale of data about learners in order to better
understand them and how they learn. Thus, it is possible to suggest educational differentiated approaches
which take into account the students’ specific needs. The knowledge about the behavior of learners can be
extracted by datamining or can be provided by teachers. The available data is often imprecise and incomplete.
The possibility theory provides a solution to these problems. The modeling of knowledge can be performed by
a possibilistic network but it requires the definition of all Conditional Possibility distributions. This constitutes
a limitation for complex knowledge modeling. Uncertain Gates allow, as Noisy Gates in the probability theory,
the automatic calculation of Conditional Possibility Tables. The existing Uncertain MIN and Uncertain MAX
connectors are not sufficient for applications which need a compromise between both connectors. Therefore
we have developed new Uncertain Compromise connectors. In this paper, we will present an experimentation
of educational indicator calculation for a decision support system using Uncertain Gates.
1 INTRODUCTION
The main objective of Educational Data Mining is
to better understand students and how learners learn
in order to highlight the pedagogy which contributes
to learning (Huebner, 2013; Baker and Yacef, 2009;
Bousbia et al., 2010). The Learning Management
System Moodle is a useful tool for EDM and allows
us to retrieve data for further analysis in order to ana-
lyze them and adapt pedagogy to learners. Also teach-
ers have an expert knowledge of what contributes to
success at the examination. They can provide indica-
tors which highlight students with difficulties.
In this paper, we would like to perform an exper-
imentation of indicator calculation. For the experi-
mentation, we have chosen a course of Spreadsheet
program because of the available resources in Moo-
dle. The available information concerns attendance
to courses, groups, graduation and the result of the
students at the examination. Moodle provides infor-
mation about participation, results of the quiz and re-
sources consulted. The goal of this paper is to build
educational indicators in a decision support system.
Several studies on our problem have been per-
formed in the last years. They use a Bayesian Net-
work, Neural Networks, Support Vector Machines
with the main objective to detect the students with dif-
ficulties who risk to drop out or fail at the examination
(Huebner, 2013).
One of the problems is that the modeling of
knowledge is often imprecise and uncertain. The pos-
sibility theory introduced by (Zadeh, 1978) is a solu-
tion to this problem. Since knowledge can be repre-
sented by a Directional Acyclic Graph, it can be eval-
uated by possibilistic networks. The possibilistic net-
works (Benferhat et al., 1999; Benferhat and Smaoui,
2004) are adaptations of the Bayesian Network (Pearl,
1988; Neapolitan, 1990) to the possibility theory. The
building of the Conditional Possibility Tables (CPTs)
is often complex. Indeed, the number of parameters
of the conditional possibility distribution grows ex-
ponentially depending proportionally on the number
of variables. So it can be more easy to use logical
gates between the variables, as in the Noisy Gates
of the probability theory, in order to build automati-
cally the CPT. Moreover, it is difficult to have a per-
fect model of knowledge. There are often unknown
variables which contribute to the spurious behavior of
the models. So the solution is to add a leaky variable
to the models to represent the unknown knowledge.
This paper is structured in 4 main sections. Firstly,
we will present possibilistic networks and Uncertain
Gates, then we will propose a new Uncertain Gate
connector, which performs a weighted average, and
Petiot, G.
The Calculation of Educational Indicators by Uncertain Gates.
DOI: 10.5220/0006671303790386
In Proceedings of the 20th International Conference on Enterprise Information Systems (ICEIS 2018), pages 379-386
ISBN: 978-989-758-298-1
Copyright
c
2019 by SCITEPRESS – Science and Technology Publications, Lda. All rights reserved
379

present the algorithm implementation. In section 3,
we will describe our experimentation and the model-
ing of knowledge. Finally, in section 4, we will ana-
lyze the main results of our experimentation.
2 UNCERTAIN GATES
The Uncertain Gates are an analogy to Bayesian
Noisy Gates in the possibility theory. The latter was
presented for the first time in (Zadeh, 1978). This the-
ory proposes to use a possibility distribution to repre-
sent imprecision and uncertainty. For example, let X
be a variable and π : R → [0, 1] a possibility distri-
bution with R the domain of X. Therefore π(x) = 0
means that X = x is not possible and π(x) = 1 means
that the value X = x is possible.
Authors in (Dubois and Prade, 1988) defined the
possibility measure Π and the necessity measure N.
The possibility measure is a function defined from the
set of parts P(X) of X in [0,1]:
∀A ∈ P(X ), Π(A) = sup
x∈A
π(x) (1)
The dual necessity measure is a function on the set
of parts of P(X) of X, in [0,1]:
∀A ∈ P(X ), N(A) = 1 −Π(¬A) (2)
Let X and Y be two variables, if x ∈ X and y ∈ Y ,
we can define a joint possibility distribution π(x,y)
on the Cartesian product X ×Y . One can define the
marginal possibility π
X
(x):
∀x ∈ X , π
X
(x) = sup
y∈Y
π(x,y) (3)
There are also conditional possibility and condi-
tional independence in the possibility theory. As a
reminder, if we have three variables X, Y, Z, we can
say that X is independent of Y conditionally to Z (
X⊥Y | Z), if and only if for all instances z of Z, the
values of the instances x of X, never change for all
instances y of Y:
π(x/y,z) = π(x/z) (4)
The possibilistic networks (Benferhat et al., 1999;
Borgelt et al., 2000; Caglioni et al., 2014) are like
Bayesian networks in the sense that they are based
on d-separation, conditional independence (Amor and
Benferhat, 2005), and factoring property. The d-
separation is a fundamental graphic property in causal
reasoning. If there are three variables X, Y and Z and
X is d-separated of Y by Z, then Z is blocking for
all information between X and Y, and Z is the only
known information in the graph. The factoring rela-
tion can be defined from joint possibility distribution
Π(V ) for a DAG G = (V, A) with V the variables and
A the arcs. Π(V ) can be factorized toward the graph
G:
Π(V ) =
O
X∈V
Π(X/Pa(X)) (5)
With Pa the parents of the node X. The combina-
tion rule must be associative. In this study we have
chosen the minimum for
N
.
Let us now introduce the notion of Indepen-
dence of Causal Influence as described in (D
`
ıez and
Drudzel, 2007; Heckerman and Breese, 1994). We
can have a set of causal variables X
1
,..., X
n
which in-
fluence the result of another variable Y also called
effect variable. So we can write the equation Y =
f (X
1
,..., X
n
) where f is a deterministic function. One
can introduce an intermediate variable Z
i
for each X
i
,
and a leaky variable Z
l
which represents the unknown
knowledge in the model. In the probability theory we
obtain the following graph:
Figure 1: Causal graph.
ICI means that if the variables Z
i
depend on
the variables X
i
and Y depend on the variables Z
i
,
then there is no causal interaction in the effects of
the variables X
i
on the variable Y. We can calcu-
late P(Y |X
1
,..., X
n
) by marginalizing the variables Z
i
(D
`
ıez and Drudzel, 2007) as below:
P(Y |X
1
,...,X
n
) =
∑
Z
1
,...,Z
n
P(Y |Z
1
,...,Z
n
) × P(Z
1
,...,Z
n
|X
1
,...,X
n
)
P(Y |X
1
,...,X
n
) =
∑
Z
1
,...,Z
n
P(Y |Z
1
,...,Z
n
) ×
n
∏
i=1
P(Z
i
|X
i
)
where P(Y |Z
1
,...,Z
n
) =
1 if Y = f (Z
1
,...,Z
n
)
0 else
As a result for instanced variables we obtain:
P(y|x
1
,..., x
n
) =
∑
z
1
,...z
n
:y= f (z
1
,...,z
n
)
n
∏
i=1
P(z
i
|x
i
) (6)
ICEIS 2018 - 20th International Conference on Enterprise Information Systems
380

Authors in (D
`
ıez and Drudzel, 2007) provide a
description of the functions f . The most commonly
used functions are the AND, OR, NOT, INV, XOR,
MAX, MIN, MEAN, and linear combination. We can
by analogy propose the same formula for the possi-
bilistic model with ICI:
π(y|x
1
,..., x
n
) = max
z
1
,...,z
n
:y= f (z
1
,...,z
n
)
⊗
n
i=1
π(z
i
|x
i
) (7)
The ⊗ is the minimum. The CPT is obtained by
calculation of the previous formula. For binary vari-
ables the possibility table between the variables X
i
and
Z
i
is:
π(Z
i
|X
i
) x
i
¬x
i
z
i
1 0
¬z
i
κ
i
1
If we have three ordered levels of intensity such
as low, medium and high, as in our application, we
can encode the modality by an intensity level as in
(Dubois et al., 2015). We can have 0 for low, 1 for
medium and 2 for high. So we have:
π(Z
i
|X
i
) x
i
= 2 x
i
= 1 x
i
= 0
z
i
= 2 1 κ
2,1
i
0
z
i
= 1 κ
1,2
i
1 0
z
i
= 0 κ
0,2
i
κ
0,1
i
1
If we consider as in (Dubois et al., 2015) that
a cause of weak intensity cannot produce a strong
effect, then κ
2,1
i
= 0. In our application, this pa-
rameter is greater than 0. Another constraint is that
κ
1,2
i
≥ κ
0,2
i
. So we have 4 parameters per variable. If
we add a leaky variable Z
l
in the previous model, we
obtain:
π(y|x
1
,...,x
n
) = max
z
1
,...,z
n
,z
l
:y= f (z
1
,...,z
n
,z
l
)
⊗
n
i=1
π(z
i
|x
i
) ⊗ π(z
l
)
(8)
As the uncertain connectors AND, OR, MIN and
MAX have already been described in (Dubois et al.,
2015), we only give a reminder of these connectors
below:
Table 1: Uncertain gates connectors.
Gates π(y|x
1
,...,x
n
)
AND max
z
1
,...,z
n
,z
l
:y=(z
1
∧...∧z
n
)∨z
l
⊗
n
i=1
π(z
i
|x
i
) ⊗ π(z
l
)
OR max
z
1
,...,z
n
,z
l
:y=z
1
∨...∨z
n
∨z
l
⊗
n
i=1
π(z
i
|x
i
) ⊗ π(z
l
)
MIN max
z
1
,...,z
n
,z
l
:y=max(min(z
1
,...,z
n
),z
l
)
⊗
n
i=1
π(z
i
|x
i
) ⊗ π(z
l
)
MAX max
z
1
,...,z
n
,z
l
:y=max(z
1
,...,z
n
,z
l
)
⊗
n
i=1
π(z
i
|x
i
) ⊗ π(z
l
)
Authors in (Dubois et al., 2015) proposed an op-
timization of the calculation of Uncertain MIN and
MAX connectors. The optimization consists in sim-
plifying the equations of the Uncertain MAX:
π(y|x
1
,...,x
n
) = max
z
1
,...,z
n
,z
l
:y=max(z
1
,...,z
n
,z
l
)
⊗
n
i=1
π(z
i
|x
i
)⊗π(z
l
)
(9)
= max
(
n
max
i=1
π(Z
i
= y|x
i
) ⊗ Π(Z
l
≤ y) ⊗ (⊗
i6= j
Π(Z
j
≤ y|x
j
))
π(Z
l
= y) ⊗ (⊗
n
i=1
Π(Z
i
≤ y|x
i
))
(10)
We can propose the same simplification for Un-
certain MIN:
π(y|x
1
,..., x
n
) = max
z
1
,...,z
n
,z
l
:y=max(min(z
1
,...,z
n
),z
l
)
⊗
n
i=1
π(z
i
|x
i
)⊗π(z
l
)
(11)
= max
(
n
max
i=1
π(Z
i
= y|x
i
) ⊗ Π(Z
l
≤ y) ⊗ (⊗
i6= j
Π(Z
j
≥ y|x
j
))
π(Z
l
= y) ⊗ (max
n
i=1
Π(Z
i
≤ y|x
i
))
(12)
These connectors are useful in several applica-
tions but sometimes you need a different behavior
which realizes a compromise between the conjunction
and the disjunction of the intensities of the variables.
Authors in (Zagorecki and Druzdzel, 2006) proposed
an example of a mean Noisy Gates connector. In our
study, we would like to propose a connector allow-
ing to take into account the importance of the vari-
ables as in weighted average. To do this, we will use
a linear combination (g) and a scale function ( f
e
). If
the modalities of the variable define an ordered scale
E = {0 < 1 < ... < m}, the function f of the equa-
tion y = f (z
1
,..., z
n
) must return compatible values
with the coding of the qualitative variable Y. To per-
form this constraint we have to use the scale function
named f
e
as in (van Gerven et al., 2006) which per-
forms a threshold as below:
f
e
(x) =
0 if x ≤ θ
0
1 if θ
0
< x ≤ θ
1
.
.
.
.
.
.
m if θ
m−1
< x
(13)
The graphic of this function is as follows:
Figure 2: Scale function.
In the figure above, the coefficient θ
i
defines the
expected behavior of the threshold. Thus, if the values
The Calculation of Educational Indicators by Uncertain Gates
381

of θ
i
are well defined θ
i
= i +
1
2
, then we perform a
rounding to the nearest value.
The function f is now f = f
e
◦g where g is a func-
tion. The possibility π(y|x
1
,..., x
n
) is:
π(y|x
1
,...,x
n
) = max
z
1
,...,z
n
:y=( f
e
◦g)(z
1
,...,z
n
)
⊗
n
i=1
π(z
i
|x
i
)
(14)
So we can now define a new connector to build
CPTs with an intermediate behavior between MAX
and MIN uncertain connectors. For that, the func-
tion g must be a linear combination : g(z
1
,..., z
n
) =
ω
1
z
1
+ ... + ω
n
z
n
. The scheme of the new connector
is as follows:
Figure 3: The compromise connector.
The function g has n parameters which are the
weights of the linear combination. If all the weights
are the same and equal to
1
n
, then we calculate the
mean of the intensity of the variables and we return
the value of Y closest to the mean. Of course the
values θ
i
must be θ
i
= i +
1
2
. If ∀
i∈[1,n]
ω
i
= 1, then
we calculate the sum of the causal variable intensi-
ties. We can associate for each value of Y a threshold
for the sum of intensities. If the weights are different
for all variables, then we can take into account the im-
portance of each variable. We can perform in this case
a weighted average. The constraint is that the sum of
the weights must be equal to 1. We can also divide
the result by
∑
n
j=1
ω
j
. The general expression of the
connector is:
π(y|x
1
,...,x
n
) = max
z
1
,...,z
n
:y= f
e
(
ω
1
z
1
+...+ω
n
z
n
∑
n
j=1
ω
j
)
⊗
n
i=1
π(z
i
|x
i
)
(15)
The algorithm of the Uncertain Weighted Average
connector calculation is as follows:
Algorithm 1: Uncertain Weighted Average.
Input :
Y : CPT to calculate.
X
1
,..., X
n
: the n parents of Y .
ω: a weighted vector (ω
1
,..., ω
n
).
κ[i][Z][X]: the coefficients π(Z
i
|X
i
).
f
e
: a threshold function.
Output:
The result is π(Y |X
1
,..., X
n
).
1 forall (y, x
1
,..., x
n
) ∈ Y × X
1
× ... × X
n
do
2 π(y|x
1
,..., x
n
) ←− 0
3 forall (z
1
,..., z
n
) ∈ Z
1
× ... × Z
n
do
4 Sum ←− 0
5 for i = 1 to n do
6 Sum ←− Sum + (z
i
×
ω
i
∑
n
j=1
ω
j
)
7 V [z
1
,..., z
n
] ←− f
e
(Sum)
8 K ←− {(z
1
,..., z
n
) ∈
Z
1
× ... × Z
n
|V [z
1
,..., z
n
] = y}
9 γ ←− 0
10 forall (z
1
,..., z
n
) ∈ K do
11 β ←− min
i∈[1,n]
κ[i][z
i
][x
i
]
12 γ ←− max(γ, β)
13 π(y|x
1
,..., x
n
) ←− γ
3 KNOWLEDGE MODELING
In our experimentation we focused our interest on a
Spreadsheet course at bachelor studies proposed in
face-to-face enriched. This means that the course
is face-to-face but with resources on Moodle. The
knowledge about the indicators is provided by the
teachers and extracted with datamining methods. In-
deed, we can take datamining approach to extract
knowledge or highlight some special behavior of the
students. The result is a set of rules which describe
what contributes to success at the examination. The
pedagogical indicators are evaluated through quanti-
tative data such as the use of Moodle resources, re-
sults of the quiz, attendance, etc. The questions of
the quiz are categorized by skills. If there is missing
data, we perform an imputation of the missing data
by iterative PCA (Audigier et al., 2015). To represent
the knowledge, we use a Directional Acyclic Graph
(DAG). This graph encompasses both kinds of knowl-
edge: the one extracted by a datamining approach and
the one provided by teachers. The graph is as follows:
ICEIS 2018 - 20th International Conference on Enterprise Information Systems
382
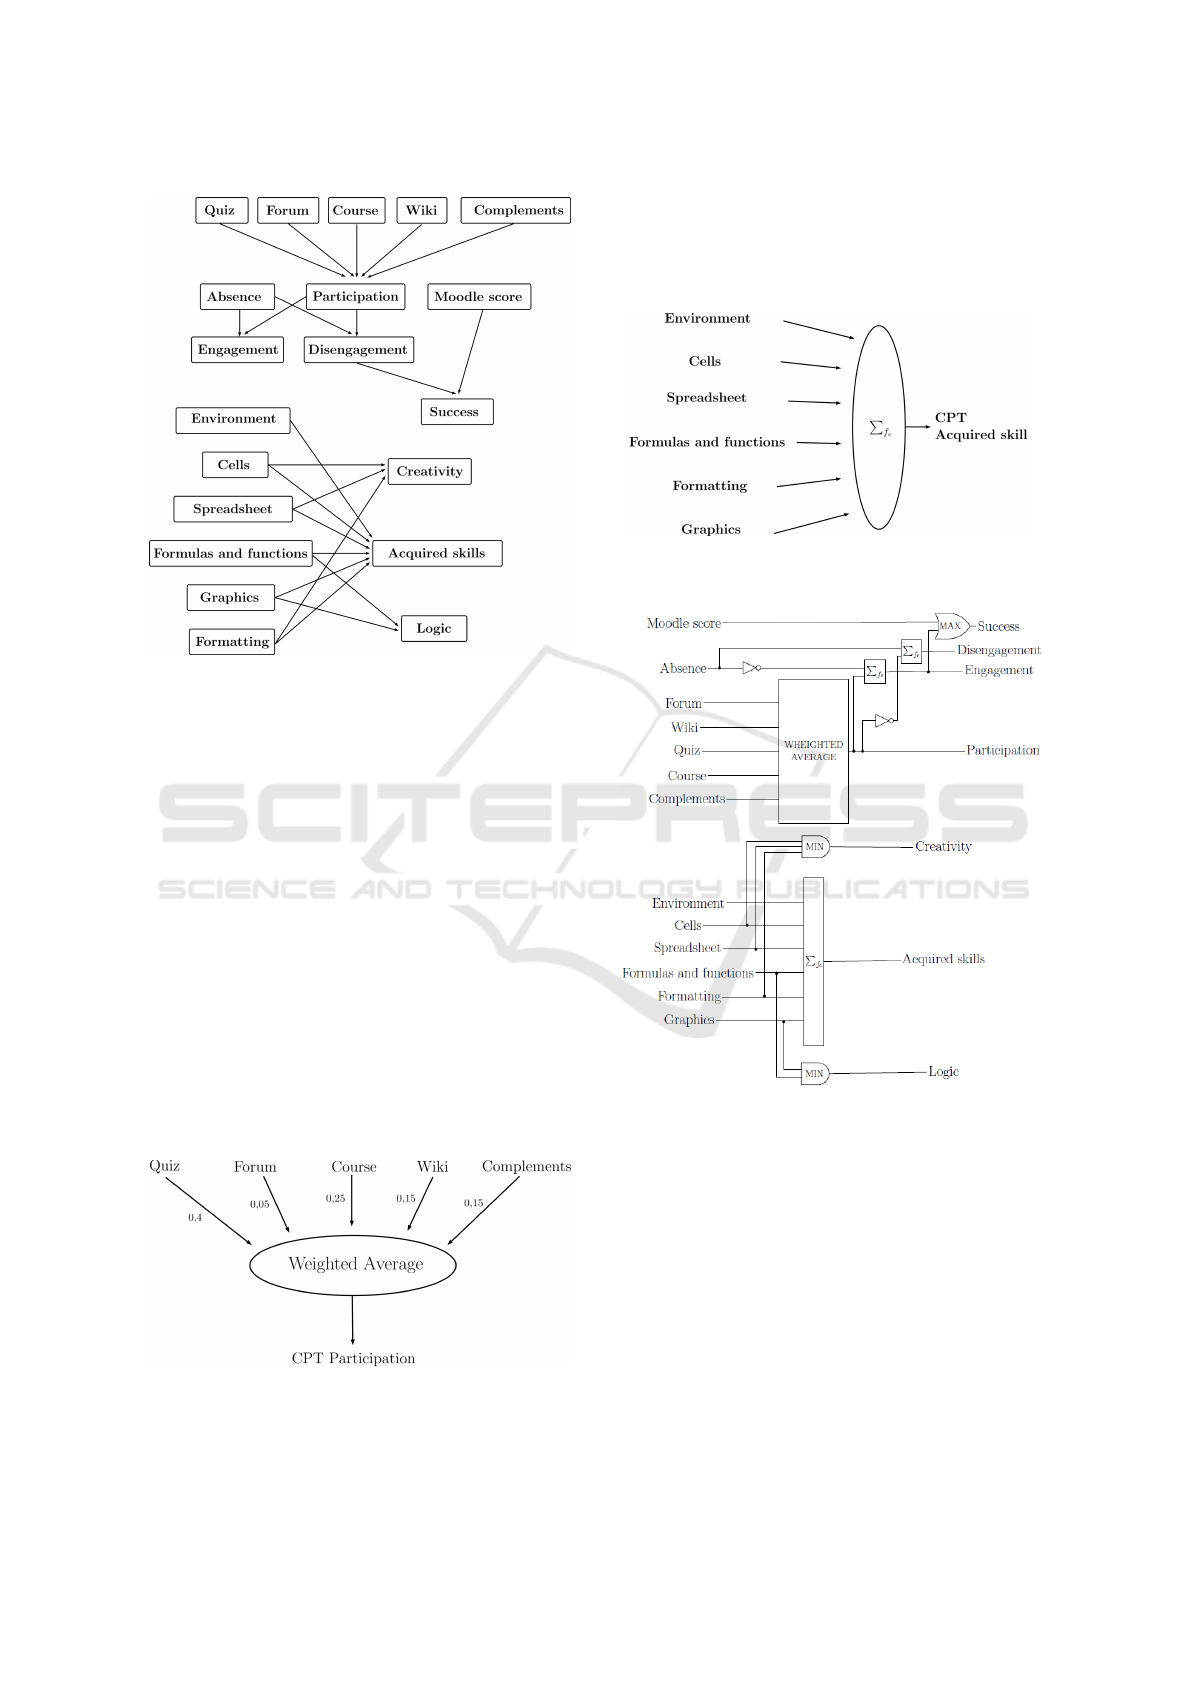
Figure 4: The modeling of knowledge by a DAG.
The qualitative variables are not binary. In fact,
there are 3 ordered modalities (low, medium, high).
As often happens in human descriptions, knowledge
is uncertain and imprecise. So we can use a possi-
bility distribution for each modality to tackle these
problems. The possibilistic network can be used to
evaluate the indicators but it requires the definition of
all CPTs. This is time-consuming. For example, for
the participation indicator which has 5 parent vari-
ables, we have 3
5+1
= 729 parameters. We cannot
elicit all these parameters easily. The use of Uncertain
Gates needs fewer parameters, so it is more adapted to
the modeling of complex knowledge. Therefore, we
can merge information on the consultation of the re-
sources to build a participation indicator which takes
into account the importance of the variables linked to
the Moodle resources. The Uncertain Weighted Aver-
age connector can be used. The weights are provided
by the teachers and shown below:
Figure 5: The weights of the Weighted Average.
Another useful indicator is the indicator of ac-
quired skills. We propose to use for this indicator
a connector Uncertain Sum
∑
f
e
which calculates the
sum of the intensities of the causal variables and per-
forms a threshold, as illustrated below:
Figure 6: CPT computation of the indicator of acquired
skills.
Figure 7: Knowledge modeling with Uncertain connectors.
We will use the Uncertain MIN connector for con-
junctive behavior and the Uncertain MAX connector
for disjunctive behavior. As a result, we obtain the
model seen in figure 7.
Before the propagation of the new information,
we have to build the CPT of all the Uncertain Gates.
Then, we can apply the junction tree algorithm (Lau-
ritzen and Spiegelhalter, 1988) of Bayesian networks
adapted to possibilistic networks. The junction tree is
composed of cliques and separators. The cliques are
extracted by using the Kruskal algorithm (Kruskal,
1956) after the generation of the moral graph and the
triangulated graph (Kjaerulff, 1994). Therefore, we
The Calculation of Educational Indicators by Uncertain Gates
383
can propagate the new information. The propagation
algorithm can be resumed in three steps:
1. The initialization phase with the injection of evi-
dence (new information).
2. The collection phase with the propagation of evi-
dence from the leaf to the root.
3. The distribution phase with the propagation of ev-
idence from the root to the leaf.
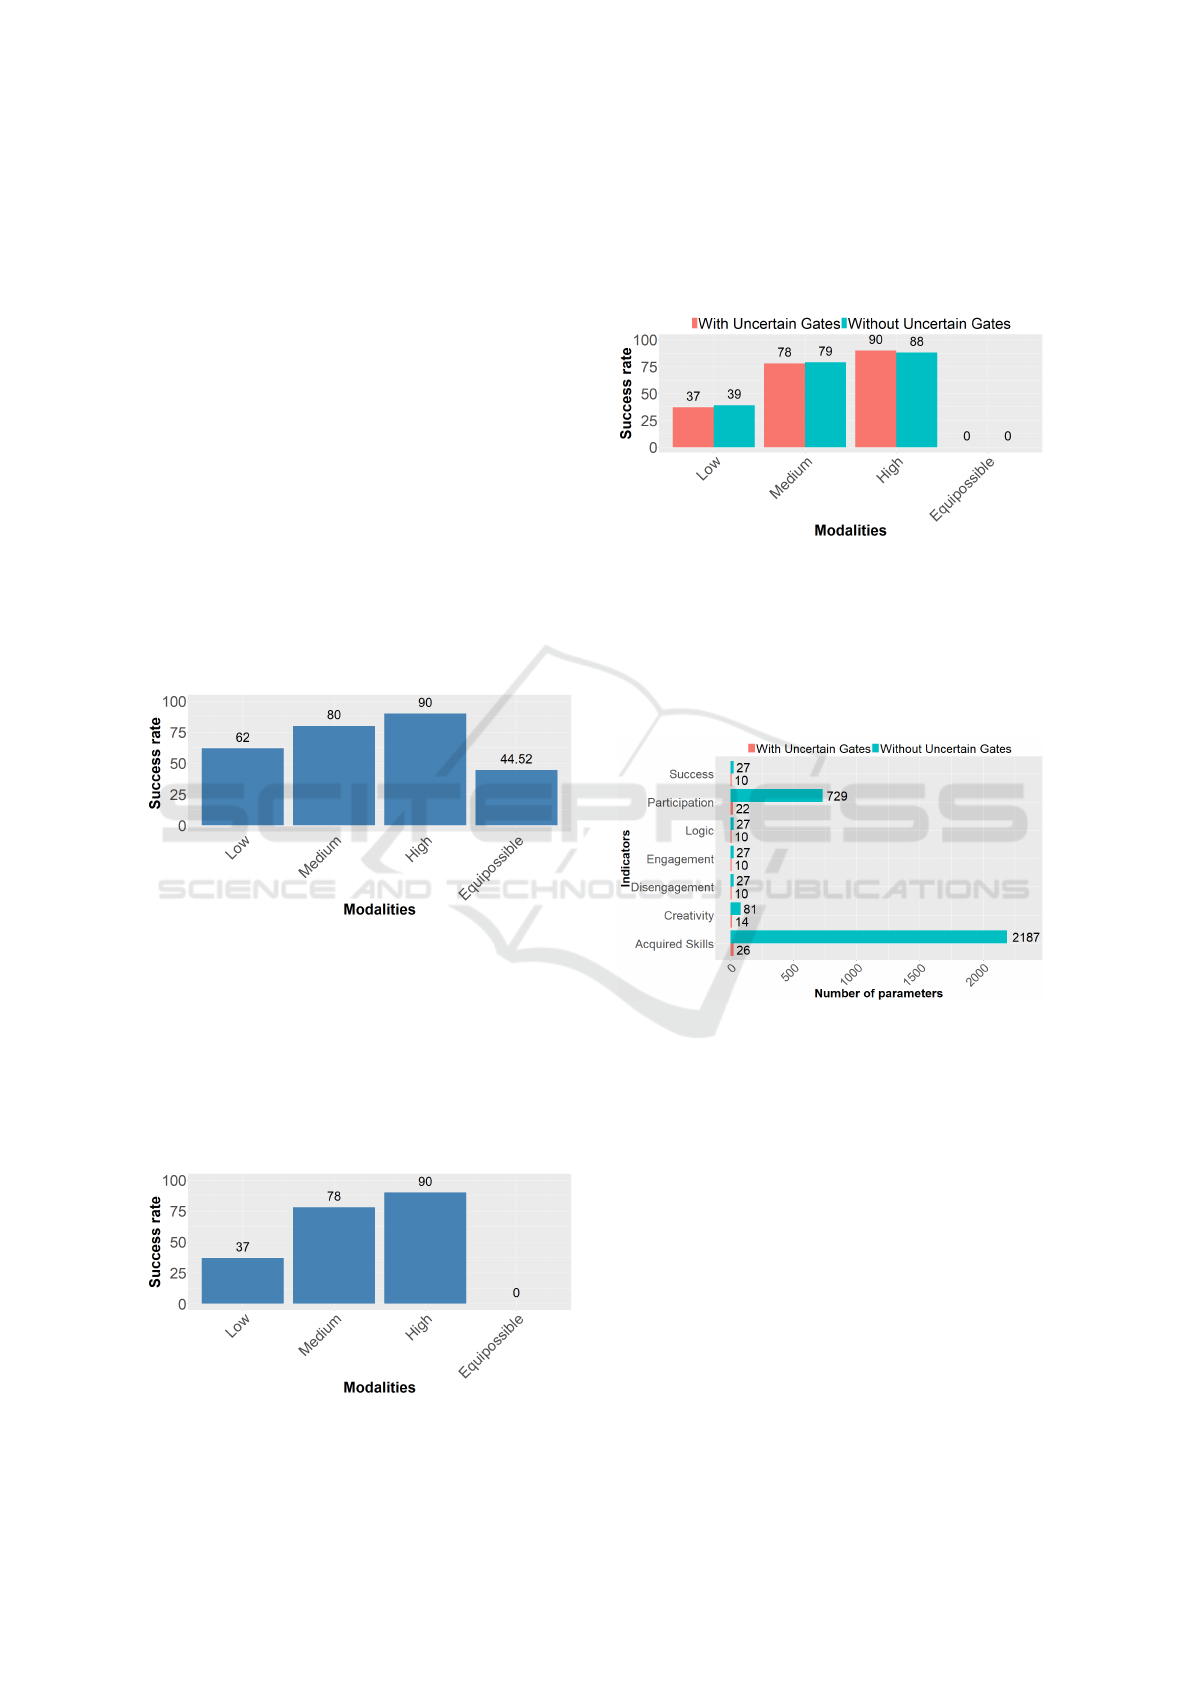
4 RESULTS
We can present the result of a more interesting indi-
cator which is the success indicator. This indicator
represents the synthesis of several variables and the
prediction of the students’ success at the examination.
We can compare the modalities of the indicator and
the successful result. We present below the results of
this indicator with missing data:
Figure 8: The result of the success indicator with missing
data.
We can see in the graph a lot of equipossible
results. This means that we cannot decide which
modality is more possible. To reduce the number of
equipossible variables, we propose to perform an im-
putation of missing data using an iterative PCA algo-
rithm (Audigier et al., 2015). Therefore the results are
now as follows:
Figure 9: The result of the success indicator with missing
data imputation.
The estimation of the missing data allowed us to
solve the problem. We can now compare the results
of the Uncertain Gates approach and the traditional
possibilistic network:
Figure 10: Comparison of the success indicator with Uncer-
tain Gates and without Uncertain Gates.
The results are very close because modeling is
well performed with Uncertain Gates. Nevertheless
Uncertain Gates require fewer parameters than CPTs
elicited by a human expert. We can compare the num-
ber of parameters for the two approaches:
Figure 11: Number of parameters to define the CPTs with
and without Uncertain Gates.
The number of parameters is very small for Un-
certain Gates compared with the CPTs elicited by a
human expert. We have also measured the perfor-
mance of the Uncertain connectors. The computa-
tion time is better for Uncertain MAX and Uncer-
tain MIN because of the mathematical simplification
demonstrated in (Dubois et al., 2015). To realize the
performance measure, we have developed small net-
works with the number of parents from 2 to 6 and we
have generated the CPT. The results are the following:
ICEIS 2018 - 20th International Conference on Enterprise Information Systems
384
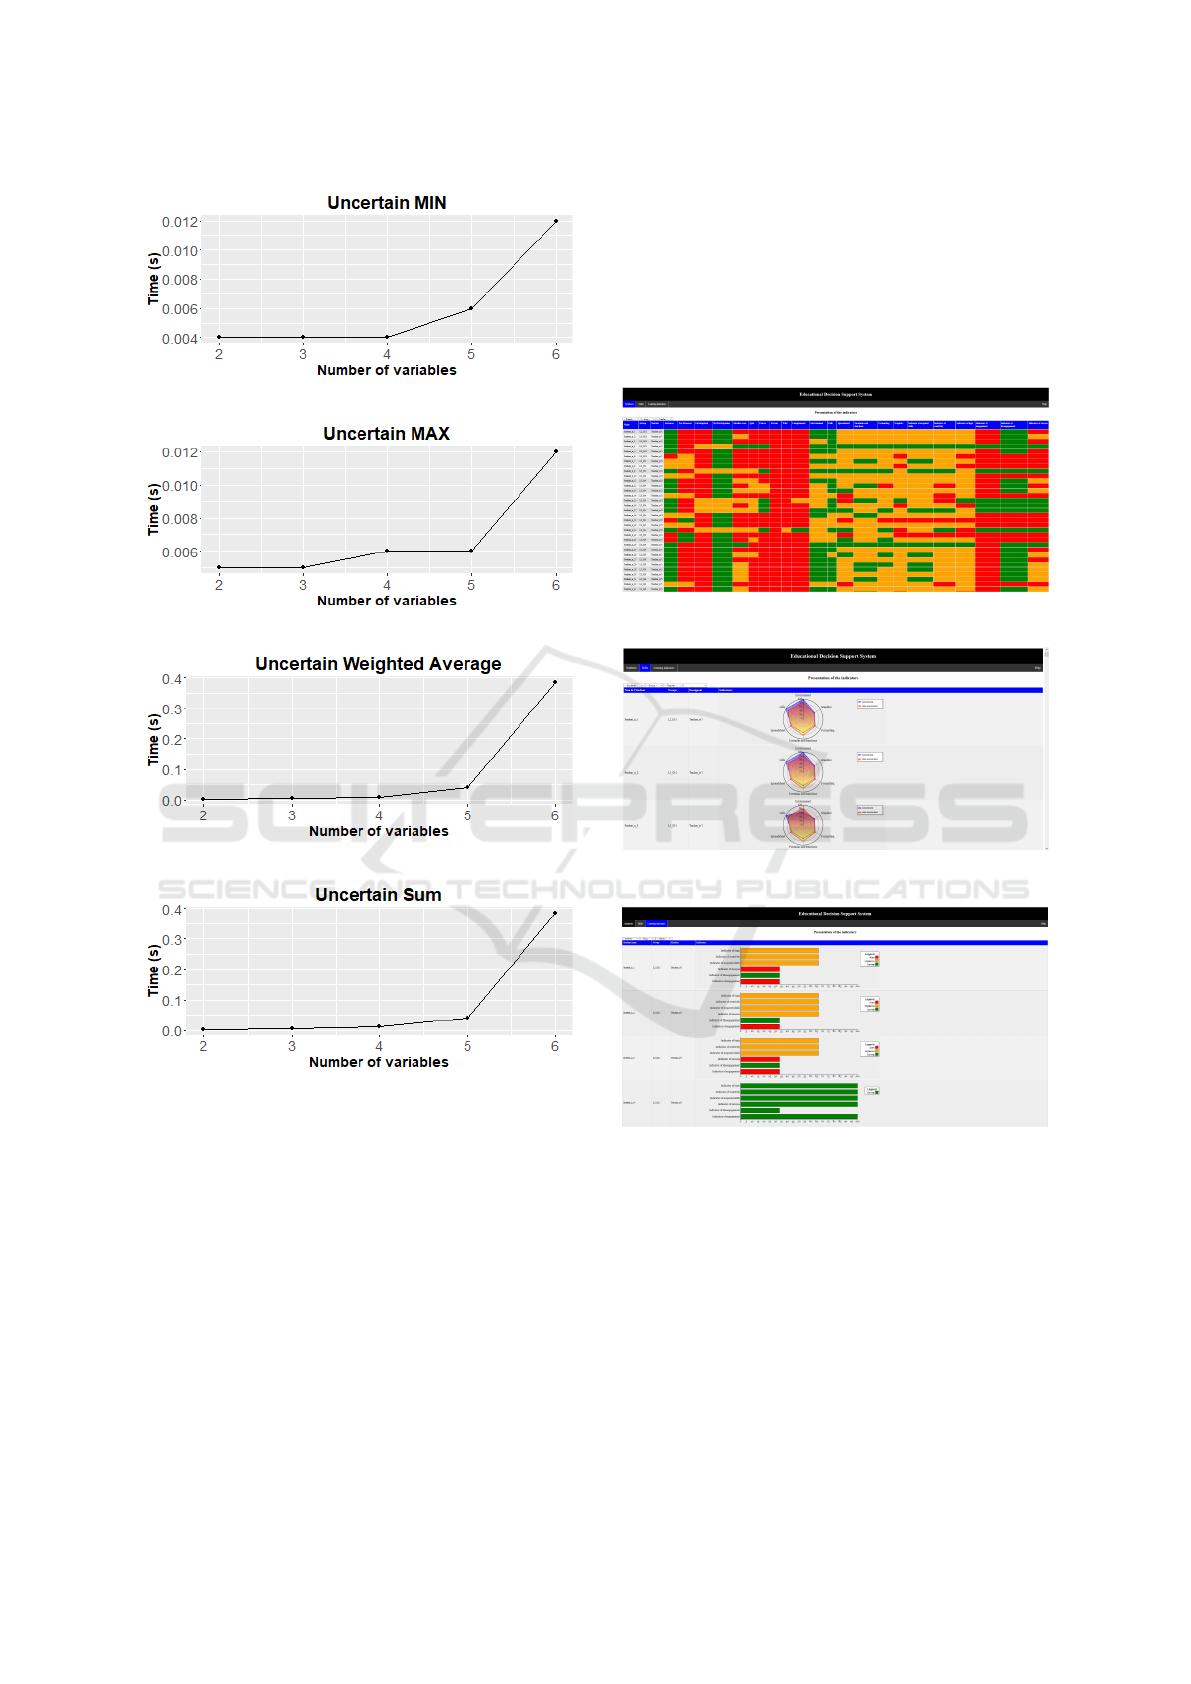
Figure 12: Computation time of Uncertain Gates (Intel I7
5500U processor, 8Go of RAM, OS 64 bits Windows 10).
In the previous figure, one can remark that the cal-
culation time is growing exponentially when the num-
ber of variables is increased. This is a big limitation
for complex systems. The solution to improve the per-
formance of our system is to calculate only once the
CPT and save the results.
The system displays the indicators in a Pedagogi-
cal Information System. We have opted for a system
easy to interpret and chosen to lose some informa-
tion. Indeed, the possibilistic results are transformed
to present only the more possible modality of indi-
cators, the one with the highest necessity. The PIS
system is generated automatically at the end of cal-
culation as a PHP web site with three tabs. The first
tab is the synthesis of all information and allows us to
sort data for all columns. The second tab gathers all
skills information. We can compare the results for the
year group and the teacher. The last tab concerns all
educational indicators and uses a color code to high-
light the students with difficulties. The PIS system is
presented below:
(a) First tab.
(b) Second tab.
(c) Third tab.
Figure 13: The tabs of the Pedagogical Information System.
5 CONCLUSION
The use of the Uncertain Gates has allowed complex
knowledge modeling which would not have been per-
formed if we had been obliged to define all condi-
tional possibility values. The behavior of the Uncer-
tain MIN and Uncertain MAX gates is not sufficient
to model all the knowledge of our application. In-
deed, we need for our application a compromise be-
The Calculation of Educational Indicators by Uncertain Gates
385

havior between the two connectors. So we have pro-
posed a new connector which allows a combination
of the variables taking into account the importance of
the variable as with weighted average. We used this
connector to merge the information about the consul-
tation of the Moodle resources to elaborate the partic-
ipation indicator. We have also proposed a connector
which takes into account the reinforcement of the in-
tensity of the variables. There are good results which
highlight the students with difficulties. But the main
problem is the performance limitation of the approach
for complex system modeling. We have to continue
the improvement of the performance and to find new
solutions to reduce the calculation time. We have to
complement the toolbox of Uncertain connectors with
new connectors which can be used for information fu-
sion. A vast experimentation is also needed to eval-
uate the pedagogical impact of this approach on stu-
dents and teachers but also on skill attainment. We
also have to perform comparative studies with other
approaches for further investigation.
REFERENCES
Amor, N. B. and Benferhat, S. (2005). Graphoid properties
of qualitative possiblistic independance relations. In
International Journal of Uncertainty, Fuzzyness and
Knowledge Based Systems, volume 13, pages 59–96.
Audigier, V., Husson, F., and Josse, J. (2015). A princi-
pal components method to impute missing values for
mixed data. In Advances in Data Analysis and Clas-
sification, volume 1, pages 5–26.
Baker, R. and Yacef, K. (2009). The state of educational
data mining in 2009: A review and future visions. In
Journal of Educational Data Mining, volume 1, pages
3–17.
Benferhat, S., Dubois, D., Garcia, L., and Prade, H. (1999).
Possibilistic logic bases and possibilistic graphs. In
In Proc. of the Conference on Uncertainty in Artificial
Intelligence, pages 57–64.
Benferhat, S. and Smaoui, S. (2004). Repr
´
esentation hy-
bride des r
´
eseaux causaux possibilistes. In Rencon-
tres francophones sur la Logique Floue et ses Appli-
cations, pages 43–50, Nantes, France. C
´
epadu
´
es Edi-
tions.
Borgelt, C., Gebhardt, J., and Kruse, R. (2000). Possibilistic
graphical models. In Computational Intelligence in
Data Mining, volume 26, pages 51–68. Springer.
Bousbia, N., Labat, J. M., Balla, A., and Reba, I. (2010).
Analyzing learning styles using behavioral indicators
in web based learning environments. In EDM 2010 In-
ternational Conference on Educational Data Mining,
pages 279–280, Pittsburgh, USA.
Caglioni, M., Dubois, D., Fusco, G., Moreno, D., Prade,
H., Scarella, F., and Tettamanzi, A. G. B. (2014).
Mise en oeuvre pratique de r
´
eseaux possibilistes pour
mod
´
eliser la sp
´
ecialisation sociale dans les espaces
m
´
etropolis
´
ees. In Rencontres Francophones sur la
Logique Floue et ses Applications (LFA 2014), pages
267–274, Carg
`
ese, France. C
´
epadu
´
es Editions.
D
`
ıez, F. and Drudzel, M. (2007). Canonical probabilistic
models for knowledge engineering. In Technical Re-
port CISIAD-06-01.
Dubois, D., Fusco, G., Prade, H., and Tettamanzi, A. G. B.
(2015). Uncertain logical gates in possibilistic net-
works. an application to human geography. In Scal-
able Uncertainty Management 2015, pages 249–263,
Qu
´
ebec, QC, Canada. Springer.
Dubois, D. and Prade, H. (1988). Possibility theory: An
Approach to Computerized Processing of Uncertainty.
Plenum Press, New York.
Heckerman, D. and Breese, J. (1994). A new look at causal
independence. In Proceedings of the Tenth Annual
Conference on Uncertainty in Artificial Intelligence
(UAI94), pages 286–292, San Francisco, USA. CA.
Morgan Kaufmann Publishers.
Huebner, R. A. (2013). A survey of educational data mining
research. In Research in Higher Education Journal,
volume 19.
Kjaerulff, U. (1994). Reduction of computational complex-
ity in bayesian networks through removal of week de-
pendences. In Proceeding of the 10th Conference on
Uncertainty in Artificial Intelligence. Morgan Kauf-
mann publishers.
Kruskal, J. B. (1956). On the shortest spanning subtree
of a graph and the travelling salesman problem. In
Proceedings of the American Mathematical Society,
pages 48–50.
Lauritzen, S. and Spiegelhalter, D. (1988). Local compu-
tation with probabilities on graphical structures and
their application to expert systems. In Journal of the
Royal Statistical Society.
Neapolitan, R. E. (1990). Probabilistic reasoning in expert
systems: theory and algorithms. John Wiley & Sons,
New-York, USA.
Pearl, J. (1988). Probabilistic reasoning in intelligent sys-
tems: networks of plausible inference. Morgan Kauf-
man Publishers, San Mateo, USA, 2nd edition.
van Gerven, M. A. J., Jurgelenaite, R., Taal, B. G., Heskes,
T., and Lucas, P. J. F. (2006). Predicting carcinoid
heart disease with the noisy-threshold classifier. In
Artificial Intelligence in Medicine, volume 40, pages
45–55.
Zadeh, L. A. (1978). Fuzzy sets as a basis for a theory
of possibility. In Fuzzy Sets and Systems, volume 1,
pages 3–28.
Zagorecki, A. and Druzdzel, M. J. (2006). Probabilistic
independence of causal influences. In Probabilistic
Graphical Models, pages 325–332.
ICEIS 2018 - 20th International Conference on Enterprise Information Systems
386
