
Sensor System with Multi-point Sampling Applied to IAQ Measurements
Andrzej Szczurek, Monika Maciejewska and Paulina Szczepanek
Faculty of Environmental Engineering, Wroclaw University of Science and Technology,
Wyb. Wyspianskiego 27, 50-370 Wroclaw, Poland
Keywords:
Multi-point Sampling, Gas Sensor, Indoor Air, Occupancy, Impact.
Abstract:
Quality of indoor air (IAQ) is one of considerable concerns of today. Its evaluation through measurement is
highly requested, but difficult. The reason is the numerosity of influencing factors involved as well as sig-
nificant temporal and spatial variability of IAQ. In this work, we proposed a sensor system with multi-point
sampling for this purpose. It is based on semiconductor gas sensor. The measurements were performed in
a concert hall. The measurement procedure included sensor exposure to gas samples delivered from four
sampling points, interchangeably with purified air for sensor regeneration. The obtained results show that the
sensor system with multi-point sampling is a promising concept for indoor air monitoring. It was demon-
strated that the system is applicable to determine the influence of occupants on IAQ. It is possible, because
human beings release VOCs, which are measurable by semiconductor gas sensors. Sensor regeneration plays
crucial role in the system operation. For achieving valuable results it is necessary to apply sensor signal
pre-processing, which consist in baseline correction.
1 INTRODUCTION
Poor indoor air quality (IAQ) can lead to a number of
physical symptoms and complaints (?; ?). Hence, it
is the subject of much attention these days (?).
The problem of inappropriate chemical quality of
air inside buildings is difficult to diagnose and solve
without the expert assistance, supported by the appro-
priate information (?). The most reliable source of
such information are measurements.
The ideal analytical instrument dedicated to IAQ
assessment should be able to identify and quantify a
broad spectrum of chemical compounds with the min-
imal cross-interferences. It has to exhibit an appro-
priate detection limit, sensitivity and dynamic range.
In real life, indoor environment is a dynamic system.
The qualitative and quantitative composition of air in-
side buildings can undergo complex changes in time
(?). Thus, it is important to use instruments designed
for real-time, continuous measurements, with fast re-
sponse time. Only such devices may be able to detect
various circumstances, when concentrations of con-
taminants display characteristic behavior. The set of
chemicals present in air inside building, as well as
their concentrations, vary greatly across indoor space.
The need to recognize this variation implies on-line or
in situ mode of operation of measuring instruments.
In addition, the selection of representative sampling
points is a key issue. It is also important to consider
if the analyzer can be used in the chosen (specific)
location. Analytical equipment has to be prepared to
work, with the declared accuracy, in different envi-
ronments . The cost of regular maintenance of the
analyzer is sometimes high and therefore it has to be
taken into account, as well. The fundamental stage
of the measurement process is calibration. Instru-
ments for indoor air analysis should be easily cali-
brated without the support from the supplier.
Today, there are a number of analytical meth-
ods and techniques which allow to characterize in-
door air quality (?). The available measuring in-
struments vary in their cost, advantages and limita-
tions. Gas Chromatography and Mass Spectrome-
try, Photoacoustic Spectroscopy and Fourier Trans-
form Spectroscopy offer good accuracy, sensitivity,
selectivity and repeatability (?; ?). They are mainly
dedicated for quantitative and qualitative analysis of
indoor air. Unfortunately, chromatographs and spec-
trometers are very often unattractive, because of their
setting-up time, size, ruggedness, cost and serious dif-
ficulties with conducting measurements in field con-
ditions. The available analytical equipment very of-
ten requires sample preparation, so that on-line, real-
time, continuous analysis is difficult in these circum-
stances. Additionally, the cost and size of these in-
struments limit the number of monitoring sites. The
Szczurek, A., Maciejewska, M. and Szczepanek, P.
Sensor System with Multi-point Sampling Applied to IAQ Measurements.
DOI: 10.5220/0006669701470154
In Proceedings of the 7th International Conference on Sensor Networks (SENSORNETS 2018), pages 147-154
ISBN: 978-989-758-284-4
Copyright © 2018 by SCITEPRESS – Science and Technology Publications, Lda. All rights reserved
147
shortcomings of traditional analytical equipment are
partially reduced in instruments based on gas sen-
sors (?; ?). These devices present numerous advan-
tages, like small size, low weight, simplicity of use,
high sensitivity in detecting low concentrations (at the
level of ppm or even ppb) of a wide range of gaseous
chemical compounds, fast response (it gives the pos-
sibility of on-line operation) and low cost, due to the
possibility of batch production. The gas sensors have
also several weak points. First of all, their responses
can be often influenced by humidity and temperature.
They also suffer from limited measurement accuracy,
problems of long-time stability (drift) and poor selec-
tivity.
The requirements of IAQ monitoring and limita-
tions of gas sensor technology caused that we devel-
oped the measurement system equipped with a single
semiconductor gas sensor and a multi-point sampler.
The aim of this work is to show that the proposed
measurement system can be used for automatic, real-
time, determination of the influence of occupancy on
IAQ. This indicator plays a significant role in the con-
trol and diagnostics of IAQ. The developed instru-
ment is not dedicated for quantitative and qualitative
analysis of indoor air. It can be applied in public util-
ity buildings where air exchange rate and humidity
levels are relatively constant. Additionally, it pro-
vides data that allows to determine spatial and tempo-
ral variability of the occupancy influence on air qual-
ity. Unlike in case of the wireless sensor networks,
the problem of energy consumption is significantly re-
duced in this equipment. The indication of the occu-
pancy influence on IAQ and the determination of its
spatial and temporal variability, as a result of sensor
signal baseline manipulation, are the main elements
of novelty.
2 EXPERIMENTAL
2.1 Sensor System with Multi-point
Sampling
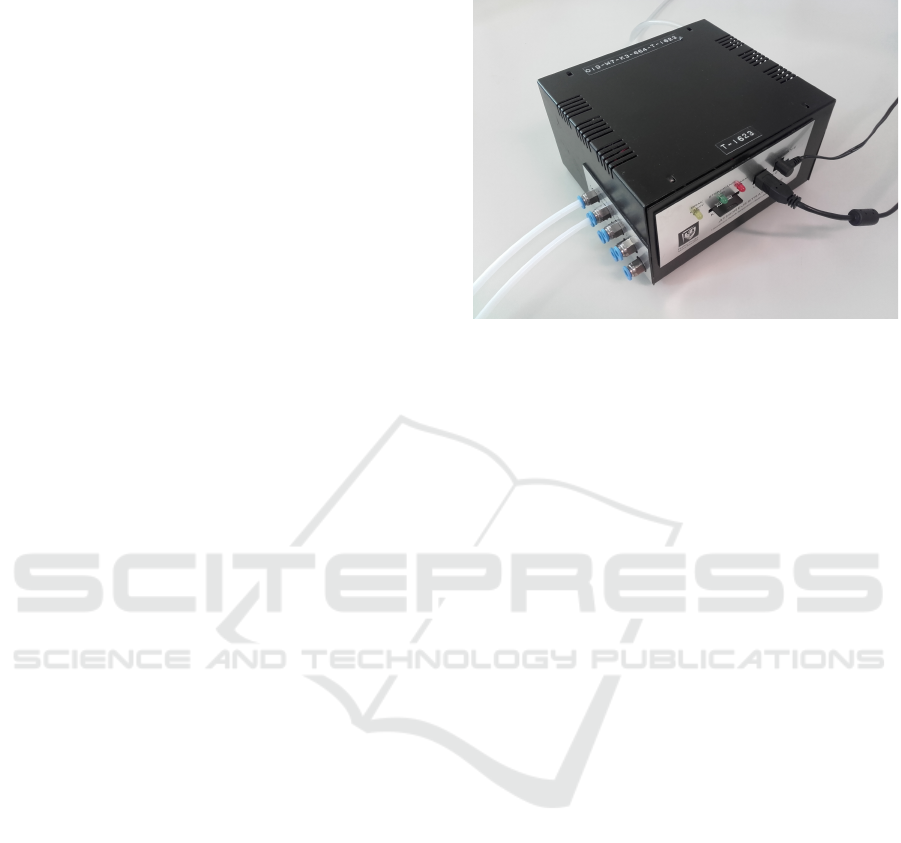
There was applied a gas sensor system with multi-
point sampling. Major elements of the system are: 1)
sensor chamber, 2) inlet ports for gas samples, 3) unit
for the inlet ports switching, 4) pump, 5) electrical
circuits, 6) power supply, 7) control mechanisms (sen-
sor heaters and the pump), 8) data acquisition unit, 9)
software. The construction was developed in the Lab-
oratory of Sensor Techniques and Indoor Air Quality
Studies at Wroclaw University of Science and Tech-
nology, Poland. The photo of the system is shown in
Figure ??.
Figure 1: Sensor System with Multi-point Sampling in
Technical Space.
The system utilizes semiconductor gas sensors. In
this work there was considered the performance of
TGS2600. According to the data sheet (?) this sensor
is dedicated to the detection of air contaminants. Its
measuring range, in terms of ethanol concentration, is
1-100 ppm. Sensor power consumption is 210 mW.
In the device, an individual sensor is mounted in
one flow-through chamber. The inlet of the chamber
is connected with inlet ports for gas sampling via the
switching mechanism. One inlet port a time can be
connected to the sensor chamber. There are 8 gas in-
let ports available in total. The operation of the instru-
ment is controlled by the software. The user defines
the following working parameters: sequence of inlet
ports connection to sensor chamber, intensity of sen-
sors’ heating (as the percentage of maximum power
applied to heaters), gas flow (as the percentage of the
maximum throughput of the pump).
In order to realize the automatic mode of opera-
tion, the software code is loaded from the memory
card. Once loading is completed, sensor system oper-
ates continuously by repeating in cycle the sequence
of actions and by applying the predefined settings, as
described in the operation program. The measure-
ment data is recorded on the memory card. The data
may be easily downloaded to the computer as the *.txt
file.
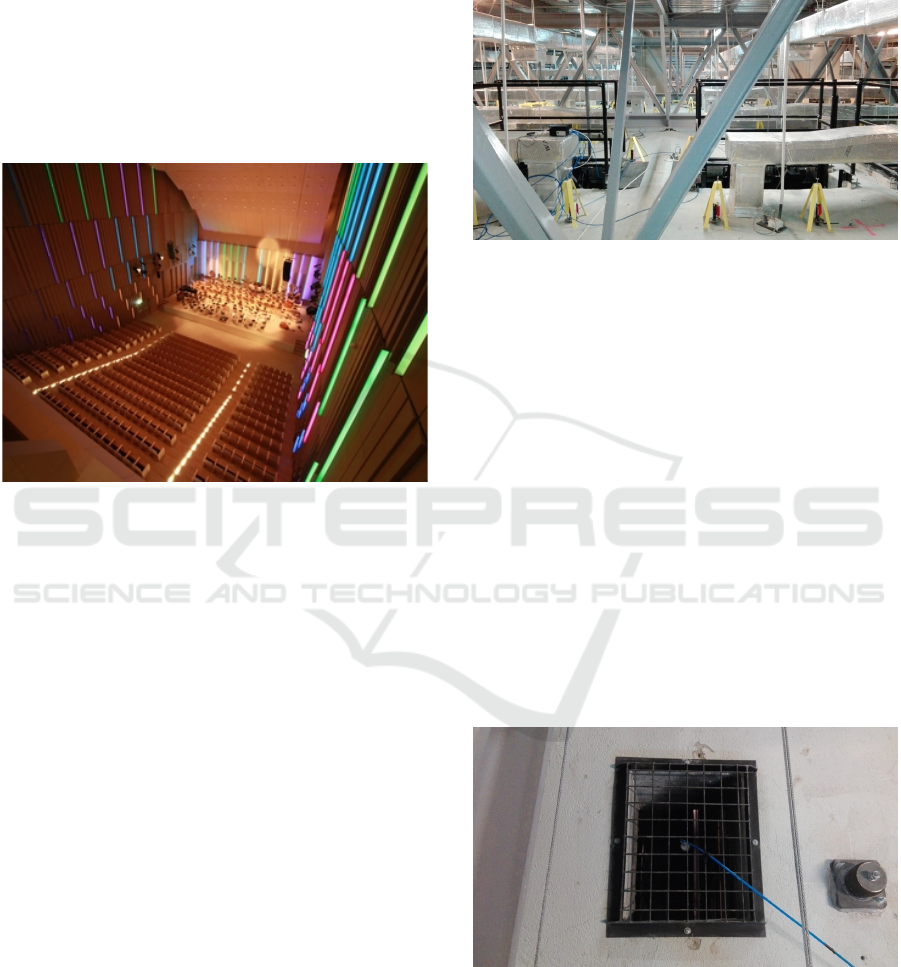
2.2 Concert Hall
The instrument was applied for carrying out indoor
air measurements in a concert hall. The investigated
object is quite new. It was built in 2012. The hall
is heavily loaded with numerous cultural events. Big
concerts (several hundred listeners) are held nearly
each Friday, Saturday and Sunday, frequently, two
SENSORNETS 2018 - 7th International Conference on Sensor Networks
148
concerts per day. Sometimes, musicians perform on
working days (e.g. for schools). Numerous rehearsals
take place in course of entire week. Their time span
and the number of participants are highly variant and
neither predefined nor controlled. Allover, the space
is very unevenly occupied in time.
The volume of the concert hall is 10 800 m
3
. In
the auditorium there are 526 seats and the stage can
host up to 300 performers. The hall has amphithe-
atric layout (4.5 m height difference at the distance of
about 18 m), as shown in Figure ??.
Figure 2: Concert hall.
The hall is fitted with the displacement ventilation.
Fresh air is delivered through diffusers located under
seats. Exhaust air is removed via numerous ventila-
tion grills located in the technical ceiling (about 17 m
above the stage level). The ventilation rate is constant.
The technical space above the ceiling hosts multiple
installations, including ventilation ducts and their in-
lets (see, Figure ??). Between the technical ceiling
and the auditorium as well as over the stage there are
mounted elements of suspended ceiling which serve
achieving proper acoustics (see, Figure ??). They re-
strict the area through which the indoor air is removed
from the hall.
2.3 Measurements
For the purpose of measurements there were chosen
four sampling points. They were located in ventila-
tion grills, mounted in the technical ceiling, as shown
in Figure ??. The points were arranged centrally,
along the auditorium. Sampling point 1 was located
over the balcony at the back of auditorium. Sampling
point 4 was located at the border between the audito-
rium and stage. Points 2 and 3 were located between
points 1 and 4, at approximately equal distances. It
is important to note that sampling points 1, 2 and 3
were over gaps between the elements of the acoustic
ceiling. Therefore, they were on the way of air flow-
ing upwards, from the auditorium towards the ceiling.
Contrarily, sampling point 4 was quite shielded (about
5 m from the nearest gap).
Figure 3: Sensor system with multi-point sampling in tech-
nical space.
The sensor system was placed in the technical
space (see, Figure ??). The possibility of locating the
device in technical space is very advantageous. First
of all, the users of the indoor space are totally unaf-
fected by the measurements. It is particularly impor-
tant when gas flow through sensor device is enforced
with a pump, which may cause noise. This possibility
is also critical in respect of realization of multi-point
sampling, which requires a system of tubing for gas
sample transportation. This, at best, should be out of
reach of the average room user. Usually, the instru-
ment located in technical space may be easily con-
nected to power supply, which gives some flexibility
of its placement with respect to the investigated space.
The device operator may be granted relatively uncon-
strained access in respect of installation, control and
maintenance of the instrument, as well as data down-
load.
Figure 4: Sampling point.
Sampling points were connected with sampling
ports of the sensor device by tubing. There was ap-
plied polyamide tubing. The pieces of 17 m length
were used, the same for each pair sampling point -
instrument port. Anti-dust filter was mounted at the
inlet of tubing in order to protect sensors from the
Sensor System with Multi-point Sampling Applied to IAQ Measurements
149

particulate matter contained in the air. There was also
created one reference sampling point. The air deliv-
ered from there was used for the sensor system re-
generation. For this purpose there was applied 17 m
long Teflon tubing fitted at the end with a filter mod-
ule. The module included activated charcoal, molecu-
lar sieves and soda lime. The indoor air which passed
through this filter could be considered void of volatile
organic compounds (with reference to sensors detec-
tion range) and, to a large extent, dehumidified.
The sensor system operated in four-point sam-
pling schema. The single measurement cycle was
composed of 8 steps. During each step, the gas sam-
ple was drawn from one sampling point for the prede-
fined period of time (30 s), as shown in Table ??. The
complete cycle lasted 4 min. The measurement data
was recorded continuously with the temporal resolu-
tion of 1 s.
Table 1: Cycle of operation for the gas sensor system with
multi-point sampling.
Cycle stage Sampling point Sampling time [s]
1 reference 30
2 1 30
3 reference 30
4 2 30
5 reference 30
6 3 30
7 reference 30
8 4 30
Table 2: Concert beginning hours and the number of atten-
dees. Each concert was held on different day.
Beginning Audience
19:00 400
16:00 455
11:00 310
19:00 700
17:30 50
15:00 600
19:00 320
16:00 210
19:00 300
19:00 400
In this work tehre was examined the measurement
data collected during 10 selected days in the spring
2017. We were particularly interested in the condi-
tions during concerts. They were held at different
times of the day (from 11:00 to 19:00) and the au-
dience was of various size (form 50 to 700 listen-
ers). The details of concerts involved in the analysis
are provided in Table ??. The number of listeners is
rounded to tens.
3 DATA PROCESSING METHODS
The sensor system with multi-point sampling was
proposed to determine the influence of occupants on
IAQ in the concert hall during a symphonic concert.
Problems with poor air quality could result first of
from the elevated concentrations of CO
2
and VOCs,
which are emitted by people who stay in the room.
In this study we focused on VOCs, because they are
responsible for olfactory sensation. The concentra-
tions of individual gases emitted by human beings
are relatively low, but their sum is high and it can
be measured by semiconductor gas sensors. The key
point in our analysis was to demonstrate that their re-
sponses could be quantitatively related to the number
of occupants. Such relationship means that sensor re-
sponse is mainly affected by occupants and not other
VOCs sources. It was assumed that during the con-
cert thermal conditions indoors are stable. Therefore,
the influence of temperature and humidity on sensor
response was constant.
In IAQ measurements, temporal and spatial aspect
are important. When using one sensor device and
multi-point sampling option, the information about
the individual sampling locations is refreshed on a pe-
riodic basis. The length of the period imposes a con-
straint on the length of the measurement cycle which
includes a full sequence of exposures to all sampling
points. It also implies time constraint on the dura-
tion of measurement done at single point. Obviously,
the shorter they are, the better temporal resolution of
information delivery. In this work, the measurement
cycle lasted 4 min and the individual exposure lasted
30 s.
In respect of the properties of semiconductor gas
sensors, mainly the memory effect, it was assumed
that gas samples from different sampling points
should not enter the sensor system directly one af-
ter another. There was introduced exposure to puri-
fied air, delivered to the sensor system from reference
sampling point after completing exposure to the gas
sample from each real sampling point. This solution
allows for achieving partial regeneration of gas sen-
sor. The degree of regeneration is dependent on many
factors, including the composition of the earlier deliv-
ered gas sample and the time which may be dedicated
to sensor regeneration. This operation has to be in-
cluded in the measurement cycle, further limiting the
time which is available for an individual exposure. In
this work, there was considered the measurement pro-
cedure, in which the purified air was delivered for 30
s between subsequent exposures to gas samples from
different sampling points. One of the major objectives
in this work was to examine the importance of sen-
SENSORNETS 2018 - 7th International Conference on Sensor Networks
150

sor regeneration stage for acquiring the target mea-
surement information from sensor system with multi-
point sampling.
The analysis of measurement data was focused on
identifying the feature of sensor signal, which is lin-
early related to the number of people in the concert
hall. In the study, the following issues were taken into
consideration:
• sampling points, numbered with k ∈
{
1, 2, 3, 4
}
.
• advancement of the exposure phase for k
th
sam-
pling point (time which elapsed since it started),
i ∈
{
1, 2, . . . ..., 30
}
s;
• advancement of the concert (time which elapsed
since it started; We limited the period to 1 h), j ∈
{
1, 2, . . . ..., 60
}
min;
There were considered two kinds of features, raw
sensor response, R and corrected sensor response, R−
R
0
. Once properly indexed, they have the following
meaning:
• R
i, j,k
is the value of sensor signal recorded at time
i of sensor exposure to gas sample delivered from
sampling point k, while the exposure started a
time j since the beginning of the concert;
• R
0
j,k
is the last value of sensor signal recorded
during sensor exposure to purified air, prior to
switching to sampling point k, while the switch-
ing takes place at time j since the beginning of
the concert.
For each sampling point, k there were considered
the following relationships:
N
=
a
1
+
a
2
R
i
,
j
,
k
+
ε
(1)
N = b
1
+ b
2
(
R
i, j,k
− R
0
j,k
)
+ ε (2)
where N stands for the number of people in the con-
cert hall. The data utilized for regression fitting was
collected during 10 concerts, as listed in Table ??.
The performance of fitting was examined using co-
efficient of determination (R
2
) and root mean squared
error (RMSE).
4 RESULTS
In Figure ?? there is shown the raw signal of
TGS2600 sensor, recorded during a single measure-
ment cycle.
As indicated by the orange line in Figure ??, the sen-
sor system was first exposed to purified air (regen-
eration), followed by exposure to gas delivered from
sampling points 1, 2, 3 and 4 in turn, interchangeably
with exposure to purified air. As shown in Figure ??,
the exposure to gas from any sampling point caused
increase of sensor signal and the exposure to purified
air resulted in signal decrease. Changes of sensor sig-
nal at individual measurement points were different.
Also, the degree of sensor regeneration achieved after
the subsequent exposures was not the same. This fact
was responsible for the overall shift of sensor signal
in time.
The shift may be observed in Figure ??. It shows
the behavior of the raw sensor signal recorded dur-
ing an exemplary day. Four subplots display measure-
ment data which refer to individual sampling points.
More precisely, the data plotted in a single subplot
comes from 30 s of exposure to the air delivered from
a measurement point, once every 4 minutes. The re-
maining 3 min 30 s of measurement cycle are void of
data for the particular location. As shown, for each
considered location, the raw sensor signal varied in
time. Considerable part of the variation was caused
by the properties of sampled air. The hall was not oc-
cupied during the night. However, around 9:00 a.m.
there started numerous activities, namely rehearsals
and later, preparations immediately preceding con-
certs. In the afternoon, at 15:00 and in the evening,
at 19:00 there were concerts. All these events were
associated with considerable variations of room oc-
cupancy in terms of the number of people, their ac-
tivities and distribution in the hall. This was reflected
in the variation of sensor’s responses. However, some
part of the senor signal change has to be attributed to
the memory effect. If there was no memory effect,
the sensor signal would have approximately the same
value at the beginning of each subsequent exposure.
The incomplete regeneration results in baseline shift.
In Figure ??, there is shown the time series of raw
responses, R recorded during exposure of TGS2600
sensor to the gas delivered sequentially from four
sampling points, in the period of one day. However,
there was displayed just the data recorded during a
single second of each exposure. The middle, 15
th
sec-
ond of exposure was chosen. Figure ?? was prepared
as a reference to Figure ??.
In Figure ?? there is shown the time series of cor-
rected responses of sensor TGS2600, recorded dur-
ing 15
th
second of exposure. The correction R − R
0
consisted in subtracting the last response of sensor
recorded upon regeneration, prior to exposure, from
the raw sensor response recorded in 15
th
s of expo-
sure. The value of R
0
was not constant for all expo-
Sensor System with Multi-point Sampling Applied to IAQ Measurements
151
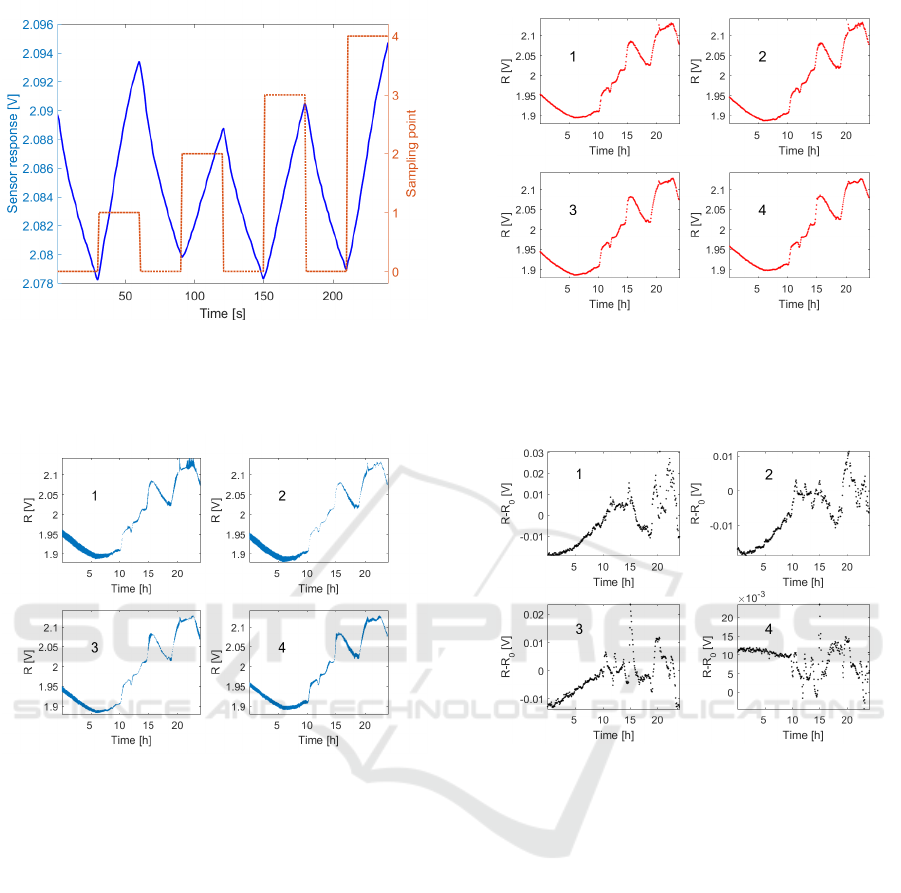
Figure 5: Raw signal of TGS2600 sensor, recorded during
single measurement cycle. Sampling point switching is in-
dicated by the orange line. Measurement data was collected
during a concert, i.e. when there was an impact on indoor
air, from the audience.
Figure 6: Raw signal recorded during exposure of TGS2600
sensor to the gas delivered sequentially from four sampling
points during one day. Subplots are labeled with sampling
point numbers.
sures. It changed in time, because of the inefficiency
of sensor regeneration process.
As shown in Figure ??, raw sensor response
displayed similar temporal variation in all subplots.
Also, the corresponding values of the responses were
similar in four sampling points. It implies that the in-
formation about four monitored locations was similar,
if based on raw sensor response, R.
The situation was different when applying the cor-
rected response R − R
0
as the source of information.
As shown in Figure ??, the temporal variation of
the variable R − R
0
was quite different at individual
subplots. Also the ranges of values were different.
The information about conditions at sampling points
based on the corrected sensor response, R − R
0
was
different from the information based on the raw re-
sponse, R.
Figure 7: Raw responses, R recorded during exposure of
TGS2600 sensor to the gas delivered sequentially from four
sampling points, during one day. The 15
th
second of ex-
posure was used. Subplots are labeled with sampling point
numbers.
Figure 8: Corrected responses, R − R
0
recorded during ex-
posure of TGS2600 sensor to the gas delivered sequentially
from four sampling points during one day. 15
th
second
of exposure was used. Subplots are labeled with sampling
point numbers.
In Figure ?? there is displayed the coefficient of
determination, R
2
for the regression models described
by eq. ??. They are linear models of the relation-
ship between raw sensor response, R and the num-
ber of concert hall occupants. The indicator of the
adequacy of the model is displayed as a function of
the advancement of the concert and the advancement
of the individual exposure of the sensor. In Figure
?? there are shown the results obtained when assum-
ing linear relationship between the corrected sensor
response, R − R
0
and the number of concert hall oc-
cupants, see eq. ??.
The results presented in Figure ?? allow to con-
clude that there may not be established a linear rela-
tionship between the raw sensor response, R and the
number of people in the concert hall. It is shown that
the coefficient of determination, R
2
increased with the
SENSORNETS 2018 - 7th International Conference on Sensor Networks
152
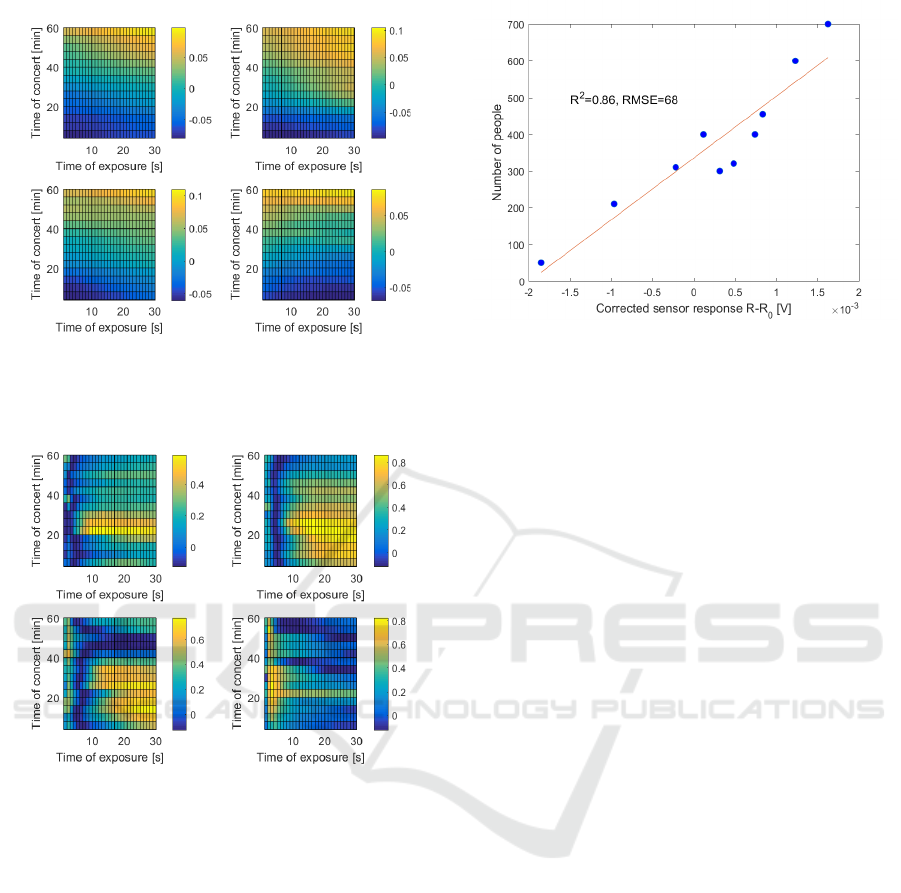
Figure 9: Coefficient of determination R
2
for linear regres-
sion models linking TGS2600 sensor response R
i, j,k
with
the number of people in the concert hall. Subplots refer to
individual sampling points, as shown in Figure ??.
Figure 10: Coefficient of determination R
2
for linear regres-
sion models linking TGS2600 sensor response R
i, j,k
−R
0
j,k
with the number of people in the concert hall. Subplots refer
to sampling point, as shown in Figure ??.
progress of the concert. However, after one hour it
still remained smaller than R
2
= 0.1, which indicates
total inadequacy of linear regression model. Typical
concerts do not last longer than 1.5 h so the consider-
able improvement would not be achieved by extend-
ing the time of the analysis. Based on our results, the
sensor response in its raw form, R is not suitable for
quantifying the occupancy impact on indoor air using
the sensor system with multi-point-sampling and the
measurement arrangement considered in this work.
The results presented in Figure ?? allow to draw
the conclusion that the relationship between the cor-
rected sensor response, R−R
0
and the number of peo-
ple in the concert hall may be described by the linear
model. As shown, the coefficient of determination R
2
reached values exceeding R
2
= 0.8, which indicates
high adequacy of linear regression. The relationship
Figure 11: Best linear fit of the relationship between the
corrected response of TGS2600 sensor and the number of
people. Sampling point 2, sensor signal recorded during
19
t
h minute of the concert and 20
t
h second of exposure.
was not equally strong at each measurement point. As
shown in Figure ??, it was most vivid in locations 2
and 4. The strength of the relationship was also de-
pendent on the time of the measurement. More pre-
cisely it was dependent on the time which elapsed
from the beginning of the concert as well as on the
advancement of the individual exposure of the sen-
sor. In case of measurement point 2, the best fitting
was achieved between 16 and 28 min of the concert
and between 15 and 25 s of sensor exposure, although
later points of exposure could also be used. Regard-
ing measurement point 4, high linearity was observed
during almost entire concert. However, only the be-
ginning of each individual sensor exposure, between
2 and 6 second, provided useful data.
The best relationship between sensor response and
the number of people in the concert hall was obtained
for measurement point 2, provided the assessment
was based on 19
th
minute of the concert and 20
th
sec-
ond of sensor exposure. The relationship is shown
in Figure ??. In this case the coefficient of deter-
mination was R
2
= 0.86 and the root mean square
error was RMSE=68, which is less than 10% of the
range. Based on our results, the corrected sensor re-
sponse, R − R
0
is suitable for quantifying the occu-
pancy impact on indoor air using sensor system with
multi-point sampling and the measurement arrange-
ment considered in this work.
The analysis presented in this work leads to a cru-
cial conclusion concerning measurements using the
sensor system with multi-point sampling. It shows
that it is essential to perform the measurement accord-
ing to the procedure which includes the stage of sen-
sor regeneration between subsequent exposures to air
delivered from individual sampling points. Thanks
to this stage, it is possible to correct the baseline of
Sensor System with Multi-point Sampling Applied to IAQ Measurements
153

sensor signal. This correction is necessary to achieve
high correlation of sensor response with the number
of people in the indoor space in short term perspec-
tive.
5 CONCLUSIONS
This work examines the selected aspects of sensor
system with multi-point sampling applied for indoor
air monitoring.
The main idea of the system is to perform mea-
surements at several locations using one, stationary
sensor unit. This solution involves a number of tech-
nical and data processing problems. One of them
is the regeneration of semiconductor gas sensors be-
tween exposures to gas samples delivered from differ-
ent locations.
In this work we focused on the role of sensor re-
generation stage in acquiring the information from the
measurement system. The measurement was aimed at
capturing the impact of the audience on indoor air.
The analysis was based on the data collected dur-
ing measurement session in a concert hall. Four mea-
surement points were served by the sensor system,
one point every 4 minutes.
It was shown that raw sensor signal remained un-
correlated with the number of people who occupied
the indoor space. Negative results were obtained at
all sampling points.
However, the raw sensor signal corrected with ref-
erence to the value achieved after the regeneration
phase, well correlated with room occupancy. The
strength of the relationship was dependent on the lo-
cation of the measurement point and the timing of
measurement. The best regression model was highly
adequate (R
2
=0.86).
The obtained results show that sensor system with
multi-point sampling is a promising concept for in-
door air monitoring. In this kind of measurements
sensor regeneration plays crucial role. For achieving
target information it is necessary to apply sensor sig-
nal preprocessing, which consist in baseline correc-
tion.
REFERENCES
Gallego, E., Roca, F.J., Perales, J.F., Sanchez, G. and Esplu-
gas, P. (2012) Characterization and determination of
the odorous charge in the indoor air of a waste treat-
ment facility through the evaluation of volatile organic
compounds (VOCs) using TDGC/MS. Waste Man-
agement 32(12), 2469-2481.
http://www.figaro.co.jp/en/
Moseley, P.T. (2017) Progress in the development of
semiconducting metal oxide gas sensors: a review.
Measurement Science and Technology. 28(8), 082001
(15pp).
Otake, T., Yoshinaga, J. and Yanagisawa, Y. (2001) Analy-
sis of organic esters of plasticizer in indoor air by GC-
MS and GC-FPD. Environmental Science and Tech-
nology 35(15),3099-102.
Smielowska, M., Marc, M. and Zabiegala, B. (2017). In-
door air quality in public utility environmentsa re-
view. Environmental Science and Pollution Research
24(12), 1116611176.
Sun, X., He, J. and Yang, X. (2017) Human breath as a
source of VOCs in the built environment, Part II: Con-
centration levels, emission rates and factor analysis.
Building Environment 123, 437-445.
Szczurek, A., Maciejewska, M., Teuerle, M. and Wyloman-
ska, A. (2015) Method to characterize collective im-
pact of factors on indor air. Physica A 420, 190199.
WHO (2010). WHO guidelines for indoor air quality: se-
lected pollutants In Bonn Office, World Health Orga-
nization 2010, ISBN 978 92 890 02134.
Wolkoff, P. (2013). Indoor air pollutants in office envi-
ronments: Assessment of comfort, health, and perfor-
mance. International Journal of Hygiene and Envi-
ronmental Health 216(4), 371-394.
Yocom, J.E. and McCarthy, S.M. (1991) Measuring In-
door Air Quality: A Practical Guide. Wiley; 1 edition,
ISBN-10: 0471907286.
Zhang, Y., Zhao, J., Du, T., Zhu, Z., Zhang J. and Liu Q.
(2017) A gas sensor array for the simultaneous detec-
tion of multiple VOCs. Scientific Reports 7 ,Article
number: 1960.
SENSORNETS 2018 - 7th International Conference on Sensor Networks
154
