
Using Fine Grained Programming Error Data to Enhance CS1 Pedagogy
Fatima Abu Deeb, Antonella DiLillo and Timothy Hickey
Brandeis University, Computer Science Department, 415 South Street, Waltham, MA, USA 02453, U.S.A.
Keywords:
Near-peer Mentoring, Peer Led Team Learning, Study Group Formation, Online IDEs, Educational Data
Mining, Hierarchical Clustering, Classroom Orchestration, Markov Models, Machine Learning, Learning
Analytics.
Abstract:
The paper reports on our experience using the log files from Spinoza, an online IDE for Java and Python, to
enhance the pedagogy in Introductory Programming classes (CS1). Spinoza provides a web-based IDE that
offers programming problems with automatic unit-testing. Students get immediate feedback and can resubmit
until they get a correct program or give up. Spinoza stores all of their attempts and provides orchestration tools
for the instructor to monitor student programming performance in real-time. These log files can be used to
introduce a wide variety of effective pedagogical practices into CS1 and this paper provides several examples.
One of the simplest is forming recitation groups based on features of student’s problem solving behavior over
the previous week. There are many real-time applications of the log data in which the most common errors
that students make are detected during an in-class programming exercise and those errors are then used to
either provide debugging practice or to provide the examples of buggy programming style. Finally, we discuss
the possible use of machine learning clustering algorithms in recitation group formation.
1 INTRODUCTION
The rapidly increasing class sizes for introductory
Computer Science courses (CS1) make it challeng-
ing to provide effective pedagogy with increasingly
large student/teacher ratios. In this paper we de-
scribe our experience in using log files from an online
IDE to enhance CS1 pedagogy in two large courses,
one taught in Java and the other in Python. There
are many on-line IDEs available today (e.g. coding-
bat.com, repl.it, pythontutor.com). We developed the
online IDE Spinoza (Abu Deeb and Hickey, 2015b;
Abu Deeb and Hickey, 2015a; Abu Deeb and Hickey,
2017) which differs from the others in that it has a
much greater focus on orchestration support for the
instructor which provides real-time views of the per-
formance of the entire class as well as individual
students and off-line access to the detailed log files.
There are two versions of Spinoza available, Spinoza
1.0 (Abu Deeb and Hickey, 2015b; Abu Deeb and
Hickey, 2015a; Tarimo et al., 2016) provides an IDE
for Java programs and limited orchestration tools.
Spinoza 2.0(Abu Deeb and Hickey, 2017) provides an
IDE for Python and has a much richer set of orches-
tration tools.
One of the main benefits of using an on-line
IDE in Introductory Programming Classes (usually
referred to as CS1 classes) is that it provides immedi-
ate access to the students’ attempts at solving a prob-
lem, and this data can be used in a variety of ways,
such as forming study groups using knowledge of the
kinds of errors the students make, as well as providing
in-class activities that use the students’ own mistakes
to provide a basis for discussion and debugging prac-
tice.
Spinoza provides a wealth of real-time learning
analytics collected while the students are attempting
to solve programming problems. This learning an-
alytics data can be used in real-time to improve the
effectiveness of classroom orchestration. For our pur-
poses, orchestration refers to the instructor’s ability
to respond effectively to a diverse class of learners
in real-time. Prieto (Prieto et al., 2011) provides a
comprehensive overview of the theory and practice of
classroom orchestration. Ihantola, et. al. (Ihantola
et al., 2015) provide an extensive overview of educa-
tional data mining and learning analytics for program-
ming classes and its use in improving the instruction
and guiding at-risk students. This kind of data can
also be used to study particular styles of student learn-
ing, for example, Berland (Berland et al., 2013) col-
lected log data for novice programmers and used it to
study their learning pathways.
28
Abu Deeb, F., DiLillo, A. and Hickey, T.
Using Fine Grained Programming Error Data to Enhance CS1 Pedagogy.
DOI: 10.5220/0006666400280037
In Proceedings of the 10th International Conference on Computer Supported Education (CSEDU 2018), pages 28-37
ISBN: 978-989-758-291-2
Copyright
c
2019 by SCITEPRESS – Science and Technology Publications, Lda. All rights reserved

2 COLLABORATIVE LEARNING
There is a growing body of evidence that students
benefit from working together to solve problems in
teams. When this approach is combined with near
peer mentors, it has been shown to be especially ef-
fective at increasing retention of under-represented
minorities and is called Peer Lead Team Learning
(PLTL) (Newhall et al., 2014; Horwitz et al., 2009).
In PLTL students are grouped together in teams of
size 4-8 and meet weekly with experienced under-
graduate mentors to practice problem solving skills
and work on programming assignments that are re-
lated to the course material introduced that week.
This kind of intervention increased the participation
of Under Represented Groups (URGs) and improved
their success rates in introductory computer science
classes (Li et al., 2013; Teague, 2009). In these stud-
ies, students who participated in PLTL tended to ap-
preciate the effort of the teaching staff more than the
non-PLTL students. Furthermore, more of the PLTL
students thought that the instructor gave adequate
support to students with no previous programming
experience in comparison with the non-intervention
group. The researchers note that this kind of team
gives members of URGs the sense of belonging and
security that is absent in so many Computer Science
classes.
In this paper we will show two ways in which
Spinoza log files can be used to form PLTL teams
based on actual student programming behavior data.
The first approach was applied and validated in a large
Java Programming Class. For the second approach,
we show how machine learning can be used to form
teams, but we have not yet applied this technique in
a classroom; validation of this new approach will be
part of our future work in this project.
There is a large body of literature on methods for
forming collaborative learning groups using informa-
tion about the students to form either homogeneous or
heterogeneous groups, see for example (Sadeghi and
Kardan, 2015). Our interest in this paper is not to
validate the effectiveness of collaborative groups, but
rather to show another approach to forming either ho-
mogeneous or heterogeneous groups. Future research
is needed to determine the relative effectiveness of
this approach compared to others. Our approach can
be used with other techniques using more traditional
information about students, e.g. (Ricco et al., 2010).
3 SPINOZA-1.0/JAVA
Spinoza 1.0 is an on-line problem solving learning
environment for coding (PSLEC) designed to allow
the instructor to create and share small Java pro-
gramming problems. Each problem asks the student
to write the body of a method that would automat-
ically be checked for correctness by running a suite
of instructor-supplied unit tests when they compile
the code. Each time a student clicks the ”run” but-
ton, Spinoza stores a copy of the submitted code, a
time stamp, the userId, the percentage of correct unit
test results, the type of error (e.g. syntax error, run-
time error) and the hash of the vector resulting from
the instructor supplied unit tests. Fig. 1 shows the
Spinoza user interface after the user pushes the ”run”
button. There are some correct (green) and some in-
correct (red) results in the unit tests in this example.
The problem description is in the upper left frame,
the student’s attempted solution is in the upper mid-
dle frame, and the program output is in the upper right
frame. The lower frame shows the results of the unit
tests.
4 SPINOZA TEAM FORMATION
In the Fall 2016 semester, we were responsible for
the recitation sections of the Introduction to Java Pro-
gramming class (CS11a) at Brandeis University. It
had almost 280 students (140 per section in two sec-
tions) with a wide variety of different backgrounds
and exposures to programming and mathematics.
Teaching a large class with such disparities between
students is a challenging task. To improve student re-
tention, we introduced a peer-led team learning ap-
proach (PLTL) for the recitations in which the teams
would change every week, based on the student’s per-
formance the previous week.
The mandatory recitation was based on a varia-
tion of the near-peer mentoring technique, in which
a group of students (ranging from 5-20) worked on a
set of programming problems with an undergraduate
mentor to help them whenever they were stuck. In
these recitations, students worked on the same prob-
lems and were encouraged to talk with other stu-
dents about the programming problems but every stu-
dent needed to write their solution alone using the
Spinoza 1.0 web application. The mentors were se-
lected based on their performance when they took the
class in a previous semester as well as their ability to
work with students. They had an initial mentor train-
ing session at the beginning of the semester and they
met weekly with the instructor to debrief the previous
Using Fine Grained Programming Error Data to Enhance CS1 Pedagogy
29
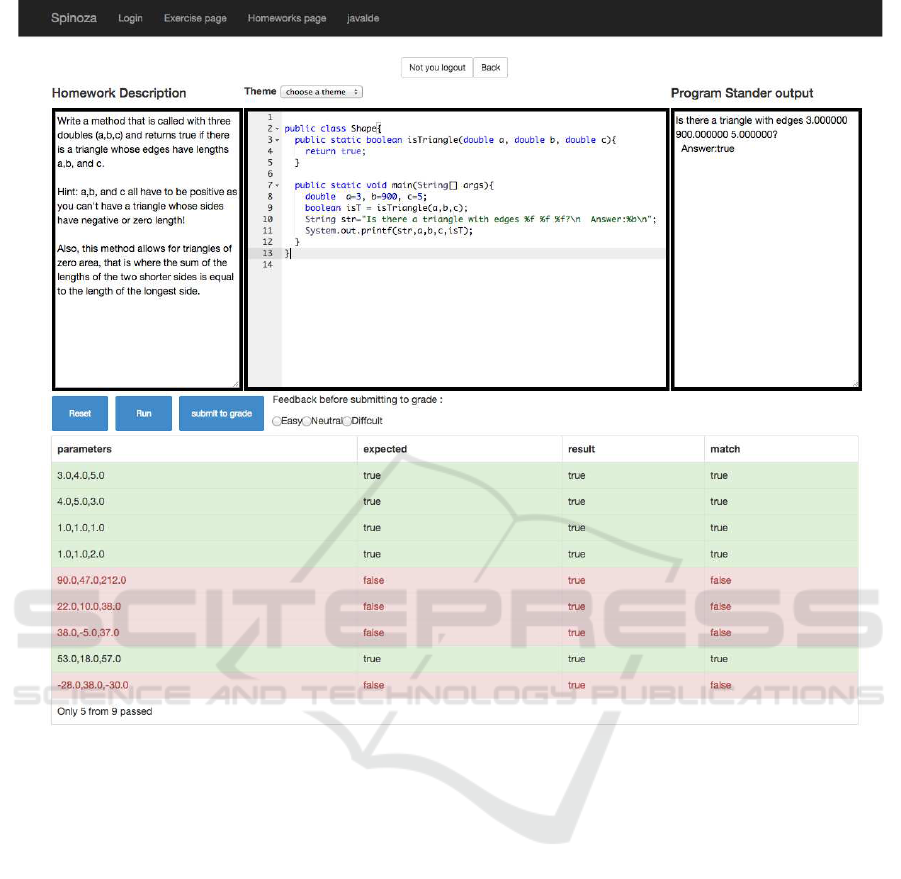
Figure 1: Spinoza 1.0 User Interface.
week’s recitation and plan for the next week’s recita-
tion.
Our hypothesis, based on our experience with un-
balanced groups in previous years, was that in order
for the groups to be effective, students with roughly
the same level should be placed together.
To form effective groups initially, we sent a survey
to all CS11a students. This survey contained ques-
tions about their goals in taking the class, their previ-
ous Math experience, and their programming experi-
ence. It also challenged them to solve a few program-
ming problems (in the language of their choice). The
women in the class were also asked if they preferred
to work in a women-only group.
50 students did not answer the survey, so we had
to place them in groups blindly. With the 230 students
who did answer the survey, we grouped them into 13
groups as follows:
• Group 1 was a women-only group, that contained
all woman who indicated they would prefer to be
in a woman or non-binary group, There were 14
students in this group.
• Group 2 consisted of all students whose primary
goal in taking this class was simply to explore
computer science. These students did not have
any programming experience. There were 12 stu-
dents in this group
• Groups 3-7 were the students who wanted to ma-
jor in computer science but had no previous pro-
gramming experience. We grouped these students
according to level of their math experience.
• Groups 8-13 were students whose goal in tak-
ing this course was to improve their programming
skills. These students were formed into subgroups
based on the level of their programming experi-
ence.
• Groups 14-16. The remaining 50 students did
not answer the survey so we divided them into 3
groups randomly.
CSEDU 2018 - 10th International Conference on Computer Supported Education
30
Students met in these groups for the first two weeks
and used Spinoza to solve programming problems
with help from the near-peer mentors and each other.
The first recitation introduced the students to Spinoza.
All of the other recitations provided the students with
6 problems to work on.
In week 3, we used the results captured by Spinoza
from their week 2 recitation to form 17 groups. From
the Spinoza logs, we extracted the number of prob-
lems each student tried and the number they solved
correctly during the recitation as well as the number
of attempts they made on the problems.
We moved any students who solved at least 4 out
of the 6 problems during recitation time to group 17
there were 93 students in this group and we assigned 3
mentors to them. This was the group of students who
generally understood the material and had mastered
the skills for that week.
We grouped the rest based on how many problems
they solved correctly. The group size ranged from
20 to 5, where students who seemed to be struggling
more were put into smaller groups. The larger groups
(that contained 20 or so) are the ones whose students
solved 3 programming problems. The smaller groups
(with 5 or so students) were formed from students that
tried some problems but were not able to correctly
solve any problems. For the students that solved the
same number of problems, we ranked them according
to the average number of attempts for each problem
and used this to form groups.
4.1 Assessing Effectiveness
Students were asked to complete a survey after each
recitation which would allow us to estimate the effec-
tiveness of the recitation groups. We collected 1298
survey responses after 8 recitations (about 160 re-
sponses per recitation). The results indicate that the
recitation groups were generally successful, from the
students’ point of view.
Students felt that their mentor was helpful (7.8/10)
and that the recitation itself was helpful (6.9/10) and
they enjoyed the recitation (6.7/10). About 78% felt
the groups were the right size. About 20% felt their
recitation group was too large, these were mostly stu-
dents in the one large recitation group.
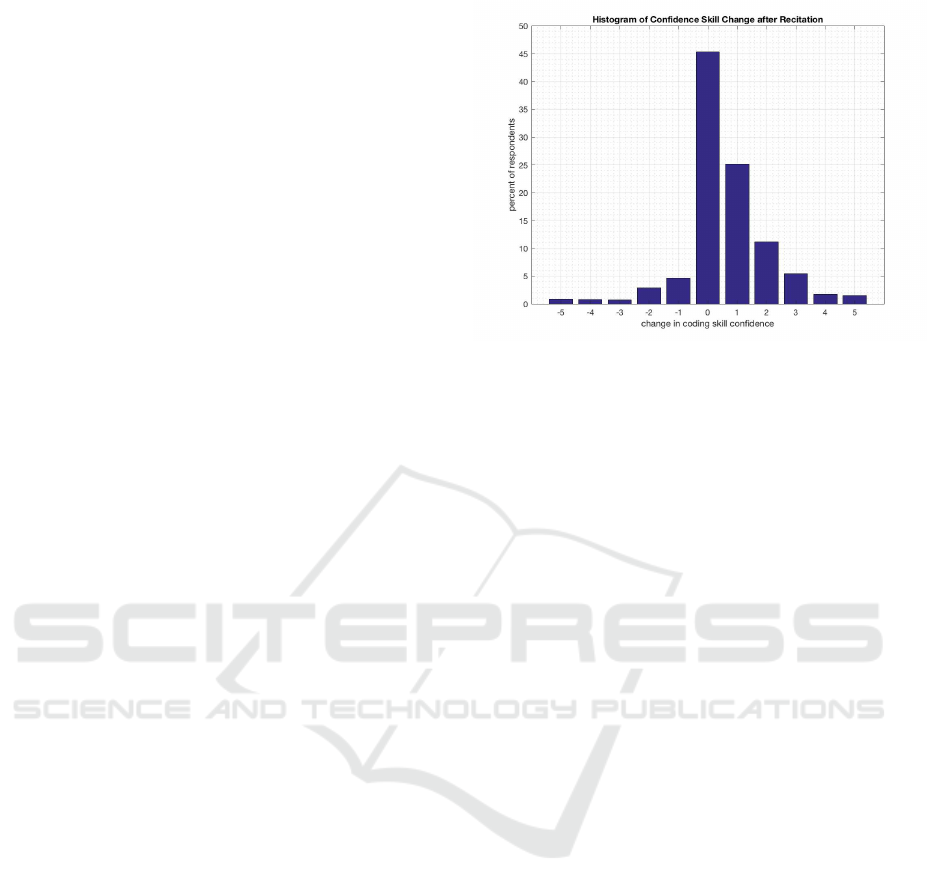
We asked how confident they were of their coding
skills before and after the recitation on a 0 to 10 scale.
Looking at change in individual students we see in
Fig. 2 that 45% of the time students had no change in
confidence of their programming ability, while 45%
felt that they had increased confidence. The average
change in confidence was 0.59. A small percentage
of the times (10%), they felt less confident. We per-
Figure 2: Histogram of change in Confidence in Program-
ming Ability after the recitations.
formed a paired T-test on the confidence levels of stu-
dents before and after the recitations. The mean level
of confidence increased from 6.74 (sd=2.23) before
the recitations to 7.33 (sd=2.18) after the recitations.
The difference is 0.58 (95% CI [0.5, 0.68]) which is
statistically significant (t = 13.53, p < 0.0001). This
result indicates that the recitations increased the con-
fidence of the students, as we would expect from pre-
vious research on the effectiveness of collaborative
learning.
We repeated the paired T-test looking only at
novices (as self reported by the students), or only
at non-novices who had some previous programming
experience before taking this introductory class. We
found the same statistically significant increase in
confidence for both groups. The novices increase in
confidence went from 6.41 (sd=2.1) to 7.07 (sd=2.4)
which was an increase of 0.66 (95% CI [0.42, 0.90])
which was statistically significant at the p < 0.0001
level. The non-novices went from 7.45 (sd=2.0) to
7.99 (sd=1.8) which was an increase of 0.54 (95% CI
[0.25, 0.82]) which was statistically significant at the
p < 0.0001 level. The experts were 1.04 more confi-
dent than the novices before the recitations and about
0.92 more confident than the novices after the recita-
tions, but there was no statistically significant differ-
ence in the amounts that they increased in confidence.
The recitations were effective for both novices and ex-
perts.
We were generally pleased with the effectiveness
of the Spinoza-based team formation algorithm. In
earlier years we had seen some dysfunctional teams
in which one struggling student would become very
demoralized when placed in a team of high achiev-
ing students. With our current approach there were
no reports of that sort of dysfunction. In future stud-
ies, we will include survey questions to detect team
Using Fine Grained Programming Error Data to Enhance CS1 Pedagogy
31
dysfunction to obtain a quantitative measure of team
effectiveness.
Nevertheless, we feel that the data collected by
Spinoza could be leveraged to provide even more ef-
fective team formation by accurately grouping stu-
dents by their actual problem solving characteristics.
In the remainder of this paper, we describe Spinoza
2.0, a more sophisticated version of Spinoza that we
developed and used in a fully flipped CS1 class with
no recitations. We also show how machine learning
could be used to classify students based on the actual
programming behavior in the class. In the future, we
plan to use this classification data to form Peer-Led
Team Learning recitation groups.
Future work also includes comparing the effec-
tiveness of these various Group Formation algorithms
on learning outcomes and other measures of effective
group formation.
5 SPINOZA-2.0/PYTHON
Spinoza 2.0 was designed to allow students to im-
merse themselves in problem solving activities in the
classroom. It differs from Spinoza 1.0 in several
ways. First, it was designed to be used with Python
instead of Java, and the system runs the code in the
browser instead of running the code on the server,
which makes it much more scalable. Second, it was
designed with many more instructor views that sup-
port orchestration in the classroom. These tools give
the instructor a detailed view of the performance of
the students and allow her to decide when to stop a
coding activity and switch back into lecture mode. In
this section, we discuss several Spinoza 2.0 activities
which use information on students’ errors to enhance
their educational experience.
5.1 Spinoza Markov Models
Spinoza 2.0 was coupled with features that facilitate
teacher orchestration. It provides a dashboard for
the instructor to see the progress of the entire class
working on the current problem in real time using
multiple views. One of these sophisticated views is
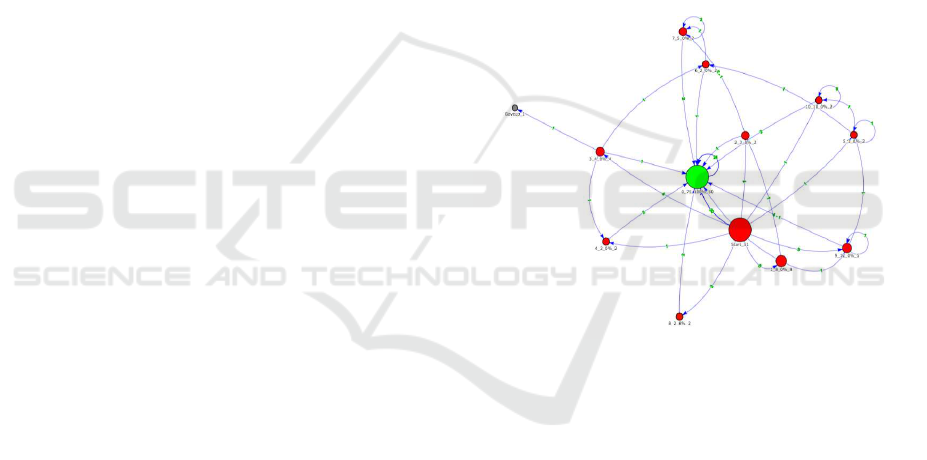
the Spinoza Markov Model (SMM) (Abu Deeb et al.,
2016). An example is shown in Fig. 3. The SMM
is a graph whose nodes are the equivalence classes
of student programs submitted for the current prob-
lem. Two programs are equivalent if they produce the
same values on the instructor-supplied unit tests. The
size of each node is the number of programs in that
equivalence class. The color corresponds to the per-
centage of unit tests that the programs satisfied. An
edge between nodes A and B is labeled by the number
of times students first submitted a program in equiva-
lence class A and then submitted their next attempt in
equivalence class B. In this way it gives an overview
of the common programming errors and the common
order in which they appear.
Each SMM has a start node, representing the start-
ing state of the programming exercise, the correct so-
lution node if at least one student solved the problem
correctly, and a ’give up’ node. All the other nodes
represent students’ incorrect attempts at solving the
problem. The SMM is drawn in real-time and the in-
structor can click on each node and use the arrow keys
to page through each of the programs in that equiva-
lence class and discuss it in the class. The color and
the size are chosen to represent the correctness of the
attempts and how often this error are made by the stu-
dents respectively.
Figure 3: Spinoza Markov Model.
During class, it can be effective to look at the most
common errors (as classified by their behavior on unit
tests) and then look at each of the different ways stu-
dents were able to make that error, i.e. using the
Spinoza feature that lets the instructor browse each of
the programs in that equivalence class. It is also help-
ful to scan all of the successful programs to comment
on programming style.
5.2 Solve-Then-Debug
One issue with having students work on programming
problems in class or in a recitation is that students
work at different rates. The fast students will com-
plete the problem in a few minutes and typically have
nothing to do while everyone else completes the prob-
lem. Initially, we would wait until a threshold num-
ber of students had completed the problem (typically
75-80%) before discussing the solutions and errors,
CSEDU 2018 - 10th International Conference on Computer Supported Education
32

but this meant that over half of the students would be
non-engaged during at least part of the exercise.
Spinoza 2.0 provides a solution to this challenge
by requiring students who solved a programming
problem to get experience in debugging by analyzing
the most common errors that the class has made (and
is making) on that problem. This is called the ”Solve-
Then-Debug” activity. This activity becomes visible
when the students have solved the problem correctly
and it allows them to debug the most common er-
rors that their classmates have made in the process
up to that point in time. They classify the kind of er-
ror (syntax, run-time, incomplete program, ”I don’t
know”) and give a comment describing the error and
how it could be fixed. If the instructor so chooses,
these comments can then become accessible to stu-
dents who are still trying to solve the problem and are
generating similar errors (i.e. in the same equivalence
class). The comments are meant to be hints that may
or may not be helpful.
5.3 Spinoza Problem Solving
Engagement Graphs
Another Spinoza 2.0 instructor view is the student
engagement graph Fig. 4 that gives the instructor an
idea, in real time, of how many students have started
working on the exercise (i.e have pressed the run but-
ton at least one time), how many have successfully
solved it and how many have submitted at least one
solve-then-debug comment.
The graph in Fig. 4 represents the students’ in-
teraction with one of Spinoza problems, where the x
axis represent the minutes and the y axis represents
the number of students in each category. The top sec-
tion are students who have started the problem but not
yet solved it correctly (red). The middle group are
those who have solved it, but haven’t begun to clas-
sify other students’ errors (green). The lower group
are those who have started to classify other students’
errors (gray).
This engagement graph is generated in real-time
and can be used by the instructor to guide the class.
Students are asked to solve the problem and then were
required to make at least 10 solve-then-debug com-
ments. This particular graph shows the engagement
of a class of 125 students working on solving a pro-
gramming problem with Spinoza. After two minutes
about half of the students (70/125) had submitted an
attempted solution and the first students were getting
correct answers. At minute 3 about three quarters of
the students (90/125) had submitted an attempted so-
lution, but only 5 students had submitted correct so-
lutions and only one student had submitted a Solve-
Then-Debug review. This was a pretty typical engage-
ment graph up to this point.
Over the next 8 minutes however the number of
students submitting correct solutions only increased
from 5 to 40, and the number of Solve-Then-Debug
reviews also slowly increased to 15. By Minute 10
only a quarter of the students (30/120) were able to
solve the problem correctly. So the instructor stopped
the activity and discussed common mistakes as well
as showing the variety of approaches students had
used to solve the problem. The number of students
submitting correct solutions rapidly rose from 30 to
95 in this period as students corrected their attempted
solutions.
The instructor moved on to another activity at
minute 16, but we see that some students continued to
work on this problem or on submitting reviews. With-
out a visualization tool like the Engagement Graph
this type of classroom orchestration would be much
harder to carry out effectively.
Figure 4: Spinoza Engagment Graph. The horizontal axis
is number of minutes since the first run time attempt. The
vertical axis represents the number of students who are in a
particular stage of the process of working on a problem.
5.4 Just-in-Time Contact of At-risk
Students
When we were using Spinoza 1.0, not all the students
solved the problems as there was very little grade in-
centive to complete the problems, but when we used
Spinoza 2.0 students worked on Spinoza problems
each day in class and 5% of the final grade was al-
located to trying the Spinoza problems and another
5% for getting them correct. There was no required
recitation for this class so groups were not formed but
we used the data stored by Spinoza to keep track of
at-risk students.
Using the Spinoza Attendance View we sent
emails after each class to the students who did
not solve some instructor-specified percentage of the
problems in that day’s class and we offered help if
they felt it was needed. By the end of the semester
over 95% of the students had correctly completed
Using Fine Grained Programming Error Data to Enhance CS1 Pedagogy
33
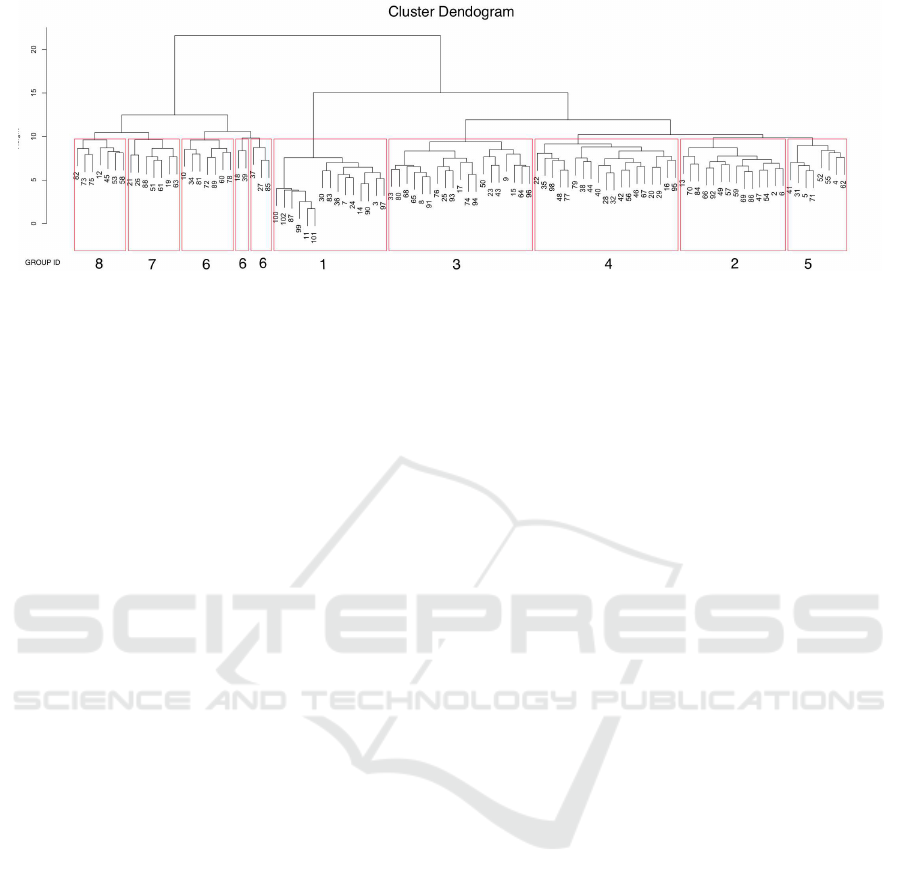
Figure 5: Hierarchical Clustering of Novice Programmers based on their programming errors. The leaves of the tree are
labeled with the anonymized student id number. The groups are formed from subtrees of the cluster dendogram which
correspond to groups of students whose collection of incorrect attempts are somewhat similar. The vertical axis is a measure
of the number of differences between the problems sets in a subtree.
all of the 120 Spinoza problems assigned during the
semester.
5.5 Clustering Students using Error
Logs
In this section we propose a new approach to clus-
tering students using Spinoza data that can be used
to form recitation or other groups based on the kinds
of errors students make. We also give an example of
how it could be used. In our previous approach using
Spinoza 1.0 we grouped students using the number of
problems they solved correctly.
There are two basic approaches to using data
about student’s programming errors to form groups:
• form groups of students who make similar mis-
takes which could make it easier for their mentor
to help them,
• form groups of students with different issues, so
that each group has a diversity of strengths and
weaknesses and they can help each other under-
stand the concepts
The second approach can be realized by first form-
ing groups of similar students, and then picking one
or two students from each of the ”similarity” groups
to form a ”diversity” group, so we focus here on the
”similarity” group formation.
The key idea is to create a boolean-valued table
where the rows correspond to the students and the
columns correspond to all equivalence classes of at-
tempted solutions to problems for which at least 10%
of the class made that attempt. Each row specifies
which of the attempts were made by that particular
student. We can then apply hierarchical clustering
on the rows to automatically create a cluster dendo-
gram whose subtrees corresponds to groups of stu-
dents with similar sets of programming errors. By
cutting this dendogram at a particular depth, the sub-
trees at that depth provide a classification of students
into groups with roughly the same level of similarity.
Fig. 5 shows such a clustering (generated using
using the hclust command in the statistical program-
ming system R) of all of the novice students (as self-
reported on an initial survey) using the data from
about halfway through the semester, immediately be-
fore the second quiz. There were 158 students in the
class, but we only classified the 101 students who self-
identified as novices.
Each leaf of the tree in Fig. 5 corresponds to a sin-
gle novice student and the interior nodes of the tree
correspond to groups of students appearing as descen-
dants of that node. The students are represented by
a binary vector encoding which of 198 possible at-
tempts were actually made by that student over the
semester. The 198 attempts correspond to all incor-
rect attempts made by at least 10% of the students
over the course of the semester; we call these the com-
mon attempts. For each particular student, their vec-
tor has a 1 for each common attempt they made and a
0 for each common attempt they didn’t make.
The y axis of an interior node is a measure of the
variance of the students in that cluster. Larger num-
bers correspond to clusters with a greater amount of
variance. The clustering algorithm initially puts all
students in their own cluster and then iteratively se-
lects a pair of clusters whose union has the smallest
variance, and joins those two to form a new cluster.
We grouped the three smallest clusters into a sin-
gle cluster, labeled group 6, this corresponds to cut-
ting the dendronic tree one level higher for those clus-
ters.
We would hope that students in the same group as
formed by this hierarchical clustering method would
also share other behavioral similarities in addition to
making similar errors. Fig. 6 validates this hypothesis
CSEDU 2018 - 10th International Conference on Computer Supported Education
34
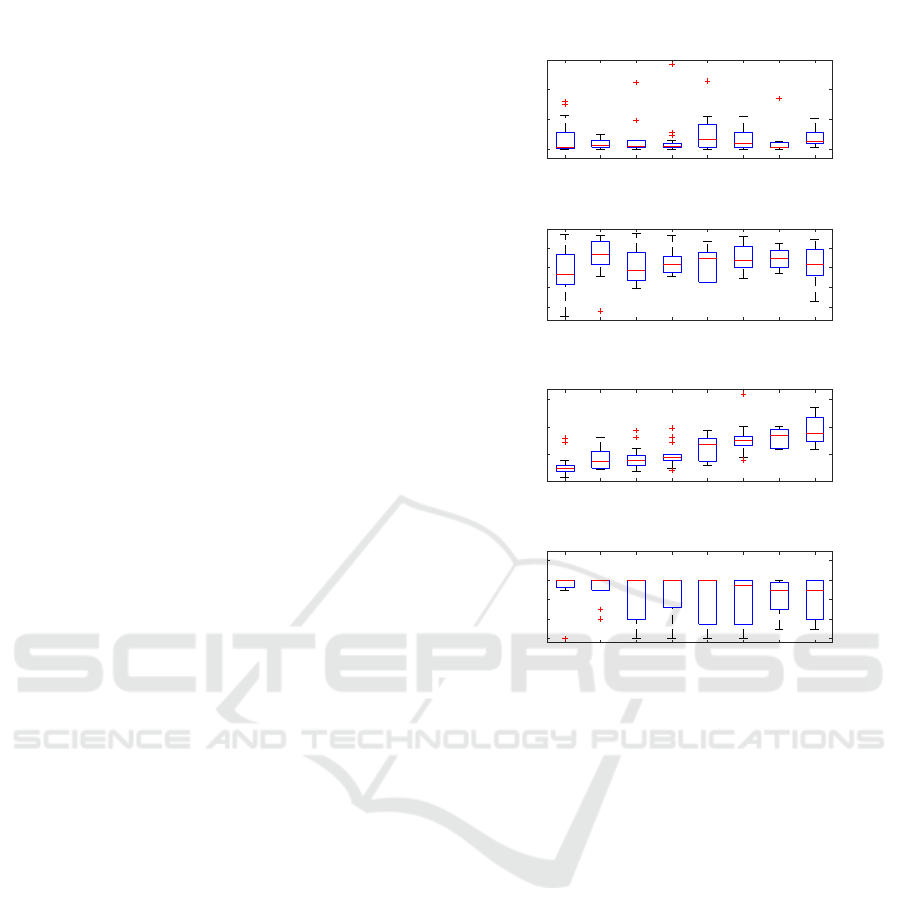
by showing box and whisker plots of four different
features of these groups
• number of ”I don’t know” debugging comments
• number of problems solved correctly before Quiz
2
• number of attempted solutions to all problems
• score on Quiz 2 (out of 6 points)
The groups were renumbered so that the average num-
ber of attempted solutions for the groups would be
linearly ordered.
The plots in Fig. 6 demonstrate that the groups
have significantly different programming behaviors.
For example, as the average number of attempts per
group increases, the average score on Quiz 2, goes
down, indicating (not surprisingly) that these are
weaker students. Although groups 1 and 2 performed
similarly on Quiz 2, they have quite different num-
ber of problems solved correctly and attempted solu-
tions. Each of these features gives a different view of
the students and the hierarchical clustering provides
a convenient way of automatically grouping students
with similar features.
In the future, we plan to use hierarchical cluster-
ing based groupings to form Peer Led Team Learning
groups for Introductory Programming courses. This
particular class was fully flipped with almost no lec-
turing, and we didn’t require recitations; but the cur-
rent study suggests that this approach would be useful
in team formation and future versions of the class will
have recitations formed in this manner.
6 RELATED WORK
In response to the pressing need to increase the reten-
tion rates in Introductory Computer Science classes
while simultaneously dealing with rapidly increasing
enrollments in those courses and a relatively slow
growth in teaching faculty, many researchers have at-
tempted to use technology and new pedagogical prac-
tices to provide additional academic support. Our
work can be seen in this context as we have tried to
form supportive recitation groups and to use Spinoza
log data to more effectively orchestrate large class
lessons.
There is a growing body of research focused
on creating applications that support collaboration
(Flieger and Palmer, 2010). In computer science, the
most common collaboration style is in the form of pair
programming which shows various benefits includ-
ing improving the quality of submitted programs by
1 2 3 4 5 6 7 8
group number
0
20
40
60
number of IDK debug comments
1 2 3 4 5 6 7 8
group number
20
40
60
80
number of problems solved correctly
1 2 3 4 5 6 7 8
group number
0
1000
2000
3000
number of attempted solutions
1 2 3 4 5 6 7 8
group number
0
2
4
6
8
score on quiz2
Figure 6: Difference in the features of students in each of
the 8 groups.
the pair, increased engagement and more positive at-
titudes toward the field. (Nagappan et al., 2003; Mar-
Tin et al., 2013). These benefits depend on choosing
the right pair, since an ineffective pairing could hinder
learning.
Many researchers have indicated that the most ef-
fective pairs are the ones matched by similar skill lev-
els, but it is difficult to measure skill level. Some
researchers have used grades on the exam as a fac-
tor to form the group, others have used a combina-
tion of exam scores and SAT scores, but exam and
SAT scores do not necessarily correlate to program-
ming skill. (Watkins and Watkins, 2009; Katira et al.,
2004; Byckling and Sajaniemi, 2006). Our approach
of using fine-grained log data from online IDEs po-
tentially provides a much more accurate model of pro-
gramming skill.
The research that is most similar to ours is that of
Berland et al. In their paper (Berland et al., 2015),
they describe a teacher orchestration tool that gives
instructors real-time information about possible pairs
in a visual programming environment. The idea is to
have students initially work on a problem individually
and then to ask students who are generating similar
Using Fine Grained Programming Error Data to Enhance CS1 Pedagogy
35

approaches to work together. Their system converts
the students’ visual block code to normalized parse
trees and identifies pairs of students with similar parse
trees. Students continue working on their own code
and if a pair diverges, then the instructor may choose
to put them in different pairs during the same problem
solving activity.
Berland’s approach might be also feasible in Java
and Python programming classes if we used a real-
time version of the Spinoza-style hierarchical clus-
tering for the current problem to identify students
with similar approaches and encourage them to sit to-
gether.
Our work on hierarchical clustering is somewhat
similar to (Merceron and Yacef, 2005) in which they
report on their work on clustering students based on
their mistakes in an on-line educational tool, called
Logic-ITA, for teaching Formal Proof techniques.
The target of this clustering was the students who
tried, but were not able to solve, a collection of prob-
lems. Using a two step clustering technique which
combined k-means and hierarchical clustering, they
were able to form two groups of students based on
this error data. The students in one cluster made
more mistakes than the other and by looking closely
at the sequence of errors they discovered that one
group used a guessing strategy to approach the prob-
lem while the other group got confused and gave up
rapidly. The goal of this clustering was to give the in-
structor an evaluation of the students so based on the
cluster he could explain the problem again or appro-
priately readjust the difficulty of the exercises for the
students in each cluster.
Our research is also related to other research that
focuses on creating collaborative groups, but is con-
cerned with new techniques for forming groups, and
relies on other research into the effectiveness of dif-
ferent group formation strategies. Sadeghi (Sadeghi
and Kardan, 2015) reviews previous work on group
formation. These groups could be homogeneous or
heterogeneous and the groups formation can be based
on many criteria such as previous knowledge level,
learning style, thinking style, personal traits, degree
of interest in the subject and the degree of the motiva-
tion. Bekele’s (Bekele, 2006) work indicates that ho-
mogeneous groups are suited more for achieving par-
ticular educational goals, while heterogeneous groups
tend to be more innovative and creative and hence bet-
ter for open-ended projects.
7 FINAL REMARKS AND
FUTURE WORK
In this paper we have shown that the fine-grained pro-
gramming error data stored in log files of online IDEs
such as Spinoza can be used to extend traditional CS1
pedagogy in several interesting ways. We also spec-
ulated on the possibility of applying machine learn-
ing techniques using this data to obtain more effective
classifications of students based on subtle features of
their programming behavior.
In the future we intend to explore additional ma-
chine learning approaches such as bi-clustering to use
this type of data to gain deeper insights into the way
students solve problems and the kinds of errors they
make while learning to code. We also plan to study
the effectiveness of recitation groups formed using
these methods.
REFERENCES
Abu Deeb, F. and Hickey, T. (2015a). The spinoza code
tutor: faculty poster abstract. Journal of Computing
Sciences in Colleges, 30(6):154–155.
Abu Deeb, F. and Hickey, T. (2015b). Spinoza: the code
tutor.
Abu Deeb, F. and Hickey, T. (2017). Flipping introductory
programming classes using spinoza and agile peda-
gogy. In Frontiers in Education Conference (FIE),
2017 IEEE, pages 1–9. IEEE.
Abu Deeb, F., Kime, K., Torrey, R., and Hickey, T. (2016).
Measuring and visualizing learning with markov mod-
els. In Frontiers in Education Conference (FIE), 2016
IEEE, pages 1–9. IEEE.
Bekele, R. (2006). Computer-assisted learner group forma-
tion based on personality traits.
Berland, M., Davis, D., and Smith, C. P. (2015). Amoeba:
Designing for collaboration in computer science class-
rooms through live learning analytics. International
Journal of Computer-Supported Collaborative Learn-
ing, 10(4):425–447.
Berland, M., Martin, T., Benton, T., Petrick Smith, C., and
Davis, D. (2013). Using learning analytics to under-
stand the learning pathways of novice programmers.
Journal of the Learning Sciences, 22(4):564–599.
Byckling, P. and Sajaniemi, J. (2006). A role-based analy-
sis model for the evaluation of novices’ programming
knowledge development. In Proceedings of the sec-
ond international workshop on Computing education
research, pages 85–96. ACM.
Flieger, J. and Palmer, J. D. (2010). Supporting pair pro-
gramming with javagrinder. Journal of Computing
Sciences in Colleges, 26(2):63–70.
Horwitz, S., Rodger, S. H., Biggers, M., Binkley, D.,
Frantz, C. K., Gundermann, D., Hambrusch, S., Huss-
Lederman, S., Munson, E., Ryder, B., et al. (2009).
CSEDU 2018 - 10th International Conference on Computer Supported Education
36

Using peer-led team learning to increase participation
and success of under-represented groups in introduc-
tory computer science. In ACM SIGCSE Bulletin, vol-
ume 41, pages 163–167. ACM.
Ihantola, P., Vihavainen, A., Ahadi, A., Butler, M., B
¨
orstler,
J., Edwards, S. H., Isohanni, E., Korhonen, A., Pe-
tersen, A., Rivers, K., et al. (2015). Educational data
mining and learning analytics in programming: Liter-
ature review and case studies. In Proceedings of the
2015 ITiCSE on Working Group Reports, pages 41–
63. ACM.
Katira, N., Williams, L., Wiebe, E., Miller, C., Balik, S.,
and Gehringer, E. (2004). On understanding compat-
ibility of student pair programmers. In ACM SIGCSE
Bulletin, volume 36, pages 7–11. ACM.
Li, Z., Plaue, C., and Kraemer, E. (2013). A spirit of ca-
maraderie: The impact of pair programming on reten-
tion. In Software Engineering Education and Train-
ing (CSEE&T), 2013 IEEE 26th Conference on, pages
209–218. IEEE.
MarTin, T., Berland, M., BenTon, T., and SMiTh, C. P.
(2013). Learning programming with ipro: The effects
of a mobile, social programming environment. Jour-
nal of Interactive Learning Research, 24(3):301–328.
Merceron, A. and Yacef, K. (2005). Clustering students to
help evaluate learning. Technology Enhanced Learn-
ing, pages 31–42.
Nagappan, N., Williams, L., Ferzli, M., Wiebe, E., Yang,
K., Miller, C., and Balik, S. (2003). Improving the
cs1 experience with pair programming. ACM SIGCSE
Bulletin, 35(1):359–362.
Newhall, T., Meeden, L., Danner, A., Soni, A., Ruiz, F., and
Wicentowski, R. (2014). A support program for intro-
ductory cs courses that improves student performance
and retains students from underrepresented groups. In
Proceedings of the 45th ACM technical symposium on
Computer science education, pages 433–438. ACM.
Prieto, L. P., Holenko Dlab, M., Guti
´
errez, I., Abdulwahed,
M., and Balid, W. (2011). Orchestrating technology
enhanced learning: a literature review and a concep-
tual framework. International Journal of Technology
Enhanced Learning, 3(6):583–598.
Ricco, G. D., Ohland, M. W., Loughry, M. L., and Lay-
ton, R. A. (2010). Design and Validation of a Web-
Based System for Assigning Members to Teams Us-
ing Instructor-Specified Criteria. Advances in Engi-
neering Education, 2(1).
Sadeghi, H. and Kardan, A. A. (2015). A novel justice-
based linear model for optimal learner group forma-
tion in computer-supported collaborative learning en-
vironments. Computers in Human Behavior, 48:436–
447.
Tarimo, W. T., Abu Deeb, F., and Hickey, T. J. (2016).
Early detection of at-risk students in cs1 using teach-
back/spinoza. Journal of Computing Sciences in Col-
leges, 31(6):105–111.
Teague, D. (2009). A people-first approach to program-
ming. In Proceedings of the Eleventh Australasian
Conference on Computing Education-Volume 95,
pages 171–180. Australian Computer Society, Inc.
Watkins, K. Z. and Watkins, M. J. (2009). Towards min-
imizing pair incompatibilities to help retain under-
represented groups in beginning programming courses
using pair programming. Journal of Computing Sci-
ences in Colleges, 25(2):221–227.
Using Fine Grained Programming Error Data to Enhance CS1 Pedagogy
37
