
Analysis of the Evolution of the UML Metamodel
Zhiyi Ma
1,2
, Huihong He
3
, Jinyang Liu
2,4
and Xiao He
5
1
School of Electronics Engineering & Computer Science, Peking University, Beijing, China
2
Key laboratory of High Confidence Software Technologies (Peking University), Ministry of Education, Beijing, China
3
National Computer Network Emergency Response Technical Team/Coordination Center of China, Beijing, China
4
Academy for Advanced Interdisciplinary Studies, Peking University, Beijing, China
5
School of Computer and Communication Engineering, University of Science and Technology Beijing, Beijing, China
Keywords: Evolution, UML Metamodel, Entropy, Measure.
Abstract: UML has been widely used for modeling applications and it changes continuously. In this situation, it is
reasonable to analyze its evolution. This paper presents an approach to analyzing the evolution of the UML
metamodel by using complex network and information entropy technologies. The approach can provide
insight into the constructive mechanism and future trends of UML, and potentially form the basis for
eliciting improved or novel laws of UML evolution. The study is a contribution for analyzing the evolution
of not only the UML metamodel but also other metamodels like the UML metamodel.
1 INTRODUCTION
Unified Modeling Language (UML) has been widely
used for modeling applications in various fields and
has been improving all along.
Each version of UML has several metaclasses and
a large number of relations between the metaclass,
and thus UML is a complex body of knowledge.
It is inevitable that the complex language has
quality defects, because the design for UML is
closely related to the cognitive ability of designers.
The practice has proved that it is much harder to
design good quality complex diagrammatic
languages (such as UML).
The defects result in a big trouble for building,
understanding, and applying UML. Therefore, a
quality assurance mechanism is necessary for
solving the problems. The key part of the work is
making certain the UML’s structure mechanism.
There is little research on what is the well-
ordered structure of the UML metamodel. It is an
important approach to analyzing the structure
mechanism of the UML metamodel from an
evolutionary point of view.
In this paper, we use information entropy to
analyze the evolution of the UML metamodel, since
information entropy can provide theoretical
underpinnings for software engineering in general
(Clark et al, 2015).
Currently, the crossover study of software
engineering and complex network has obtained
some achievements, and we also explore to use the
achievements to analyze the evolution of the UML
metamodel.
The paper is structured as follows. Section 2
presents our analyzing approach. Section 3 analyzes
data calculated from the 11 versions of UML and
our preliminary observed results. Section 4 further
discusses the preliminary results and the problems
needing to be solved further. Section 5 analyzes
related work. Section 6 draws conclusions.
2 ANALYZING APPROACH
2.1 Structure of the UML Metamodel
The UML metamodel is a complex body of
knowledge. Typically, it consists of hundreds of
metaclasses, a metaclass may have many properties,
and there are complex relationships between
metaclasses. Therefore, packages are used to
organize the metamodel since the packages provide
namespaces for the grouped elements.
According to the UML XMI document, we
unfold the package structure of the UML metamodel
into a directed graph by parsing merge, include, and
import relations between the packages, and obtain
356
Ma, Z., He, H., Liu, J. and He, X.
Analysis of the Evolution of the UML Metamodel.
DOI: 10.5220/0006571303560363
In Proceedings of the 6th International Conference on Model-Driven Engineering and Software Development (MODELSWARD 2018), pages 356-363
ISBN: 978-989-758-283-7
Copyright © 2018 by SCITEPRESS – Science and Technology Publications, Lda. All rights reserved

one metaclass diagram (i.e. one directed graph) for
calculating the UML metamodel.
Moreover, we need to find an approach to
analyzing in detail the distribution of the features of
metaclasses (i.e. property, operation, and OCL
expression) and the distribution of the relations
between the metaclasses, and to exploring the
evolution of the UML metamodel by using statistics,
complex network, and information entropy
technologies.
2.2 Complex Network
We obtain the directed graphs of the 11 versions of
the UML metamodel, and each of them is a network,
which consists of nodes (metaclasses) and directed
edges (inheritances, and compositions,
unidirectional and bidirectional associations).
Each version of the UML metamodel all has
several hundreds or even more than one thousand of
features, and so is relations. Therefore, such a
directed graph from the metamodel is complex, and
it is complex network (Wang et al. 2013).
Using network and statistical methods to analyze
software helps to reveal the essential characteristics
of software, and lay a foundation for quantizing the
complexity of software (He et al. 2008). Barabási
think that complex network is an efficient tool for
handling complex systems and that network
topology (including calculated statistical properties)
is closely related to the evolution of networks
(Barabási,2009). We mainly apply degree
distribution, network density, and average path
length to analyze the UML metamodel and
evolution, along with information entropy.
2.3 Analysis of Entropies
There are some relations between microstates of a
system and its components: the number of
microstates of a system increases with the number
and complex of the components of the system
(Silviu, 1977).
Information theory uses an amount of
information of a system to measure the degree of its
structuralization or systematization, and advocates
that increasing information can order chaotic
systems, in contrast, loss of information can bring
chaos of systems. Moreover, the structure of a
system affects its efficiency of information flow.
One calculates an amount of information of a
system by using information entropy, which is a
measurement of the micro-disorder degree or the
uncertain degree of the information of a system. Let
p(x
i
) be a probability of x
i
occurring in a whole
distribution for a system, and the information
entropy of the system is
-∑p(x
i
)log
2
p(x
i
),i=1,2,..n.
One takes the UML metamodel as a system and
continually modifies its structure or order degree.
While modifying, it receive negentropy or positive
entropy from outside. Therefore, it is far away
balance and its growth is not irreversible, since
UML strives to model as many application fields as
possible and such fields develop continuously.
Moreover, the interaction between the components
of the UML metamodel is nonlinear, i.e. not simply
overlaying the functions of the components.
According to the aforementioned characteristics
of the UML metamodel, it is a dissipative structure
system (Zhang and Vijay, 2012) and is evolutionary,
and thus we measure it with information entropy. In
the paper, the information entropy is a measurement
of the space distribution and randomness of the
structural components of the UML metamodel since
the UML metamodel can be transformed into a size
and complex directed graph. Ideally, the UML
metamodel is well-formed and well-order, i.e. its
entropy is as small as possible.
According to information theory based on
microscopic states, the microstates of the UML
metamodel are its possible existing structural forms,
and the number of the microstates of the metamodel
is a key factor for the entropy of the metamodel.
Therefore, the paper uses microstates to evaluate the
order degree of the UML metamodel. Moreover, for
multi-versions of the UML metamodel, it is
necessary to analyze the change of the entropy of the
property, operation, inheritance, association,
composition, OCL expression, feature, and relation
in the metamodel.
2.3.1 Calculating the Entropy of Basic
Components
The features and relations between the metaclasses
in the UML metamodel are basic components
calculated, and the following algorithm is used to
calculate their entropy:
1. For a given component C, C∈{property, operation,
OCL expression, generalization, association,
composition}, and the UML metamodel M
2. Set the total number of metaclasses of M be N
3. num-set:={}
4. FOR i:= 1 to N
num-set:= num-set∪{the number of C of metaclass
c
i
} //calculating the distribution of the number of C
(e.g. property) of metaclasses of M
Analysis of the Evolution of the UML Metamodel
357

5. FOR each j∈num-set {
5.1. f[j]:=0 // recording the number of the
metaclasses which the number of C of is j
5.2. FOR i:= 1 to N {
IF the number of C of metaclass c
i
= j THEN
f[j]:=f[j]+1
c
i
.C.absolute-frequency:=f[j] // set absolute
frequency on C of c
i
be f[j]
c
i
.C.self-information:=-log
2
(c
i
.C.absolute-
requency/N) //calculating self-information of ci
on C
}
}
6. The entropy on C of M is
-
n
i
((c
i
.C.absolute-frequency/N) × c
i
.C.self-
information)
2.3.2 Calculating the Utility of the UML
Metamodel
The utility of the UML metamodel is the efficiency
of the directed graph. Here, the paper focuses on the
communication efficiency validity and communica-
tion quality validity of the directed graph since both
indexes can figure the utility (Zhang and
Vijay,2012).
By the aid of information entropy theory based
on microscopic states (Zhang and Vijay,2012), the
structure validity of a system
R = 1 – H/H*
Where H and H* is the structure entropy and the
max structure entropy of the system, respectively.
The bigger R is, the better the structure of the system
is, since H should be as small as possible according
to the aforementioned information entropy theory.
Concretely, here H is classified to communica-
tion efficiency entropy and communication quality
entropy.
The communication efficient validity of a system
indicates the velocity of information communication
between all components of the system, and it is
related to the distance of propagation. The measure
of the uncertainty of communication efficient
validity is the communication efficiency entropy of
the system.
The communication quality validity of a system
indicates the accuracy of information communica-
tion between all components of the system, and it is
related to the number of these components (i.e. the
more the components are, the more the chance of the
introduction of communication error is) and to the
affinity within components (i.e. connectivity of
relations between components). The measure of the
uncertainty of communication quality validity of a
system is the communication quality entropy of the
system.
According to aforementioned definitions, we can
see that communication efficiency entropy and
communication quality entropy can be used to
evaluate the manageability and understandability of
the UML metamodel.
(a) Calculating communication efficient validity
According to the definition of communication
efficient validity, the greater the path length between
two metaclasses is, the more difficult the
understanding their relation is.
Communication efficient validity of the UML
metamodel
R
t
= 1 - H
t
/H
t
*
,
where H
t
is communication efficient entropy of the
UML metamodel, and H
t
*
is its max communication
efficient entropy.
Set the UML metamodel have n metaclasses, L
ij
be the sum of path lengths between metaclasses i
and j, and then the total efficient microstates of the
UML metamodel
L =
n
i
n
j1 1
L
ij
, and H
t
*
= log
2
L.
The probability of occurring efficient microstates
between metaclasses i and j
p
ij
= L
ij
/L, and H
t
=
n
i
n
j1 1
-p
ij
log
2
p
ij
.
(b) Calculating communication quality validity
The more the number of needed metaclasses for
defining a metaclass is, the bigger the error
possibility for defining the metaclass is.
Communication quality validity of the UML
metamodel
R
q
=1- H
q
/H
q
*,
where H
q
is communication quality entropy of
the UML metamodel, and H
q
* is max
communication quality entropy.
Set the UML metamodel have n metaclasses, D
i
be the out degree of metaclass i (i.e. the number of
needed direct metaclasses for defining i), and then
the total communication quality microstates
(interconnection) between all metaclasses of the
UML metamodel
MODELSWARD 2018 - 6th International Conference on Model-Driven Engineering and Software Development
358
D =
n
i 1
D
i
, and H
q
*
= log
2
D.
The probability of occurring quality microstates
of metaclasses i
p
i
= D
i
/D, and H
q
=
n
i 1
-p
i
log
2
p
i
.
(c) Calculating the utility of the UML
metamodel
The utility of the UML metamodel =ɑR
t
+ ß R
q
where ɑ and ß are weights, and ɑ+ ß=1. The bigger
the utility is, the better the ordering degree of the
UML metamodel is.
3 PRELIMINARY RESULTS
We obtain basic data from 11 versions of UML and
analyze the data by using statistics, complex
network, and entropy technologies.
3.1 Statistical Analysis of Basic
Components
3.1.1 Scale
The UML metamodel contains basic components:
class, property, operation, OCL expression,
association, inheritance, and composition. The
previous four basic components are collectively
called feature, and latter three are collectively called
relation. One usually concerns the number of them
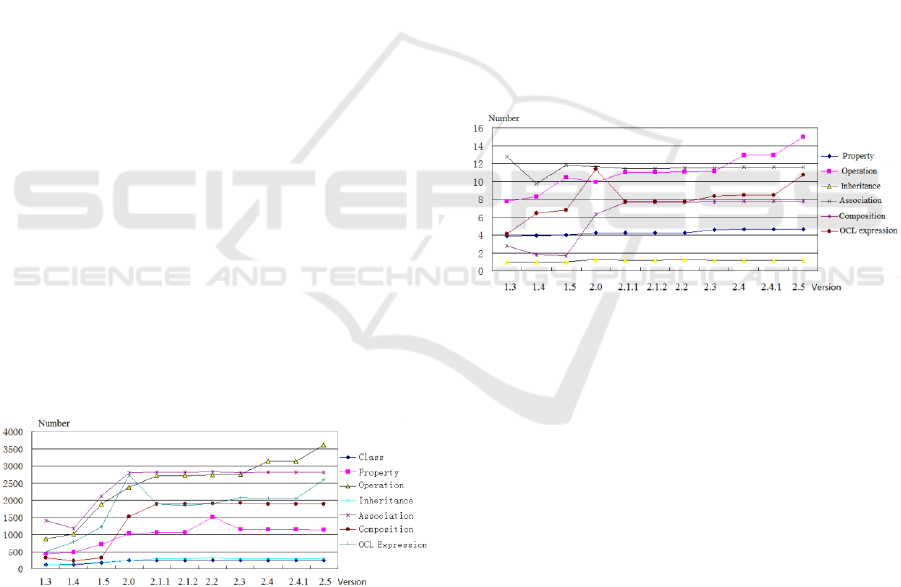
and the trend of their evolutions, see Figure 1.
Figure 1: Evolution of basic elements of 11 versions of the
UML metamodel.
The scales of almost all basic components of
early versions of the UML metamodel are
increasing, and the scales of class, associations,
inheritances, property, and composition all trend
toward leveling out after UML 2.1.1 except for scale
of property in UML 2.2.
OCL expression and operation help to formalize
the semantics of UML, their scales also are
increasing except that the scale of OCL expressions
jumps in UML 2.0 .
3.1.2 Distribution of Basic Components
In the UML metamodel, for a given feature or
relation (e.g. property or composition), the number
of the metaclasses that have the feature or relation
may be 0, 1, 2, …, and these numbers seems like it
should follow a skewed distribution, because the
probability distributions of structural components of
OO software tends to follow skewed distributions
with long tails (Valverde and Sol´e, 2007), since the
basic components of the UML metamodel is similar
to ones of OO software. In fact, the obtained
distributions of each kind of components are
irregular. This indicates that UML designers do not
use the smaller numbers of properties and relations
to define the metaclasses.
Figure 2 shows the evolution trend of the means
of the basic components of 11 versions of UML.
Figure 2: Evolution trend of means of the basic
components.
The scales of the basic components all trend
toward leveling out after UML 2.0 except for scales
of operations and OCL expressions in UML 2.5.
Indeed, UML 2.5 designers increase the operations
and OCL expressions in order to enhance UML
static semantics.
Figure 2 shows that the average scale of the
properties and inheritances in all versions remain
stable and the values are small. The reason for this
should be that UML designers usually follow that a
metaclass is defined with a few properties and
inheritances for the sake of reusability and
understanding.
3.1.3 Information Entropy
According to the algorithm for calculating entropy
(See Section 2.3.2), we obtain the curves for entropy
evolutions of the basic components from 11 versions
of the UML metamodel in Figure 3.
Analysis of the Evolution of the UML Metamodel
359
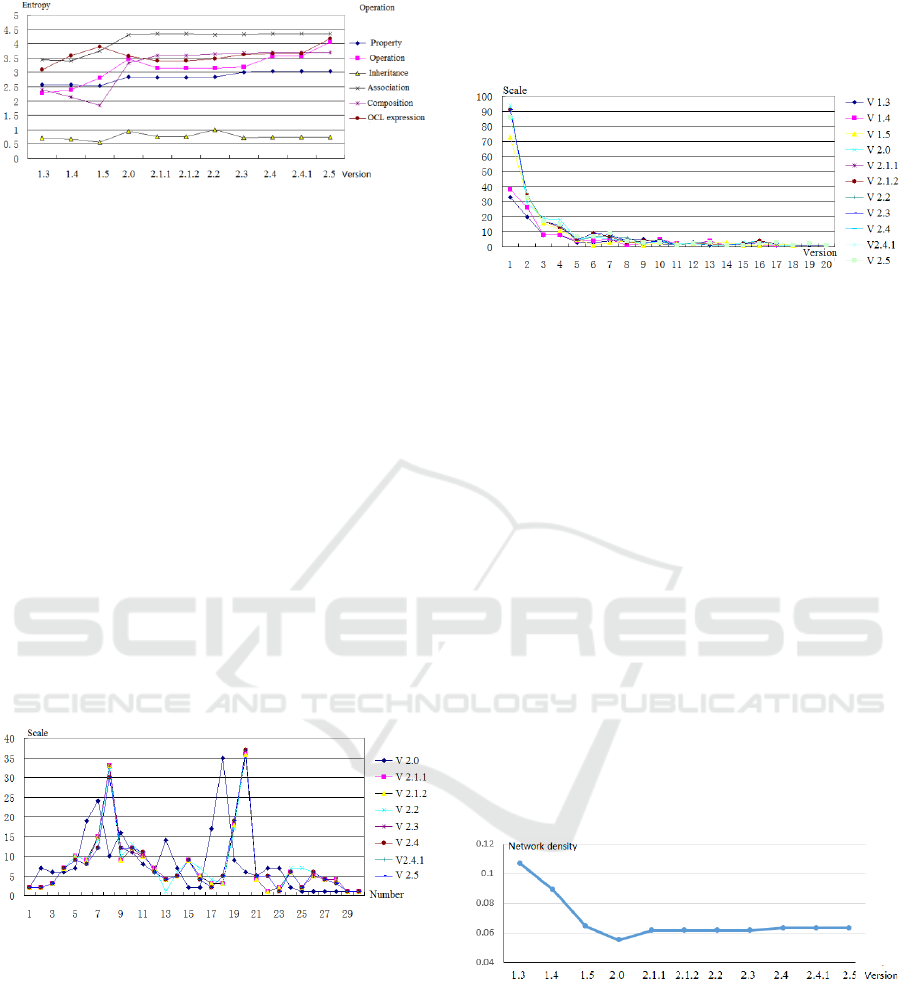
Figure 3: Entropy evolutions of the basic components.
In Figure 3, the entropy of the basic components
since UML 2.0 all tends to changes little except for
the entropy of operations and OCL expressions in
UML 2.5. In practice, UML 2.5 increases the
operations and OCL expressions. The observed
result is compatible with that in Figure 2.
3.2 Structural Analysis of Metamodels
3.2.1 Degree Distribution
Here, we discuss the in-degrees and out-degrees of
the metaclasses. Obviously, the larger the degree of
a metaclass is, the higher the influence of the
metaclassis. Therefore, we focus on the degree
distribution of the graph.
Because early 3 version of UML metamodel is
small scales and undergo a great deal of change,
Figure 4 shows the distribution of in-degrees of the
metaclasses of the UML metamodel from version
2.0 to version 2.5.
Figure 4: The distribution curves of the in-degrees of
metaclasses from later 8 versions.
The distribution curve of the in-degrees of
metaclasses in UML 2.0 is obviously different with
the others. The reason for this is that UML 2.0 has
structural problems, and OMG (Object Management
Group) declared the issue.
The distribution curves of the in-degrees of the
metaclasses of the other UML versions are bimodal,
and are almost the same. This means the distribution
probability of the in-degrees concentrated on two
areas.
Figure 5 show the distribution of out-degrees of
the metaclasses from 11 versions of the UML
metamodel.
Figure 5: The distribution curves of the out-degrees of
metaclasses.
In Figure 5, the degrees of the previous three
versions are obviously smaller than degrees of the
later ones.
Many of the metaclasses in each version of the
UML metamodel devote themselves to define a very
few other metaclasses, and the curves follow long
tail distribution.
3.2.2 Network Density
Network density characterizes the complexity of a
network structure. The greater network density is,
the more difficult understanding and maintaining it
is.
Set a version of the UML metamodel (i.e. a
directed graph) have N nodes and M edges, its
network density ρ=M/(N*(N-1)), i.e. the ratio of the
number of its actual edges to the largest possible
edges. Figure 7 shows the evolution trend of
network densities of 11 versions of the UML
metamodel.
Figure 6: Evolution trend of network densities of 11
versions of the UML metamodel.
In the current trend, since UML 2.0, network
densities stabilize, M≈0.0054N*(N-1), i.e. M(t)~
N
ɑ
(t), 1<ɑ<2, where t is time. This means that the
evolution of the networks follows densification
power law.
The densification power law means that, on the
one hand, a directed graph will become more and
more densification, but on the other hand, the graph
MODELSWARD 2018 - 6th International Conference on Model-Driven Engineering and Software Development
360
still is actually sparse with comparing a unity
coupling network for the graph (Wang et al. 2013).
With increase of modeling requirements, N should
increase, and M should increase even more. This
will result in that the UML metamodels are larger
and more complex, and seriously impact that one
learns and maintains it, etc. Therefore, it is necessary
to build UML profiles as required, instead of
complicating the basic UML metamodel, i.e.
restraining the increase of N, just like what OMG
advocates.
3.2.3 Average Path Length of Network
UML metaclasses are defined step-by-step, and each
modeling element (i.e. a metaclass which in-degree
is 0), which are used by end-modelers, depends on
the metaclasses locating to one or several directed
paths. Obviously, the long dependency paths
increase the degree of difficulty to manage and
understand the whole UML metamodel. Therefore,
we use the average path length of network to assess
the efficiency for learning the UML metamodel.
For a directed graph for a version of the UML
metamodel, we take the sum of path lengths of a
given modeling element to all end metaclasses as the
path length for defining the modeling element.
Figure 7. shows the average path lengths of 11
versions of the UML metamodel.
Figure 7: The average path lengths of 11 versions of the
UML metamodel.
Figure 7 shows that the average path lengths of
early UML metamodels increase since the sizes of
the metamodes become bigger, and ones of the other
UML metamodels are bigger since the metamodels
all are big in size. It is worthwhile to note that the
average path lengths of the last several metamodels
almost changes a little since the metamodels hold
steady.
This means that learning a modeling element
needs learning about dozens of metaclasses.
According to the “Seven, Plus or Minus Two” rule
(George, 1956), which is instructive to understand a
concept with reasonable sizes to a certain extent,
current the UML metamodel is obviously not easy to
learn.
3.2.4 Utility of an UML Metamodel
According to the algorithm in Section 2.3.2, we
obtain the utility of 11 versions of the UML meta-
model by setting ɑ and ß all be 0.5, see Figure 9.
Figure 8: Curves for the utility of 11 versions of the UML
metamodel.
In Figure 8, the communication quality validity,
communication efficient validity, and utility of early
versions of UML metamodel are almost higher than
ones of later versions. The reason for this is that the
early versions far away from user requirements,
even after they are to come into the service, they still
have defects on correctness, precision, conciseness,
consistency, and understandability.
Since UML 2.0, the communication quality
validity, communication efficient validity, and utility
converge to a relatively small range of values (i.e.
have cohesiveness to large extent), respectively.
This indicates that these versions all are mature and
stable to a large extent, since they have been applied
and improved for a long time. On the other hand, for
the later versions, their communication quality
validity and communication efficient validity all are
small, and so is their utility. Such small values
indicate that these versions of UML metamodel are
still less than satisfactory, and they need to be
further improved since the bigger the three values is,
the better the structure of the UML metamodel is.
For other values for ɑ and ß, the values of the
related utilities all are in the interval [0.08,0.22]
since UML 2.0, and the related trend lines are the
same as that in Figure 9 in essence. Therefore, the
above conclusion still is true.
4 DISCUSSION
Figures 1 to 3 show that the scale of the metamodel
Analysis of the Evolution of the UML Metamodel
361

of UML 2.0 swells first, the later versions have a
little change. For basic components except for the
operations and OCL expressions in UML 2.5, their
scales and entropies from UML 2.0 to UML 2.4.1
change slightly, see Figures 2 and 3. As mentioned,
the explanation for the increases of the operations
and OCL expressions in UML 2.5 is that formal
OCL expressions can enrich UML static semantics
and reduce ambiguity.
The current evolution trend of network densities
in Figure 6 is stable, and this is the effort of OMG
on using profiles as soon as possible instead of
extending UML, i.e. the OMG has benefitted from
the pursuit.
The current the communication quality validities,
communication efficient validities, and utilities of
the UML metamodel all change slightly, and the
result accords with the aforementioned results.
However, their values all are small, and such small
values indicate that these versions of the UML
metamodel still need to be further improved.
In figure 4, the distribution curves of the in-
degrees of the metaclasses of the other UML
versions are bimodal, that is, the distribution
probability of the in-degrees concentrated on two
areas. The reason needs to be further explored.
In figure 5, the distribution curves of the out-
degrees of the metaclasses of each version of the
UML metamodel follow long tail distribution, and
the distribution results from structure of the UML
metamodel. First the UML defines a great many of
the simple foundational language constructs
required, then the constructs are used to define the
user level constructs required for UML step by step.
OMG always follows the principle: the
incrementally defining the UML metamodel and
reusing the foundational language constructs for
defining the modeling elements of UML and other
modeling languages.
The average path lengths since UML 2.0 are
more than 25 (see Figure 7), and this means that
current versions of the UML metamodel are
obviously not easy to learn. How to increase the
comprehensibility of UML is a big challenge.
Enriching a metaclass with information (e.g. adding
the number of basic components) to a certain extent
may be a measure.
The results in Section 3 also obviously shows
that, with the evolution of the UML metamodel, the
number of their components swells and their
structure gets complicated during early evolution,
and the degree of their change becomes small during
later evolution.
The UML metamodel is used to define modeling
elements. Specifically, a modeling element, out-
degree of which is 0, is defined with a series of
subsequent metaclasses up to end-metaclasses, in-
degree of which all are 0, and there may be several
definition paths for the modeling element.
Therefore, it is improper to calculate average
shortest path lengths of the directed graph for the
UML metamodel. Since average shortest path length
is a property of the small world network (Valverde
and Sol´e, 2007), the directed graphs are different
with the small world network.
5 RELATED WORK
To some degree, the UML metamodel is similar to
ordinary OO class models, and some of the measure
technologies for the class models can be used to
measure the UML metamodel. Bansiya and Davis
(2002) collect data from class models of some
software frameworks with successive versions
according to their nine OO metrics, and then
calculate the change between different versions of a
framework. Mattsson and Bosch present a method
(1999), which is similar to Bansiya’s method, that
can measure the change between different versions
of a framework, and includes six hypotheses for
assessing stability of a framework. Valverde and
Sol´e deeply study hierarchical small-worlds in OO
software architecture based on complex network
theory (2007). However, indeed the UML
metamodel, as a new kind of the body of knowledge,
is different from ordinary class models, and these
studies involve few characteristics of the UML
metamodel.
For the studies on the quality of metamodels,
typical some focus on UML. The existing studies
focus on the design expectations of UML
(Weigert,2000; Douglass,1998; Siau and Cao, 2002).
However, these design expectations have not explicit
definitions, without concrete solutions. Ma et al.
(2013) define a quality model and present an
operable measuring mechanism to assess the quality
of metamodels, without a main focus on
evolutionary.
Some studies use entropies to assess software.
The studies help to our work, but are not direct
related to the UML metamodel. Hassan and Holt
(2003) use information entropy to deeply research
the chaos phenomenon of software, and find that the
information entropy of software becomes bigger and
bigger in the evolution process of the software; this
makes the increases of the difficulty in that
MODELSWARD 2018 - 6th International Conference on Model-Driven Engineering and Software Development
362

developers maintain the software. Using entropy
principle, Gaudan, et al (2008) present a measure
method of OO software reliability, and the method
misses important OO concepts such as associations.
Moreover, Yu, et al (2008) present an approach to
measuring the component cohesion based on
structure entropy and Zhang, et al (2011) analyze
system coupling by measuring the entropy of
modules. The later two works apply entropy to
measure systems, but they aim at component and
entity respectively, not metaclass.
6 CONCLUSIONS
For large and complex the UML metamodel, the
paper presents an approach to analyzing its evolution
to make certain its structure mechanism by using
statistics, complex network, and information entropy
technologies.
The study of the paper can provide the guides to
develop, measure, and refactory not only the UML
metamodel but also other metamodels like the UML
metamodel, and lays a foundation for further
exploring the structure mechanisms of large and
complex the metamodels like the UML metamodel
with good quality.
The paper analyses the basic components and
structure of the UML metamodel, and reveal only
some structural properties. This means that further
analysis is needed.
ACKNOWLEDGMENTS
The work supported by the National Natural Science
Foundation of China (No. 61672046).
REFERENCES
Barabási, A. (2009). Scale-Free networks: A decade and
beyond. Science, 325(5939):412−413.
Bansiya, J. & Davis, C, G. (2002). A hierarchical model
for object-oriented design quality assessment. IEEE
Transaction of Software Engineering, 28(1): 4–17.
Clark, D., Feldt, R., Poulding, S., & Yoo, S. (2015).
Information Transformation: An Underpinning Theory
for Software Engineering. In Proceedings of the 37th
International Conference on Software Engineering -
Volume 2, Pages 599-602.
Douglass, B. P. (1998). UML for systems engineering.
Computer Design’s: Electronic Systems Technology
and Design, 37(11), 44–49.
Gaudan, S., Motet, G., & Auriol, G. (2008). Metrics for
Object-Oriented Software Reliability Assessment -
Application to a Flight Manager. In Seventh European
Dependable Computing Conference,.13-24.
George, A. M. (1956). The Magical Number Seven, Plus
or Minus Two: Some Limits on Our Capacity for
Processing Information. The Psychological Review,
vol. 63, 81-97.
Hassan, A. E., & Holt, R. C. (2003). Studying the chaos of
code developmeng. In 10th Working Conference on
Reverse Engineering, 123-133.
He, K. Q., Ma, Y. T., Liu J., Li, B., & Peng, R. (2008).
Software Networks. Beijing: Science Press.
Ma, Z, Y. He, X. & Liu, C. (2013). Assessing the Quality
of Metamodels. Frontiers of Computer Science, 7(4),
558-570.
Mattsson, M. & Bosch, J. (1999). Characterizing stability
in evolving frameworks. In Proceedings of the 29th
International Conference on Technology of Object-
Oriented Languages and Systems, 118–130.
OMG. (2011). Uml Infrastructure specification. OMG
Document Number: formal/2011-08-05.
Siau, K. & Cao, Q. (2002). How complex is the unified
modeling language? Advanced topics in database
research, 294–306.
Silviu, G. (1977). Inforamtion theory with Applications.
McGraw Hill.
Valverde, S., Ferrer-Cancho, R., &Sol´e, R. V. (2002).
Scale-Free Networks from Optimal Design, Europhys.
Lett, vol. 60, 512-517.
Valverde, S., & Sol´e, R.V. (2007). Hierarchical small-
worlds in software architecture. Arxiv preprint,
arXiv:cond-mat/0307278.
Wang, X., Li, X., & Chen, G.(2013). Network Science: An
Introduction. Higher Education Press.
Weigert, T. (2000). UML 2.0 RFI response overview.
OMG Document ad/00-01-07.
Yu, Y., Li, T., Zhao, N., & Dai, F. (2008). An Approach to
Measuring the Component Cohesion Based on
Structure Entropy. In Second International Symposium
on Intelligent Information Technology Application,
697-700.
Zhang, J., & Vijay, P. (2012). Information Entropy:
Theory and Applications. China Water Power Press.
Zhang, Y., Zhou, H., Duan, Q., Liao, Y., Liu, J. & He, Z.
(2011). Quantitative Analysis of System Coupling. In
Eighth International Conference on Fuzzy Systems
and Knowledge Discovery, 2358-2362.
Analysis of the Evolution of the UML Metamodel
363
