
Spatial Model of above Ground Carbon Distribution of Mangrove in
Wildlife Reserve of Karang Gading dan Langkat Timur Laut using
Landsat 8 Satellite Imagery
Nurdin Sulistiyono
12*
, Selpandri G. Sitompul
1
, Desi Natalie Sinaga
1
, Pindi Patana
1
1
Faculty of Forestry, Universitas Sumatera Utara, Jl. Tridharma Ujung No.1 Kampus USU, Medan, Indonesia
2
Center of Excellence for Natural Resources-Based Technology, Mangrove and Bio-Resources Group
Universitas Sumatera Utara, Medan, Indonesia
Keywords: Mangrove Forests, Carbon Stock, NDVI, Landsat 8
Abstract: Wildlife reserve of KarangGading dan Langkat Timur Laut (KGLTL) in North Sumatra Province is
conservation forest area where mangrove forest is the dominant type of land cover. Mangrove forest is
important ecosystem because mangrove have rich-carbon stock, most carbon-rich forest among ecosystems
of tropical forest. This research was based on the lack of information on the carbon stock distribution in
Wildlife reserve of KGLTL. The objective of this study was to formulate the mangrove above ground
carbon stock estimation model using landsat 8 satellite imagery, as well as to develop a carbon stock
distribution map based on the selected model. The study found that the normalize different vegetation
index(NDVI) has a considerably high correlation with the above ground carbon is 0.8280. On the basis of
the values of aggregation deviation, mean deviation, bias, root mean square error, paired sample t test, and
R², the best model for estimating the mangrove above ground carbon is -172.00 + 552.89 NDVI with the R²
value of 68.48%. Potency of above ground carbon in Wildlife reserve of KGLTL is 10.71 to 122.10 ton per
ha.
1 INTRODUCTION
Mangrove ecosystem have many functions of
ecological and economical, so mangrove ecosystem
is important coastal ecosystem (Barbier et al., 2008).
Mangrove have rich-carbon stock about 1023 Mg
(Megagram) C ha
-1
, most carbon-rich forest among
ecosystems of tropical forest (Donato, et al., 2011).
The carbon sequestered in vegetated coastal
ecosystems, especially mangrove forests, salt
marshes and seagrass beds called blue carbon
(Mcleod et al., 2011).
The conversion of mangroves to other land uses
occurs mostly in the East Coast of North Sumatra,
such as at Wildlife reserve of KGLTL in Deli
Serdang and Langkat regency. Besides being rich in
marine products, Wildlife reserve KGLTL is also an
important habitat for various types of waterbirds and
has been identified as one of the migratory bird
habitats. The existence of mangrove forests in
Wildlife sanctuary of KGLTL continues to
experience pressure in the form of deforestation. The
results of the study mention that the rate of
mangrove deforestation in Deli Serdang Regency
was <1% while in Langkat Regency it was 2 - 3%
per year (Basyuni and Sulistiyono, 2018).
Deforestation of mangroves causes C emissions of
0.02 - 0.12 Pg (Petagram) per year, which is
estimated to be equivalent to 10% of emissions from
deforestation globally (Donato et al., 2011).
The utilization of remote sensing technologies
such as the use of Landsat 8satellite imagery can be
used to estimate the distribution of above ground
carbon in mangrove ecosystem. Among of mangrove
biomass estimation methods are based on vegetation
indices (Hamdan et al., 2013; Wicaksonoet al., 2011;
Winarso et al., 2015). This research was based on
the lack of information on the carbon stock
distribution in Wildlife reserve of KGLTL. The
objective of this study was to formulate the
mangrove above ground carbon estimation model
using landsat 8 satellite imagery, as well as to
develop a carbon stock distribution map based on
the selected model.
Sulistiyono, N., Sitompul, S., Sinaga, D. and Patana, P.
Spatial Model of above Ground Carbon Distribution of Mangrove in Wildlife Reserve of Karang Gading dan Langkat Timur Laut using Landsat 8 Satellite Imagery.
DOI: 10.5220/0010103301430146
In Proceedings of the International Conference of Science, Technology, Engineering, Environmental and Ramification Researches (ICOSTEERR 2018) - Research in Industry 4.0, pages
143-146
ISBN: 978-989-758-449-7
Copyright
c
2020 by SCITEPRESS – Science and Technology Publications, Lda. All rights reserved
143
2 MATERIALS AND METHOD
2.1 Study Area
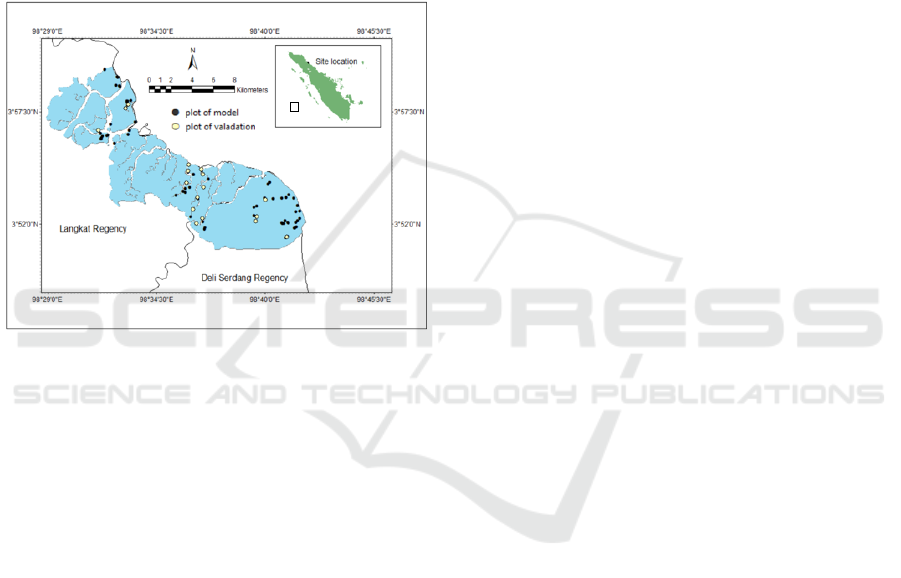
This research was conducted in Wildlife reserve of
KGLTLwith the total area of 13,542.37 ha. The
geographical location of Wildlife reserve of KGLTL
lies between 3
o
51’30” – 3
o
59’45” North Latitude
and 98
o
30’ – 98
o
42’ East Longitude. Wildlife
reserve of KGLTL was located in Deli Serdang and
Langkatregency of North Sumatra Province (Figure
1).
Figure 1: Location of site research
2.2 Analysis of Land Cover and NDVI
The material of this study was landsat 8 satellite
imagerypath/row of 129/057 acquisition on 22
February 2018 which was downloaded from USGS.
Data of Deli Serdang and Langkat regency
administration were obtained from Central Agency
on Statistics in 2010. The method of onscreen
digitalizing is used to analyze of land cover
classification. Land cover validation was done by
confusion matrix to get the overall accuracy and
kappa precision.
Optical data approach is commonly used to
derive vegetation indices for mangrove biomass
estimation (Hamdan et al., 2013; Wicaksono et al.,
2011; Winarso et al., 2015).The formula for getting
NDVI values is:
NDVI = (band 5 - band 4)/(band 5 + band 4) (1)
Where :
Band 4: digital number (DN) of red band
Band 5: digital number (DN) of near infrared
2.3 Estimation of Carbon Stock
Distribution
Collecting data to determine amount of above
ground biomass obtained by taking direct
measurements in the field using a sample plot of 20
x 20 m. Placement of sample plots was done by
purposive sampling while still considering the
distribution and representation of the sample.
Measurements of above ground biomass are carried
out on vegetation with diameters more than 10 cm.
The value of the above ground carbon is 50% of the
above ground biomass. Measurements of above
ground biomass were measured using the equation
developed by Komiyama (Komiyama et al.,
2005)with the equation:
Wtop= 0.251ρD
2.46
(2)
Where :
Wtop = above ground biomass (ton/ha)
D = diameter of breast height (cm)
ρ = wood density (g/cm
3
)
Regression analysis using ordinary least square
(OLS) was used to determine the relationship
between above ground carbon stock (y) and NDVI
value (x). Testing of OLS regression requirements
such as data normality tests and heterokedasitas tests
is carried out on above ground carbon. Regression
models used in this study were:
1. Linear : y = a + bx (3)
2. logarithmic : y = a + b ln x (4)
3. Power : y = a x
b
(5)
4. Eksponensial : y = aexp
bx
(6)
Validation tests were carried out to determine the
deviation of the estimated above ground carbon from
regression model with above ground carbon from
field. The model validation test was built using
paired samples t -test, aggregate deviation (AD),
relative deviation (SR), root mean square error
(RMSE) and bias (e). The number of sample plots
used to build model of carbon distribution is 45 plots
while the number of plots for validation tests is 18
plots.
ICOSTEERR 2018 - International Conference of Science, Technology, Engineering, Environmental and Ramification Researches
144
3 RESULT AND DISCUSSION
3.1 Land Cover and NDVI
The composition of the land cover distribution in
Wildlife reserve of KGLTL based on landsat 8
satellite imagery (Figure 2a) wasthe area of land
cover water body 631.73 ha (4.66%), bare soil
317.56 ha (2.34%), mangrove forest 9,929.44 ha
(73.32%), settlement 13.25 ha (0.10%), oil palm
plantation 2,422.29 ha (17.89%) and fishpond
228.10 ha (1.68%). The validation test of land cover
analysis in Wildlife reserve of KGLTL showed
overall accuracy 92.40 % and kappa accuracy 89.7
%, respectively. This result showed the classification
of land cover in Wildlife reserve of KGLTL which
produced is good.
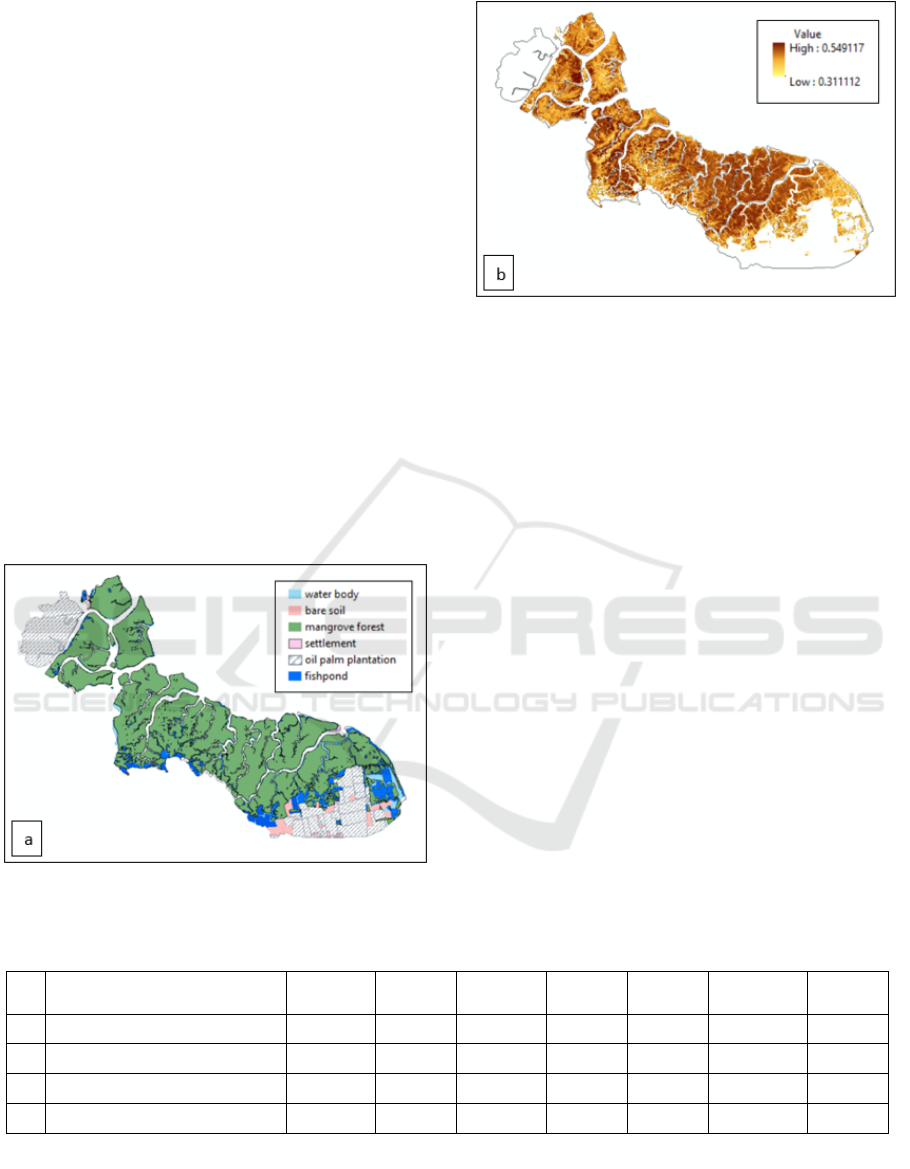
The results of the land cover classification in
Wildlife reserve of KGLTL are used as a basis for
determining NDVI distribution in mangrove forests.
Estimation value of NDVI distribution in mangrove
forest shows the values range between 0.31 to 0.54
(Figure 2b).
Figure 2: Land cover (a), NDVI distribution (b) in
Wildlife reserve of KGLTL in 2018
3.2 Carbon Stock Distribution
The statistical test and validation test of above
ground carbon distribution model can be seen in
Table 2. The use of NDVI in the four regression
models in table 2 can be used to estimate above
ground carbon distribution (sig of anova<0.05).
Based of R
2
value, linear regression model is the
best model for estimating the above ground carbon
distribution with the highest R
2
value of 68.48%.
The results of validation test using paired
samples t test on four regression models showed no
significant difference between the measurement data
in the field with estimated data from the model (sig
of paired sample t test > 0.05). The result of RMSE
test showed that the linear regression model has
smallest RMSE value while the logarithmic model
has the highest value. This shows the RMSE value
based on the linear model is the best model. The
results of testing the bias value showed the power
model is the best model because it has the smallest
bias value of 47.341.
The results of testing the aggregate deviation
values of all models have a qualifying value because
they are in the range of -1 to 1. While the results of
testing the relative deviation values of linear models
and logarithmic models is qualified, while the power
Table 2: Result of statistic model and validation
No Model
Sig of
anova R
2
Sig of
t paired RMSE Bias AD RD
1.
y = 552.89x - 172
0.000 68.480 0.993 10.505 55.927 0.042 8.953
2.
y = 2945.9x
4.6272
0.000 68.210 0.826 12.692 47.935 0.004 17.196
3.
y = 226.04ln(x) + 257.58
0.000 67.210 0.687 37.424 58.176 0.044 7.319
4.
y = 0.4788e
11.154x
0.000 67.490 0.755 12.364 47.341 0.005 17.531
Spatial Model of above Ground Carbon Distribution of Mangrove in Wildlife Reserve of Karang Gading dan Langkat Timur Laut using
Landsat 8 Satellite Imagery
145
and exponential models do not qualified because
they have values above 10%.
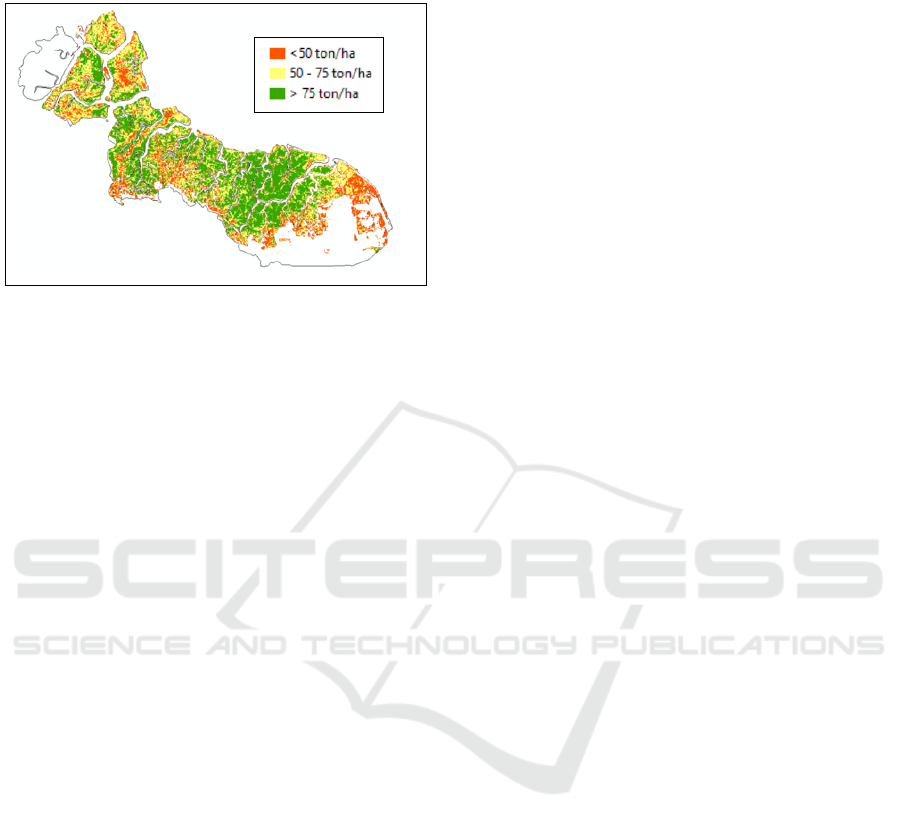
Figure 3: Above ground carbon distribution in Wildlife
reserve of KGLTL in 2018
Based on the results of statistical test of models
and validation tests, the linear model is the best
model that can be used to estimate the distribution of
above ground carbon in Wildlife reserve of KGLTL.
The results of above ground carbon distribution in
Wildlife reserve of KGLTL can be seen in Figure 3.
Based on the linear regression model, distribution of
above ground carbon in Wildlife reserve of KGLTL
can be classified into 3 classes: class < 50 (ton/ha)
covered 1,863.63 ha, class 50 -75 (ton/ha) covered
3,396.43 ha and > 75 (ton/ha) covered 3,581.82 ha.
This study resulted high correlation between
NDVI and field biomass and have good correlations
between vegetation indices and field biomass
according to another research(Wicaksono et al.,
2011 and Hamdan et al., 2013).The similarity of the
characteristicsof research location may be one of the
causes. Meanwhile, the empirical algorithm is
usually site specific that might not be applicable at
different part, even in the same country (Winarso et
al., 2015).
4 CONCLUSIONS
The utilization of NDVI on Landsat 8 satellite
imagery can be used to estimate the above ground
carbon distribution in Wildlife reserve of KGLTL.
The best regression model for estimating above
ground carbon distribution in Wildlife reserve of
KGLTL is linear regression model with R² value of
68.48%. Wildlife reserve of KGLTL has above
ground carbon stock level between 10.71 to 122.10
ton/ha.
ACKNOWLEDGEMENTS
This study was partly supported by an TALENTA
Grant 2018 (No. 414/UN5.2.3.1/PPM/KP-
TALENTA USU/2018) from the Universitas
Sumatera Utara, Ministry of Research, Technology
and Higher Education, Republic of Indonesia.
REFERENCES
Barbier, E.B., Koch, E.W., Silliman, B.R., Hacker, S.D.,
Wolanski, E., Primavera, J., Reed, D.J., 2008. Coastal
Ecosystem Based Management with Nonlinear
Ecological Functions and Values. Science 319 (5861):
321-323.DOI: 10.1126/science.1150349.
Basyuni, M., Sulistiyono, N., 2018. Deforestation and
reforestation analysis from land-use changes in North
Sumatran Mangroves, 1990-2015.IOP Conf. Series:
Materials Science and Engineering 309 (2018)
012018. doi:10.1088/1757-899X/309/1/012018.
Donato, D.C., Kauffman, J.B., Murdiyarso, D., Kurnianto,
S., Stidham, M.,Kanninen., M., 2011.Mangroves
among the most karbon-rich forests in the tropics,
Nature Geoscience, 4(5), 293-297.
Hamdan O., Khairunnisa M.R., Ammar A.A., Hasmadi
I.M., Aziz H.K., 2013. Mangrove Carbon Stock
Assessment by Optical Satellite Imagery.Journal of
Tropical Forest Science 25(4): 554–565.
Komiyama, A., Poungparn,S., Kato, S., 2005. Common
allometric equations for estimating the tree weight of
mangroves. Journal of Tropical Ecology, 21(04), 471-
477.
Mcleod, E., Chmura, G.L., Bouillon, S., Salm, R., Björk,
M., Duarte, C.M., Silliman, B.R., 2011. A Blueprint
for Blue Carbon: 4 Toward an Improved
Understanding of the Role of Vegetated Coastal
Habitats in Sequestering CO2. Frontiers in Ecology
and the Environment 9(10): 552-560.
Wicaksono, P., Danoedoro, P., Hartono, H., Nehren, U.,
Ribbe, L., 2011. Preliminary Work of Mangrove
Ecosystem Carbon Stock Mapping in Small Island
Using Remote Sensing: Above and Below Ground
Carbon Stock Mapping on Medium Resolution
Satellite Image. Remote Sensing for Agriculture,
Ecosystems, and Hydrology XIII, 8174, 81741B–
81741B–10. https://doi.org/ 10.1117/12.897926.
Winarso, G., Vetrita, Y., Purwanto, A.D., Anggraini, N.,
Darmawan, S., Yuwono, D.M., 2015. Mangrove
Above Ground Biomass Estimation Using
Combination of Landsat 8 And
AlosPalsarData.International Journal of Remote
Sensing and Earth Sciences Vol. 12 No. 2 December
2015: 85 – 96.
ICOSTEERR 2018 - International Conference of Science, Technology, Engineering, Environmental and Ramification Researches
146
