
Effectivity Test of Black Cumin Extract
(Nigella Sativa) on Growth of Staphylococcus Aureus Isolates
Odontogenic Infection Pus
Rahmi Syaflida
1
, Ahyar Riza
1
, Abdullah Oes
1
, Ricky Rianto
1
1
Department of Oral and Maxillofacial Surgery, Faculty of Dentistry Universitas Sumatera Utara, Universitas 9 street
Padang Bulan, Medan, Indonesia
Keywords: Odontogenic infection, Staphylococcus aureus, Black cumin, Inhibition zone
Abstract : The majority of infection that manifest in the oral cavity are odontogenic. Based on research, Staphylococcus
aureus is the most dominant bacteria. Antibiotic administration is one of the treatment planning, but
inappropriate antibiotics administration results in resistance. In recent years, many research showed resistance
of antibiotics. Based on this, a new alternative from another material is needed to overcome this problem like
black cumin. This study aims to determine the effect of black cumin extract (Nigella sativa) concentration on
the growth of Staphylococcus aureus.This is a laboratory experimental study with a “post-test with control
group” design. Black cumin (Nigella sativa) extract was prepared at concentrations of 50%,75%,and 100%
and controlled with aquadest. The first step of the trial was bacteria rejuvenation. Furthermore the
antimicrobial test were tested with disc diffusion technique, and the data were analyzed with Kruskkal
Wallis.The result of inhibition zone measurement at 50% concentration (6.08 ± 0.48 cm), 75% concentration
(6.65±1.07 cm), at 100% concentration (9.47 ± 0.88 cm), and there was no inhibition zone of control group.
The average percentage at 50% concentration (56.95 ± 4.24%), 75% concentration (65.55 ± 9,11%), and
100% (92.09 ± 5,87%).
1 INTRODUCTION
The majority of infection that manifest in the oral
cavity are odontogenic. The infections caused by both
aerobic and anaerobic bacteria comprised about 60%
of all odontogenic infections.
(Fragiskos, 2007) Based
on research, Staphylococcus aureus is the most
dominant bacteria.
(Kohli, 2009) Bacterial virulence
can move bacteria freely in all directions. Antibiotic
administration can be used to overcome this, but
inappropriate antibiotic administration results in
resistance.
(Syed, 2011) A research of Benardo and
Ueno showed almost all Staphylococcus aureus
strains were resistant to amoxicilin and amphicilin in
Brazil.
(Foday, 2010) Based on this, a new alternative
from another material is needed to overcome this
problem. Black cumin (Nigella sativa) is cultivated in
many countries in the world like Middle Eastern,
Mediteranian region, India, and Saudi Arabia. Black
cumin grows at 20-90 cm tall. The flowers are white,
yellow, pink, with 5-10 petals. Black cumin has 4
important active ingredients, they are thymoquinone,
tanin, thymol, and dithymoquinone. This ingredients
have antibacterial effect.
An experiment of Wasim
Raja showed about antibacterial effect of black cumin
extract to gram positive bacteria like Enterobacter
showed the average measurement of inhibition zone
at 100% concentration is 11.15 cm.
(Raja, 2016)
2 MATERIAL AND METHOD
This study was an experimental study with post-test
with control group design. The research was conduct
in the Laboratory of Microbiology Faculty of
Mathematics and Natural Science Sumatera Utara
University, Medan, Indonesia. The sampling
calculation in this study use Federer formula, in
which sample in this study was 28 petri dishes.
Sample was take from Laboratory of Microbiology
Faculty of Health Sumatera Utara University.
Maceration technique is used to produce black cumin
(Nigella sativa) extract. Production black cumin
extract is carried out using 96% ethanol solution.
Black cumin extract was prepared at concentrations
of 50%,75%,and 100%. Odontogenic infection pus
904
Syaflida, R., Riza, A., Oes, A. and Rianto, R.
Effectivity Test of Black Cumin Extract (Nigella Sativa) on Growth of Staphylococcus Aureus Isolates Odontogenic Infection Pus.
DOI: 10.5220/0010099909040907
In Proceedings of the International Conference of Science, Technology, Engineering, Environmental and Ramification Researches (ICOSTEERR 2018) - Research in Industry 4.0, pages
904-907
ISBN: 978-989-758-449-7
Copyright
c
2020 by SCITEPRESS – Science and Technology Publications, Lda. All rights reserved
has been previously isolated from Laboratory of
Microbiology Faculty of Health Sumatera Utara
University and from the result of isolation
Staphylococcus aureus is dominant bacteria.
Antimicrobial test started from bacteria rejuvenation.
The bacteria rejuvenation tarted by streaking 1-3 ose
bacteria in Nutrient Agar then incubate for 24 hours
in incubator.
Antimicrobial test was performed on the media
under the following procedures. First step is taken 3
ose from rejuvenated bacteria then put the bacteria in
test tube that contain 5-10 milimeter aquadest, and
vortex. After the vortex process, the absorbance of
suspension was measured with spectrophotometry at
wavelenght of 600 nm until the absorbance value of
0,5 is obtained. Dip the sterile cotton bud into
bacterial suspension, then streak on the surface of
Mueller Hinton Agar. Take the disc paper that has
been soaked in each concetration for 1 hour then
placed on the part that has been marked, then incubate
the petri dish in incubator for 24 hours on 37
0
C.
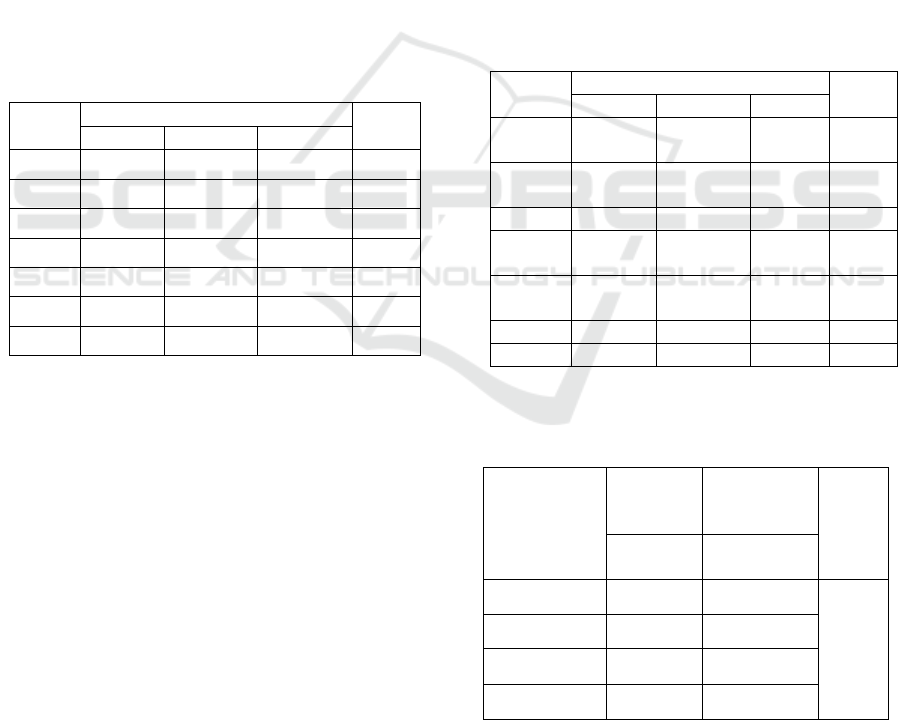
Table 1: The result of inhibition zone percentage
Group Concentration Contr
ol
50% 75% 100%
I 57.42 % 46.21% 98.03% 0%
II 57.42% 72.82% 98.97% 0%
III 56.02% 66.29% 88.23% 0%
IV 63.02% 66.76% 94.30% 0%
V 60.22% 66.76% 94.77% 0%
VI 55.08% 66.29% 86.36% 0%
VII 49.48% 73.76% 84.03% 0%
The inhibition zone known based on the
measurement of the clear zone diameter around disc
paper. Measurement performed with caliper.
Measurements were carried out 3 times by measuring
the largest diameter of the inhibitory zone at each
concentration. Data obtained from this experiment
was put into a table. Data processing was done with
computer and analyzed with SPSS using Kruskall-
Wallis test.
3 RESULT
The result of inhibiton zone measurement at 50%
concentration are 6.15 cm, 6.15 cm, 6 cm, 6.75 cm,
6.45 cm, 5.90 cm, and 5.30 cm. Then at 75%
concentration are 4.95 cm, 7.80 cm, 7.10 cm, 7.15 cm,
7.15 cm, 7.10 cm, and 7.90 cm. The biggest
concentration in this study is 100%. The result of the
inhibition zone measurement are 10.50 cm, 10.60 cm,
9.45 cm, 10.1 cm, 10.15 cm, 9.25 cm, and 9 cm, and
there was no inhibition zone of control group. (Table
1)
The result of inhibition zone percentage at 50%
concentration are 57.42%, 57.42%, 56.02%, 63.02%,
60.22%, 55.08%, and 49.48%. Then at 75%
concentration are 46.21%, 72.82%, 66.29%, 66.76%,
66.76%, 66.29%, and 73.76%. The inhibition zone
percentage at 100% concentration are 98.03%,
98.97%, 88.23%, 94.30%, 94.77%, 86.36%, and
84.03%. (Table 2)
The result of average measurement showed at
table 3, the smallest inhibition zone at 50%
concentration (6.08 ± 0.48 cm) and the largest
inhibition zone was found at 100% concentration
(9.47 ± 0.88 cm) and there was no inhibition zone of
control group. (Figure 1,2,3,4) The average
percentage at 50% concentration (56.95 ± 4.24%),
75% concentration (65.55 ± 9,11%), and 100% (92.09
± 5,87%). (Table 3)
Table 2: The result of the inhibition zone measurement
Table 3: The average measurement and percentage of
inhibition zone.
Concentration Inhibition
Zone
Percentage
of Inhibition
Zone
p-
value
Mean±SD
(cm)
Mean±SD
(%)
50% 6.08±0.48 56.95±4.24 0.000
75% 6.65±1.07 65.55±9.11
100% 9.47±0.88 92.09±5.87
Control 0 0
Group Concentration Contr
ol
50% 75% 100%
I 6.15 cm 4.95 cm 10.05
cm
0 cm
II 6.15 cm 7.80 cm 10.60
cm
0 cm
III 6.00 cm 7.10 cm 9.45 cm 0 cm
IV 6.75 cm 7.15 cm 10.10
cm
0 cm
V 6.45 cm 7.15 cm 10.15
cm
0 cm
VI 5.90 cm 7.10 cm 9.25 cm 0 cm
VII 5.30 cm 7.90 cm 9.00 cm 0 cm
Effectivity Test of Black Cumin Extract (Nigella Sativa) on Growth of Staphylococcus Aureus Isolates Odontogenic Infection Pus
905
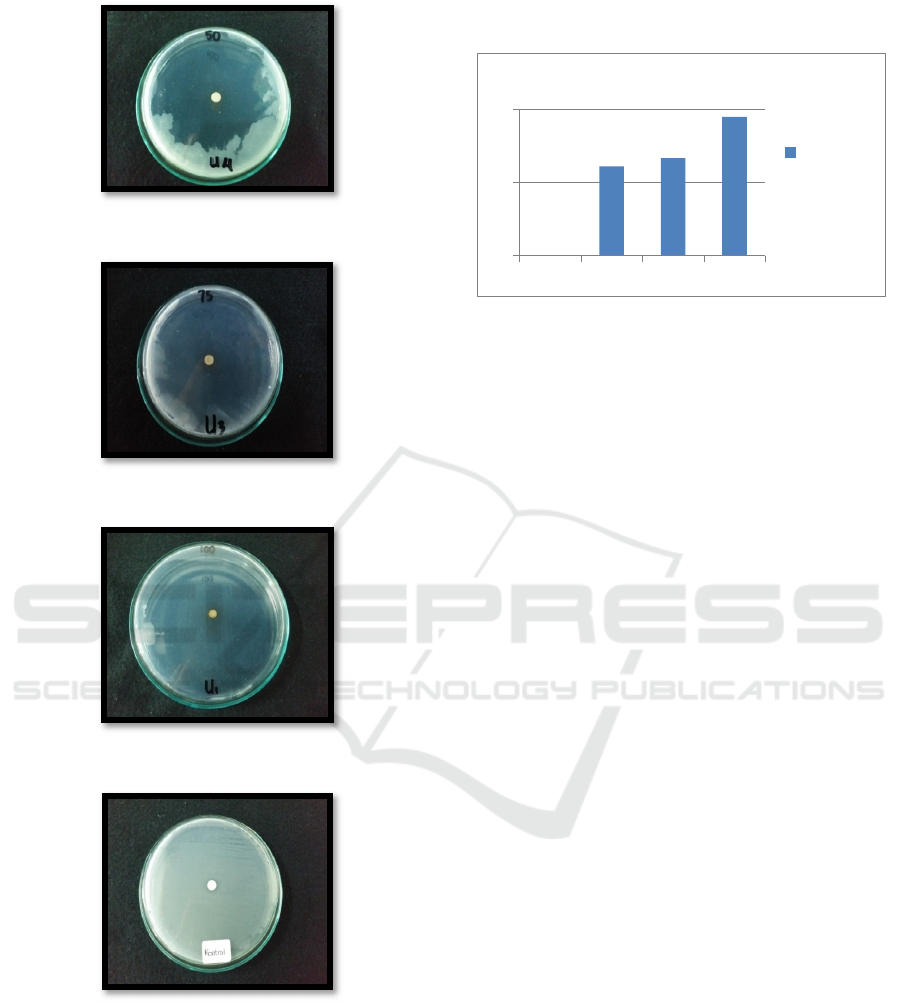
Figure 1: Petri dish at 50% concentration.
Figure 2: Petri dish at 75% concentration.
Figure 3: Petri dish at 100% concentration.
Figure 4: Petri dish for control.
The result of kruskall wallis statistical test was
significant (p=0.000; p< 0.05). This means black
cumin extract can inhibit Staphylocococcus aureus
growth. Beside that, there is an increase inhibition
zone value as the concentration value increase.
Graphic 1: The average measurement and percentage of
inhibition zone.
4 DISCUSSION
The inhibition zone is a clear area that appears on
media in petri dish after the disc has placed. This clear
area indicates an inhibition of the growth of
microorganism by antimicrobial agents on media.
(Pratiwi, 2008)
The result of this study is accordance
with the Morsi’s research who reported Black Cumin
(Nigella satia) extract can inhibit gram positive
bacteria growth such as streptococcus and
staphylococcus.
(Asniyah, 2009)
Beside that, Wasim
Raja who reported black cumin extract can inhibit
gram positive bacteria like Bacilus subtilis with the
result of inhibition zone measurement is 9 cm.
(Raja,
2016)
There is an increase inhibition zone value as the
concentration value increase. This result is as same as
the results of the Arici study, that showed there is an
unidirectional relationship between both.
(Arici, 2007)
An experiment of Asniyah about antibacterial effect
of black cumin extract to gram negative bacteria like
Escherichia coli showed the average measurement of
inhibition zone at 50% concentration is 0.9 cm, then
at 100% concentration is 1.3 cm.
(Asniyah, 2009)
The
other experiment of Wasim Raja about antibacterial
effect of black cumin extract to gram positive bacteria
like Enterobacter showed the average measurement
of inhibition zone at 50% concentration is 5.6 cm,
then at 100% concentration is 11.15 cm.
(Raja, 2016)
There is a difference in the average inhibition zone
value between gram positive and negative bacteria.
The average value in gram positive bacteria is greater
than gram negarive bacteria. Etiology of this situation
is the cell wall structure of gram positive bacteria is
more simple than gram negative. The cell wall
structure of gram positive consists of peptidoglycan
and teichoic acid. In conclusion, gram positive
bacteria is easier inhibited by antibacterial substances
than gram negative bacteria.
0
5
10
control 50% 75% 100%
Inhibitionzonemeasurement
Inhibitio
nzone
measure
ment
ICOSTEERR 2018 - International Conference of Science, Technology, Engineering, Environmental and Ramification Researches
906

5 CONCLUSION
Based on the results of research and data analysis, it
can be concluded the lowest inhibition zone value at
50% concentration and the highest value at 100%
concentration. The p-value from Kruskall wallis
statistical test is p<0.05, it means black cumin is
effective in inhibiting the growth of Staphylococcus
aureus bacteria. The content of thymoquinone, tanin,
thymol, and dithymoquinone in black cumin having a
function as an antibacterial. This inhibition zone is
formed caused by the active ingredient of black
cumin. They are thymoquinone, tanin, thymol, and
dithymoquinone. Thymoquinone and
dithymoquinone can form irreversible complexes
with bacterial proteins and resulting in protein
inactivation. While tanin and thymol worked by
inactivating enzymes and cell wall proteins that
disrupt bacterial growth.
(Aprilia, 2016)
REFERENCES
Aprilia E, Setiawati EM, Kurnia S. 2016 The effectiveness
of nigella sativa extract to reduce subgingival plaque
bacteria. Indonesian Dent J 23(3) 60-2.Fragiskos D
2007 Oral surgery ( Leipzig: Springer) p. 205-20
Arici M, Sagdic O, Gecgel U 2007 Antibacterial of turkish
black cumin (Nigella sativa) oils. J Of Plant Develop
Sci 3(4) 259-62.Kohli M, Mathur A, Siddiqui SR 2009
In vitro evaluation of microbiological flora of orofacial
infection. J Maxillofac Oral Surg 8(4) 329-33.
Asniyah 2009 Efek antimikroba minyak jintan hitam
terhadap pertumbuhan Escherchia coli in vitro. J of
Biomedic 1(1) 25-9.Syed R, Prasad G, Deeba F, Rani
D, Jamil K, Alshatwi AA 2011 Antibiotic drug
resistance of hospital acquired Staphylococcus aureus
in Andra Pradesh: A Monitoring Study. Afr J Microbiol
Res 5(6) 671-4.
Kohli M, Mathur A, Siddiqui SR 2009 In vitro evaluation
of microbiological flora of orofacial infection. J
Maxillofac Oral Surg 8(4) 329-33.
Pratiwi ST 2008 Mikrobiologi farmasi (Jakarta: Erlangga)
p.188-91
Raja W, Dewangan T 2016 Determination of antibacterial
activity of nigella sativa seed extract against some
human pathogenic bacteria. American J of Bio and
Pharm Res 3(2) 65-69.
Syed R, Prasad G, Deeba F, Rani D, Jamil K, Alshatwi AA
2011 Antibiotic drug resistance of hospital acquired
Staphylococcus aureus in Andra Pradesh: A
Monitoring Study. Afr J Microbiol Res 5(6) 671-4.
Effectivity Test of Black Cumin Extract (Nigella Sativa) on Growth of Staphylococcus Aureus Isolates Odontogenic Infection Pus
907
