
A New Procedure of Two Stage Data Envelopment Analysis Model
under Strict Positivity Restriction
M. D. Nasution
1
, M. R. Syahputra
*1
, H. Mawengkang
1
, A. A. Kamil
2
1
Department of Mathematics, Faculty of Mathematics and Natural Sciences, Universitas Sumatera Utara, Padang Bulan
20155, Medan, Indonesia
2
Telkom University, West Java, Bandung, Indonesia
Keywords: Positivity Restriction, Two Stage DEA.
Abstract: Data Envelopment Analysis (DEA) is a mathematical non-parametric approach for measuring relative
efficiency of homogenous decision making units (DMUs) performing. This approach will evaluates the
efficiency score of entities. The efficiency is defined as the maximum of the ratio of the sum of its weight
output to the sum of its weight inputs. The objective value is subject to the conditions that are corresponding
to ratios for each DMU be less than or equal to one. Strict positivity of the weights in the theoretical and the
computational result is an important condition to identify whether the DMU
s
is efficient or not. One method
that can be used to achieve this condition was considering a positive lower bound on its weights, known as a
non-Archimedean infinitesimal, 𝜀. In fact, it is very hard to find a set of positive weights among all the
alternative solutions of multiplier model. This paper show that a new procedure two-stage approach can solve
the decision-making problems that are modelled on the DEA-CCR model under strict positivity restriction.
1 INTRODUCTION
In determining the performance of an organization and
increasing productivity, the efficiency level must be
measured. In general, efficiency is expressed in the
form of a comparison between input (input) and output
(output). But in a company there may be different
input and output entities, in aspects of resources,
activities, environmental factors. So in general
measurement of efficiency is difficult to use. So to be
able to measure the level of efficiency with different
input and output entities can be done using Data
Envelopment Analysis (DEA) (Charnes et al., 1978).
Charnes et al (1979) proposed the model as a
fractional programming problem. After that, the
model was transformed as a simple linear
programming problem with a objective function and
some criteria. DEA's main objective is to determine
efficient conditions based on existing problem
scenarios. In this case the efficiency can be
interpreted as the maximum ratio of the weighted
output to the weighted input with the constraints
corresponding to each DMU.
Based on the basic concept of the CCR model
found by Charnes et al., (1978), known as the DEA
CCR, that the unit shows performance the best is with
one efficiency score. This shows that the score it is
part of the production boundary that cannot be
compared to the boundary area. Further techniques
that combine principles the basic DEA is known as
"Super Efficiency Analysis" introduced by Andersen
and Peterson (1993).
In his paper, Thompson et al (1993) discussed
several ways to eliminate zero weight in the DEA
problem. Various methods have been carried out,
including modifying the DEA model as carried out by
Charnes et al (1997). In his paper, Charnes et al
(1979) added a positivity requirement, using the
parameter 𝜀. This method is the right way to do it, but
this method has complex limitations and complexities
because we don't know the right value for 𝜀.
By this situation, Yao (2003) and Amin &
Toloo
(2004) conducted related research and found the
right number for 𝜀.
Cooper et al (2001) in his paper discuss about a
method that solved zero weight problem in DEA.
proposed two-stage method. This procedure is for
selecting non zero weights from the alternative
optimal solution of the multiplier model in a DEA.
Saen (2010) said that it is very hard to find a set of
positive weight among all the alternative solutions of
multiplier models.
Nasution, M., Syahputra, M., Mawengkang, H. and Kamil, A.
A New Procedure of Two Stage Data Envelopment Analysis Model under Strict Positivity Restriction.
DOI: 10.5220/0010095310311035
In Proceedings of the International Conference of Science, Technology, Engineering, Environmental and Ramification Researches (ICOSTEERR 2018) - Research in Industry 4.0, pages
1031-1035
ISBN: 978-989-758-449-7
Copyright
c
2020 by SCITEPRESS – Science and Technology Publications, Lda. All rights reserved
1031

2 BASIC DEA-CCR MODEL
In this study the author uses the DEA-CCR model as
the basis for the model that will later be developed.
The basic DEA-CCR model in (1) is formed for
evaluating the efficiency of DMU
s
(Charnes et al,
1978). Suppose there are n DMU
s,
𝐷𝑀𝑈
, 𝑗
1,2,…,𝑛 , that will be evaluate the efficiency values.
Each of DMU consumes the amounts 𝑥
𝑥
of 𝑚
inputs 𝑖1,2,…,𝑚 , and will produce the amounts
𝑦
𝑦
of 𝑠 outputs 𝑟1,2,…,𝑠 𝑥
0
,𝑥
0
,𝑦
0
,𝑦
0
. Then the DEA-CCR model is
defined as follows
max𝜃 𝑢
𝑦
𝑠.𝑡. 𝑣
𝑥
1 1
𝑢
𝑦
𝑣
𝑥
0 𝑗1,2,…,𝑛
𝑣
0 𝑖 1,2,…,𝑚
𝑢
0 𝑟 1,2,…,𝑠
Where 𝑥
𝑥
and 𝑦
𝑥
are inputs and output
respectively. Meanwhile the weights of 𝑖-th input and
𝑟-th output are indicated by 𝑣
and 𝑢
respectively.
Completion of the model (1) will get the optimal
value for multipliers. Therefore, the model (1) is often
referred to as the multipliers form of the CCR
problem.
3 AN IMPROVED DEA-CCR
MODEL
The issue of strict positivity is important in the DEA.
Although there are many alternative optimal
solutions, it is still difficult to determine the level of
efficiency of each DMU. Therefore, Charnes et al
(1979) modifies the model (1) as follows:
max𝜃 𝑢
𝑦
𝑠.𝑡. 𝑣
𝑥
1 2
𝑢
𝑦
𝑣
𝑥
0 𝑗1,2,…,𝑛
𝑣
𝜀 𝑖 1,2,…,𝑚
𝑢
𝜀 𝑟 1,2,…,𝑠
where 𝜀0 is an infinitecimal element that smaller
than any positive real number.
4 AN IMPROVED FORMULA OF
TWO STAGE DEA
The first step we must take to develop the DEA-CCR
model is to complete the model (1) in the first stage.
If the value 𝜃
∗
1, then DMU
o
is said to be CCR-
inefficient. If the model (1) has obtained its efficiency
value, then the next step is to solving the following
model (3) in the second stage.
max 𝛿
𝑠.𝑡. 𝑣
𝑥
1 3
𝑢
𝑦
𝑣
𝑥
0
𝑢
𝑦
𝑣
𝑥
0 𝑗 𝑜
𝑣
𝛿 0 ∀𝑖
𝑢
𝛿 0 ∀𝑟
𝑣
,𝑢
,𝛿 0 ∀𝑖,𝑟
After solving the model (3) in the second stage, the
next step is to check the optimal solution. If the value
of 𝛿
∗
0, then we get
𝑢
∗
,𝑣
∗
0
. If that so, the
DMU
o
is called to be efficient.
In model (1) and (3), we replace the constrain
∑
𝑣
𝑥
1 with
∑
𝑣
𝑥
𝐾, 𝐾 is an arbitrary
nonnegative number to improve the recent procedure
of two stage DEA. Therefore, we rewrite the models
(1) and (3) respectively as follows:
maxΘ
𝑢
𝑦
𝑠.𝑡. 𝑣
𝑥
𝐾 4
𝑢
𝑦
𝑣
𝑥
0 𝑗1,2,…,𝑛
𝑣
0 𝑖 1,2,…,𝑚
𝑢
0 𝑟 1,2,…,𝑠
maxΔ
𝑠.𝑡. 𝑣
𝑥
1 5
𝑈
𝑦
𝑉
𝑥
0
ICOSTEERR 2018 - International Conference of Science, Technology, Engineering, Environmental and Ramification Researches
1032
𝑈
𝑦
𝑉
𝑥
0 𝑗 𝑜
𝑣
Δ 0 ∀𝑖
𝑢
Δ 0 ∀𝑟
𝑉
,𝑈
,𝛿 0 ∀𝑖,𝑟
In this paper a simple example will be given to
seeing the proposed DEA model application. In
addition, there will also be case example from bank
performance. As a tool, we use LINDO for solving
and making analysis of the models.
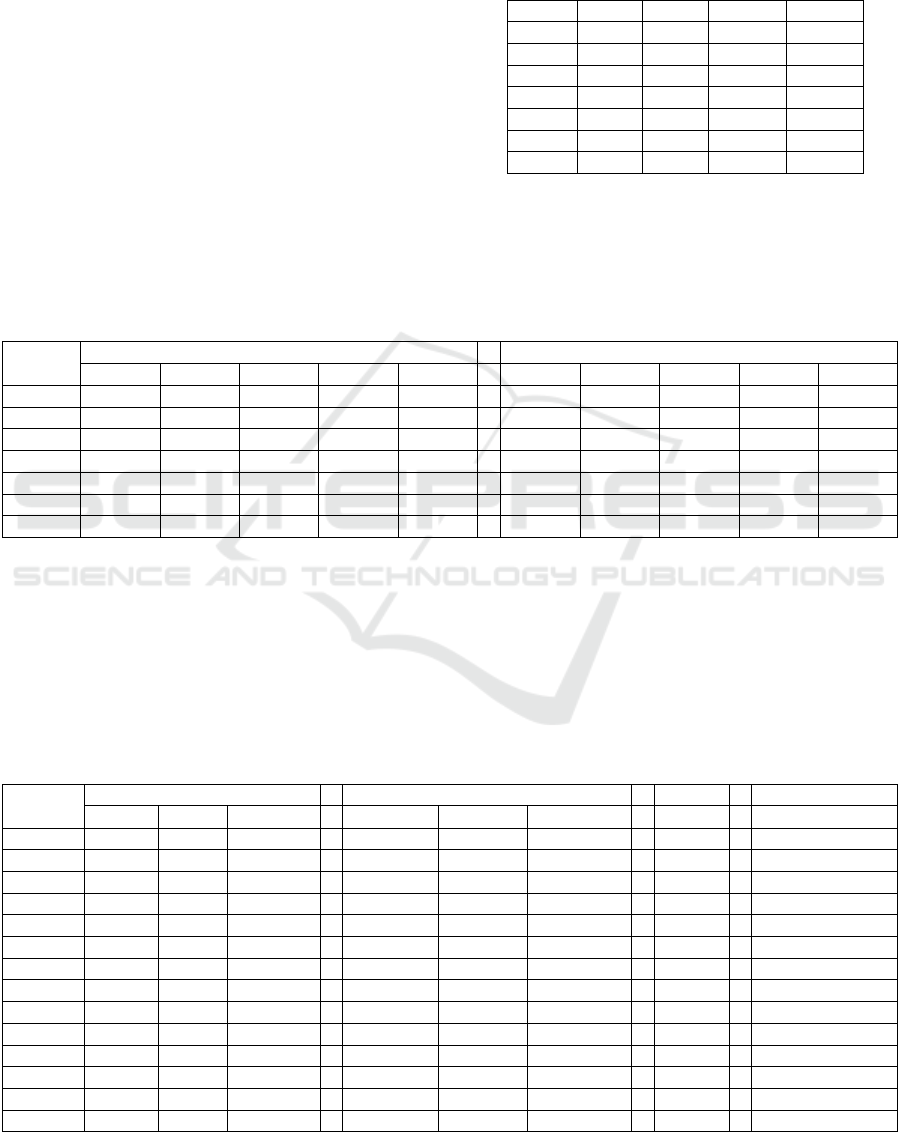
5 NUMERICAL EXAMPLE
As a simple numerical example, we evaluate 7 DMU
with two inputs and two outputs as shown in Table 1.
First, applying stage I to evaluate each DMUs. We
have four DMU which efficiency score is 1 as shown
in Table 2.
Table 1: Input and output of 7 bank
DMU In
p
ut
1
In
p
ut
2
Out
p
ut
1
Out
p
ut
2
DMU
1
19 3 5 4
DMU
2
6 4 2 4
DMU
3
7 2 2 2
DMU
4
3 3 5 5
DMU
5
1 5 3 3
DMU
6
9 2 2 6
DMU
7
3 4 2 3
We evaluate the data on Table 1 using LINDO. By
means of 𝛿
∗
of the DMU
4
and DMU
6
is greater than
zero, it means that both of them are efficient.
Table 2: The result of numerical example using LINDO
DMU
Stage I Stage II
𝜃
∗
𝑣
∗
𝑣
∗
𝑢
∗
𝑢
∗
𝛿
∗
𝑣
∗
𝑣
∗
𝑢
∗
𝑢
∗
DMU
1
1.0000 0.0000 0.5000 0.2500 0.0000 0.0000 0.0000 0.5000 0.2500 0.0000
DMU
2
0.4710 0.0588 0.1961 0.0000 0.1569
DMU
3
0.5000 0.0000 1.0000 0.3750 0.1250
DMU
4
1.0000 0.2500 0.0000 0.2500 0.0000 0.1250 0.1875 0.1250 0.1250 0.1250
DMU
5
1.0000 0.5000 0.0000 0.0000 0.5000 0.0000 0.5000 0.0000 0.5000 0.0000
DMU
6
1.0000 0.0000 1.0000 0.0000 0.2000 0.0625 0.2500 0.3750 0.6250 0.1875
DMU
7
0.5000 0.2500 0.0000 0.0000 0.2500
Table 2 shows the results of stages I and II obtained
using LINDO. From Table 2 it can be seen that the
efficient DMUs are DMU
4
and DMU
6
. This is due to
the optimal value of DMU
4
and DMU
6
which are
𝛿
∗
0.1250 ; 𝛿
∗
0.0625.
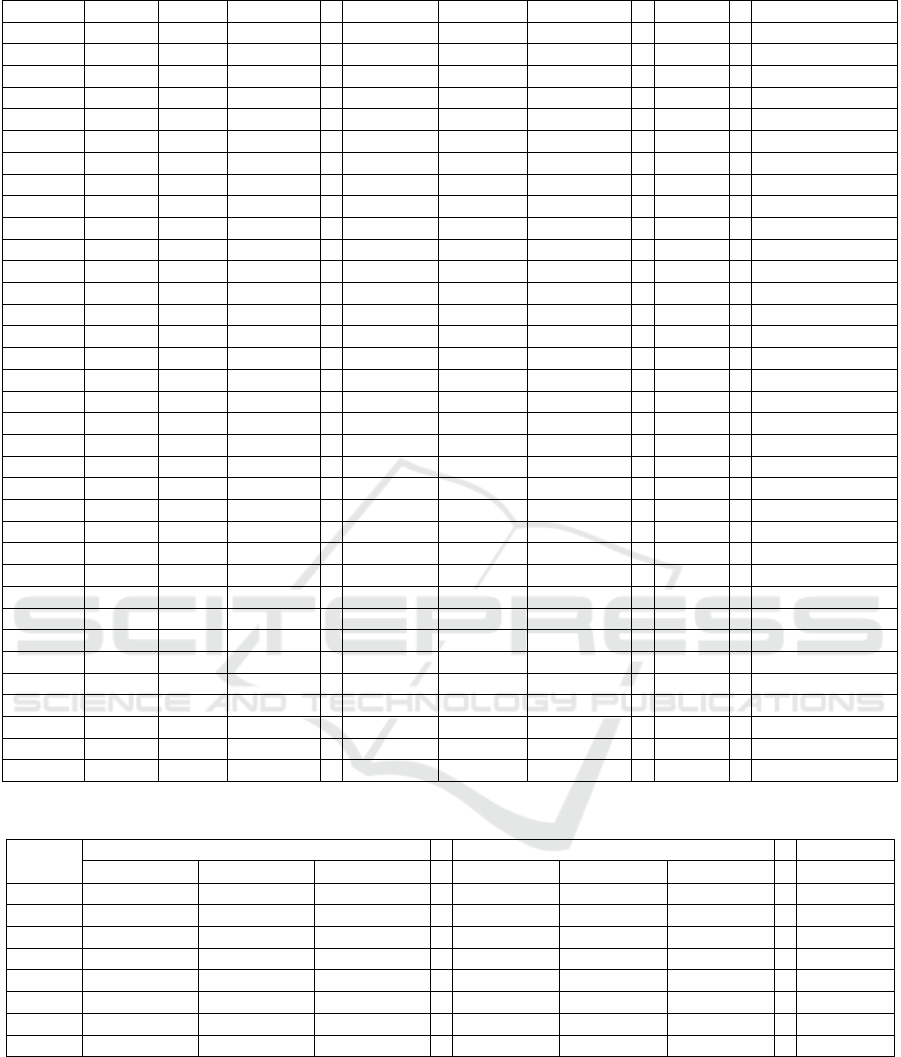
As another example, data from 50 banks was
provided. There are three inputs and 3 outputs. This
problem is solved by an improved two-stage DEA.
The optimal values of the first stage and the objective
function of the second stage are showed by the last
two columns of Table 3. There are eight DMU
s
whose
optimal value 𝛿
∗
0.
Table 3: Input and output of the 50 DMU
s
DMU
s
In
p
uts Out
p
uts Sta
g
e 1 Sta
g
e II
Empl. Cost Debt. Deposits Income Loan
𝜃
∗
𝛿
∗
DMU
1
32 161 446,869 551,768 2,068 1,209,876 1.0000 0.000005448
DMU
2
19 2,026 22,345 87,365 2,848 103,573 1.0000 0.000017493
DMU
3
14 1,456 12,830 50,206 2,755 208,456 0.8943
DMU
4
5 4,566 145 77,436 1,554 12,789 1.0000 0.000096789
DMU
5
18 1,324 21,567 24,794 1,638 45,790 0.6360
DMU
6
18 1,562 25,689 25,894 1,448 44,567 0.7862
DMU
7
16 1,468 54,243 95,804 1,578 80,942 0.6453
DMU
8
17 1,884 39,453 25,266 1,895 35,790 0.8543
DMU
9
9 1,636 12,456 28,885 1,572 55,782 1.0000 0.000036918
DMU
10
13 1,993 7,623 34,226 1,277 209,765 0.8764
DMU
11
8 1,934 34,562 87,990 1,445 45,674 1.0000 0.000032445
DMU
12
11 1,279 2,487 77,567 2,051 77,833 0.4325
DMU
13
17 2,426 11,453 45,698 2,745 50,975 0.5543
DMU
14
14 1,236 10,934 78,965 2,774 120,987 0.5547
A New Procedure of Two Stage Data Envelopment Analysis Model under Strict Positivity Restriction
1033
DMU
15
14 2,011 22,176 88,784 2,341 35,678 0.5722
DMU
16
7 2,894 26,832 33,489 1,090 58,542 0.3974
DMU
17
12 1,500 8,643 56,779 1,462 556,709 0.3894
DMU
18
9 1,475 3,411 69,055 1,572 450,097 0.4490
DMU
19
5 1,290 1,421 67,784 1,635 169,005 0.5768
DMU
20
6 2,094 3,744 92,675 1,725 33,789 0.5947
DMU
21
6 2,068 5,321 38,000 1,613 87,734 0.3462
DMU
22
8 2,848 31,589 65,470 2,025 56,733 0.5231
DMU
23
9 2,755 4,215 34,226 1,486 34,098 0.5279
DMU
24
8 1,554 65,782 87,990 3,566 66,990 0.4469
DMU
25
7 1,638 20,021 77,567 2,324 59,032 0.5103
DMU
26
9 1,448 25,072 95,804 4,572 133,456 0.3974
DMU
27
7 1,578 14,081 25,266 1,498 12,500 0.5478
DMU
28
7 1,895 16,702 28,885 1,874 31,567 0.4580
DMU
29
7 1,572 6,574 34,226 1,536 51,578 0.4356
DMU
30
6 1,277 5,432 87,990 1,984 76,890 0.5569
DMU
31
7 1,445 7,331 77,567 1,935 34,590 0.5021 0.000034526
DMU
32
7 2,051 2,361 45,698 1,289 98,004 0.4592
DMU
33
8 2,745 2,093 78,965 2,426 95,709 0.3678
DMU
34
9 2,774 2,100 88,784 1,236 39,056 0.5946 0.000033468
DMU
35
5 2,341 1,946 33,489 2,011 34,781 0.5793
DMU
36
7 1,090 1,421 56,779 2,894 72,890 0.5198
DMU
37
8 1,462 3,744 37,586 1,500 39,357 0.5356 0.000005549
DMU
38
6 1,572 5,321 77,895 1,475 55,490 0.5782
DMU
39
5 1,635 31,589 76,880 1,290 33,789 0.5583
DMU
40
9 1,725 4,215 34,556 2,094 87,734 0.5932
DMU
41
5 1,545 65,782 67,032 1,678 56,733 0.5435
DMU
42
6 1,792 25,689 87,004 1,568 65,470 0.5321
DMU
43
6 1,227 54,243 79,034 3,899 34,226 0.5271
DMU
44
7 1,967 39,453 66,503 1,257 87,990 0.4367
DMU
45
5 1,215 12,456 80,933 1,065 77,567 0.3561
DMU
46
5 1,157 7,623 79,335 1,803 95,804 0.5519
DMU
47
6 1,592 34,562 44,897 2,560 56,903 1.0000
DMU
48
5 1,278 2,487 76,449 1,774 103,466 0.4706
DMU
49
6 1,373 11,453 77,803 1,356 12,890 0.5335
DMU
50
4 1,298 10,934 69,067 2,508 33,390 1.0000
Table 4: The strictly positive weights of the efficient DMU
s
DMU
s
In
p
uts Out
p
uts Sta
g
e II
𝑣
∗
𝑣
∗
𝑣
∗
𝑢
∗
𝑢
∗
𝑢
∗
𝛿
∗
DMU
1
0.00000544 0.00007144 0.00002824 0.0000544 0.0000544 0.0000544 0.0000544
DMU
2
0.00001749 0.00037749 0.00001049 0.0001749 0.0003669 0.0001749 0.0001749
DMU
4
0.00009678 0.00009678 0.00078578 0.0002578 0.0009678 0.0009678 0.0009678
DMU
9
0.00003691 0.00003691 0.00014991 0.0003691 0.0003691 0.0003691 0.0003691
DMU
11
0.00003244 0.00003244 0.00093744 0.0003244 0.0003244 0.0003244 0.0003244
DMU
31
0.00003452 0.00003452 0.00067452 0.0003452 0.0003452 0.0003452 0.0003452
DMU
34
0.000033468 0.004733468 0.000031569 0.00033468 0.00033468 0.00033468 0.0003346
DMU
37
0.000005549 0.000391549 0.000101549 0.00005549 0.00005549 0.00005549 0.0000554
DMU with optimal value will then determine its
strictly positive weight value as shown in table 4.
From table 3 it can be seen that there are 8 DMUs that
have optimal values in stage 2, they are DMU
1
,
DMU
2
, DMU
4
, DMU
9
, DMU
11
, DMU
31
, DMU
34
and
DMU
37
. The eight efficient DMUs will then be
determined its strictly positive weight as shown by
Table 4.
ICOSTEERR 2018 - International Conference of Science, Technology, Engineering, Environmental and Ramification Researches
1034

6 CONCLUSIONS
In this paper, in order to achieving strictly positive of
multipliers, we have to eliminate the role of non-
Archimedean (ε), in the DEA models. The model
used in this study is the multiplier form of the DEA-
CCR model. By considering that all weights on its
constraints are non-negative number.
In the first stage, we solved a new CCR model
to specifying the CCR-efficient DMUs using LINDO.
At this stage we get an efficient DMUs. In the second
stage we will evaluate the efficient DMU that we get
in the first stage to get the strictly positive value for
their inputs and outputs.
On the other hand, from the computational test
result using LINDO, we have to pay attention to gain
the accuracy of computations result. This method is
able to provide better efficiency results for cases of
positive strictly constraints. This will help decision
makers in making decisions on issues with scenarios
that correspond to the proposed model.
REFERENCES
Amin, G. R. and Toloo, M., 2004. A polynomial-time
algorithm for finding ε in DEA models. Computers &
Operations Research, 31, 803-805.
Andersen, P., & Petersen, N. C., 1993. A procedure for
ranking efficient units in data envelopment analysis.
Management Science, 39, 1261-1264.
Yao, C., 2003. Measuring super-efficiency in DEA in
presence of infeasibility, European Journal of
Operational research, 161- 2, 429444.
Charnes, A., Cooper, W. W. and Rhodes, E., 1978.
Measuring the efficiency of decision making units.
European Journal of Operational Research, 2, 429-444.
Charnes, A., Cooper, W. W. and Rhodes, E., 1979.
Measuring the efficiency of decision-making units.
Short Communication European Journal of Operational
Research, 3, 339.
Cooper, W.W., Li, S., Seiford, L.M., Tone, K., Thrall,
R.M., Zhu, J., 2001. Sensitivity and stability analysis in
DEA: Some recent developments. Journal of
Productivity Analysis 15, 217-246.
Saen R. F., 2010. Developing a new data envelopment
analysis methodology for supplier selection in the
presence of both undesirable outputs and imprecise
data. International Journal of Advanced Manufacturing
Technology Vol. 51,p.1243-1250.
Thompson, R. G., Thrall, R. M. and Dharmapala, P. S.,
1993. Importance for DEA of zeros in data, multipliers,
and solutions. The Journal of Productivity Analysis, 4,
379-390.
A New Procedure of Two Stage Data Envelopment Analysis Model under Strict Positivity Restriction
1035
