
Previous Concrete Development
Rahmi Karolina
1
, Syahrizal
1
, M. A. P. Handana
1
, M. Rizky Indrawan
1
1
Department of Civil Engineering Universitas Sumatera Utara
Keywords: Previous Concrete, Infiltration, Concrete.
Abstract:
Based on the Meteorology, Climatology and Geophysics Agency (BMKG), the average rainfall in Indonesia
is quite high, the high rainfall caused the number of inundation. One reason is the use of concrete as a
pavement material in residential areas. The increased region areas covered by pavement with settlement
construction as well as in urban areas can result in a shorter water gathering time, so the accumulation of
collected rainwater exceeds the existing drainage capacity.Porous concrete is expected to be able to solve
the problem of the shrinking land infiltration capacity and run – off magnitude, the magnitude of flood
discharge and landslide.From the result of the research, the highest compressive strength on variation I (BP
0) is 13.29 MPa, and the lowest compressive strength in variation IV (BP 15) is 5.78 MPa. In the resistance
test of Sodium Sulfate, the highest compressive strength in variation I (BP 0) is13.50 Mpa, and the lowest is
in variation IV (BP 15) which is 5.07 MPa. In the infiltration rate test, the highest value on variation I (BP
0) is 3.71 x 10⁻³ mm / h, and the lowest value on variation V (BP 20) is 2.39 x 10⁻³ mm / h.
1 INTRODUCTION
1.1 Background
One of concrete usage is as a pavement material in
residential areas. The increased region areas covered
by pavement with settlement construction as well as
in urban areas can result in a shorter water gathering
time, so the accumulation of collected rainwater
exceeds the existing drainage capacity.
The porous concrete is a simple form of
lightweight concrete made by eliminating the use of
fine aggregates. As a result of not using sand in
porous concrete, air-filled cavities is created. Cavity
levels range from 12% to 25%. This cavity resulted
in a reduced density of the concrete as well as a
reduced amount of area that needs to be covered by
cement paste, thereby directly affecting the portion
of cement in the mixture and able to save the
construction cost.
The density of porous concrete depends on the
gradation of the coarse aggregate used, usually the
porous concrete density ranges from 60% -70% of
the normal concrete density. The size of the coarse
aggregate used is between 10-20 mm. Aggregates
that can be used includes crushed stones, natural
gravels, blast furnace slags and clinkers. Aggregates
of crushed stones produce a higher compressive
strength than when using natural gravels that tend to
have rounded surfaces.
1.2 Research Purposes
The purpose of the author in this research for final
task are as follows:
1. To know the amount of porous concrete mixing
composition to get an optimum result.
2. To determine the compressive strength,
infiltration, resistance to optimum sodium sulfate
in each composition.
312
Karolina, R., Syahrizal, ., Handana, M. and Indrawan, M.
Previous Concrete Development.
DOI: 10.5220/0010090603120316
In Proceedings of the International Conference of Science, Technology, Engineering, Environmental and Ramification Researches (ICOSTEERR 2018) - Research in Industry 4.0, pages
312-316
ISBN: 978-989-758-449-7
Copyright
c
2020 by SCITEPRESS – Science and Technology Publications, Lda. All rights reserved

Table 1: The proportion of concrete mixture every variation per m3.
Description
Cement
(kg)
Sand
(kg)
Water
(kg)
Gravel
(kg)
Master
Euse
3029
(L)
Variation I
(
N
)
300 0 121,3 1800 1,8
Variation
II
(
A
)
300 90 121,3 1710 1,8
Variation
III (B)
300 180 121,3 1620 1,8
Variation
IV (C)
300 270 121,3 1530 1,8
Variation
V
(
D
)
300 360 121,3 1440 1,8
2 METHOD
The method used in this research is an experimental
study conducted at the Concrete Laboratory of
Faculty of Engineering of Department of Civil
Engineering of University of North Sumatra.
Generally the sequence of the research phases
includes: a. Provision of constituent materials for
previous concrete materials, b.Examining of
materials, c.Mix Design, d.Making of samples,
e.Curing, f.Compressive strength test of 28 days of
age, g.Infiltration test, h.Absorption test and
i.Resistance to sodium sulphate test
2.1 Mix Design
A complete mix design calculation can be seen in
the attachment. From the mix design results, it is
obtained 1m³ concrete mixture proportion among
others are as follows:
2.2 Visible Properties Test
Concrete bricks should have a flat surface, no cracks
and defects, the corners and ribs are not easily
brushed with the strength of fingers. All of these are
examined with careful observation by arranging
bricks on a flat surface as in the actual installation.
2.3 Size Test
The concrete brick must have a minimum nominal
thickness of 60 mm with a tolerance of + 8%. This
test is performed using a capillary pipe or the like
with a precision of 0.1 mm. Thick measurements is
done on three different places and the average score
is taken. Tests conducted on 10 pieces of samples.
2.4 Concrete Compressive Strength
Test
The test is done on 28 daysof age concrete for each
concrete variation of 10 pieces. Compressive
strength test of concrete is done by using electric
compress machine with 2000 KN capacity.The
compressive strength of a concrete sample is
calculated by the formula:
Α
Ρ
cf'
(1)
where: f’c = Compressive strength (kg/cm
2
)
P = Compressive load (kg)
A = Surface area of sample (cm
2
)
2.5 Resistance to Sodium Sulphate Test
The test is done on concrete that soaked in sodium
sulfate solvent for each concrete variation of 3
pieces. Compressive strength test of concrete is done
Previous Concrete Development
313
by using electric compress machine with 2000 KN
capacity.
The compressive strength of a concrete sample is
calculated by the formula:
Α
Ρ
cf'
Where: f’c = Compressive strength (kg/cm
2
)
P = Compressive load (kg)
A = Surface area of sample (cm
2
)
2.6 Absorbtion Test
Five samples in a good state is soaked in water until
saturated (24 hours), weighed in a wet state. Then
dried in the dryer kitchen for approximately 24
hours, at a temperature of about 105°C until the
weight on the twice weighing differ less than 0.2%
of the preceding weighing.
Water absorption is calculated as follows
Water absorption =
(2)
Where :
A = wet concrete weight
B = dry concrete weight
2.7 Infiltration Test
This infiltration test is to determine the water
content that passes from the surface of concrete with
mm / hour units. The tool used is a ring with a size
of 12 inches, the ring is affixed to the surface of the
concrete with an adhesive tool so that the water will
not flow out from the bottom side of the ring. Based
on ASTM C 1701 / C the formula used is as follows:
(3)
Where:
I = Infiltration rate (mm/jam)
M = Water weight(kg)
D = Inner ring diameter (12 inchi/ 30,5 mm)
t = the time it takes to pass water from the top of
the ring to the bottom of the surface
K = constants (4,583666 x 10
3
untuk SI atau
1,26870 untuk inch-pound)
3 RESULTS AND DISCUSSION
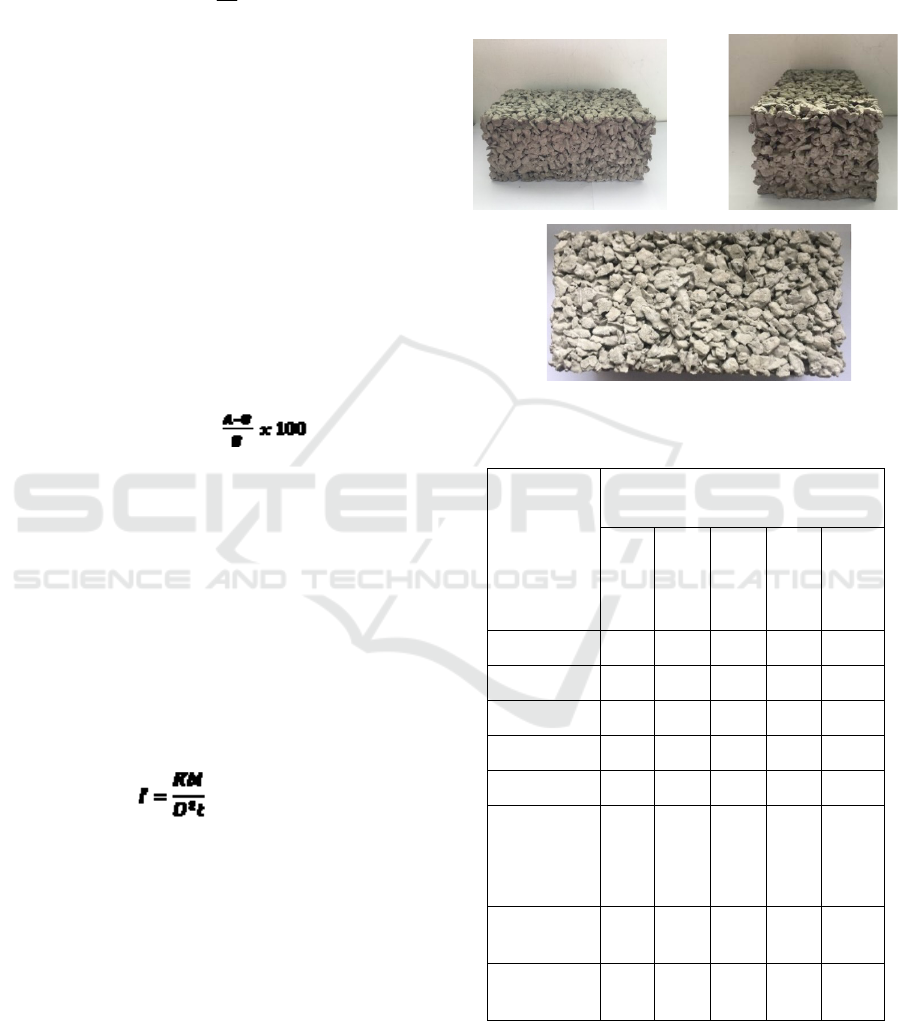
3.1 Visible Properties
Figure 1: Visual Test. a. Side view, b. Front view, c. Top
view.
Table 2: From the examination of paving block visible
properties, obtained data as follows:
Description
Paving Block
0 %
san
d
5 %
sand
10
%
sand
15
%
sand
20 %
sand
1. Sector
a. Flatness Flat Flat Flat Flat Flat
b. Rift No No No No No
c. Fineness Fine Fine Fine Fine Fine
2. Ribs
a. Right-
angledn
ess
Rig
ht-
angl
ed
Rig
ht-
angl
ed
Rig
ht-
angl
ed
Rig
ht-
angl
ed
Right
-
angle
d
b. Sharpne
ss
Sha
rp
Shar
p
Shar
p
Shar
p
Shar
p
c. Strength
Stro
ng
Stro
ng
Stro
ng
Stro
ng
Stron
g
a
b
c
ICOSTEERR 2018 - International Conference of Science, Technology, Engineering, Environmental and Ramification Researches
314
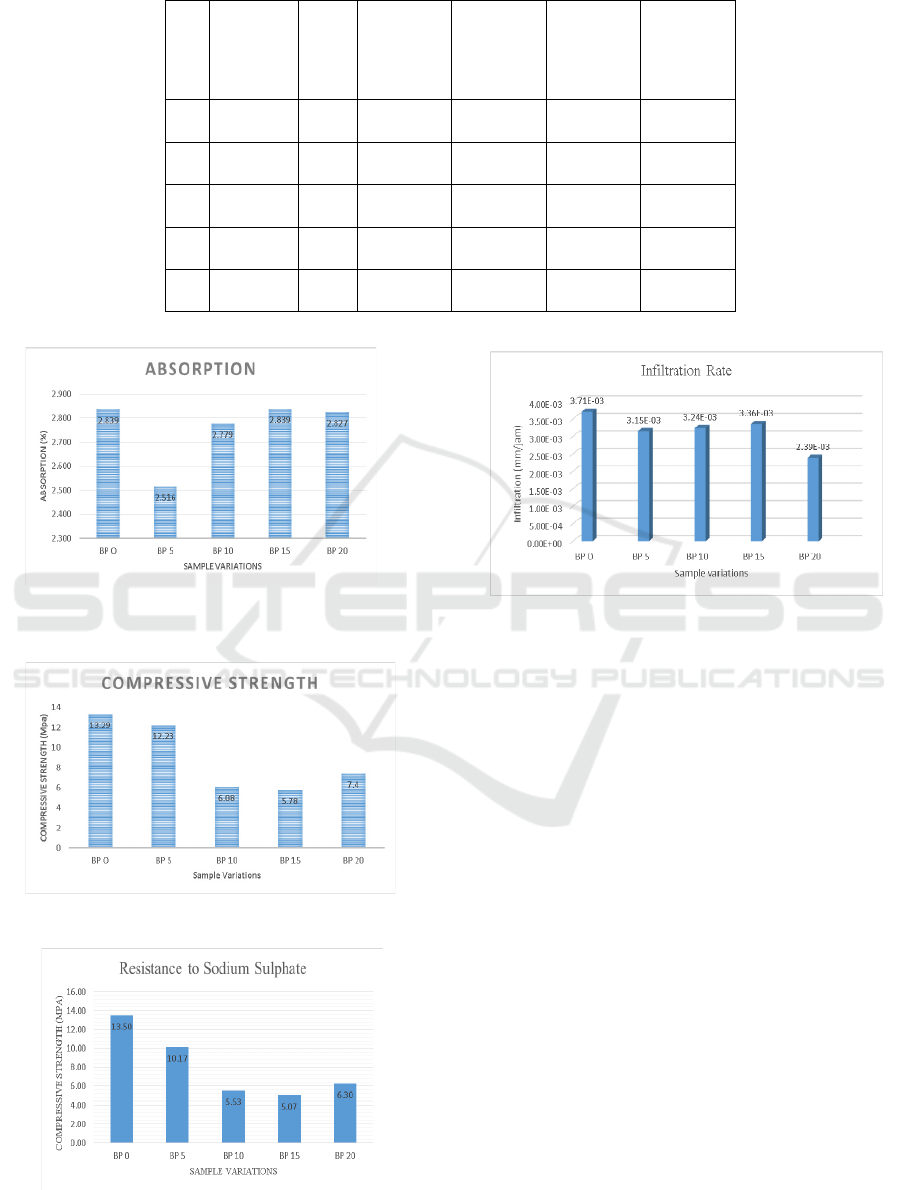
Table 3: From the examination of paving block, obtained data as follows
No Variation Type
Right
Side
Thickness
Left Side
Thickness
Middle
Side
Thickness
Average
Thickness
1
0 %
san
d
8,183 8,185 8,205 8,191
2
5 %
san
d
8,157 8,104 8,102 8,121
3
10%
san
d
8,193 8,026 8,157 8,125
4
15%
san
d
8,117 8,092 8,112 8,107
5
20%
san
d
8,193 8,026 8,157 8,125
Figure 2: Graph of Paving Block Absorption.
Figure 3: Graph of Paving Block Compressive.
Figure 4: Graph of Resistance to Sodium Sulphat.
Figure 5: Graph of Infiltration Rate.
Based on the figures behind it is obtained that on
Figure 2 the highest absorption value is on BP
variation and the lowest is on BP 5 variation, on
Figure 3 the highest compressive strength is on BP
variation and the lowest is on BP 15 variation, on
Figure 4 the highest resistance to sodium sulfate is
on BP variation and the lowest is on BP 15 variation,
on Figure 5 the highest infiltration is on BP variation
and the lowest is on BP 20 variation.
4 CONCLUSIONS
From the research results, analysis, and discussion
that have been implemented, it can be concluded as
follows:
1. In the mixture, the amount of water, cement,
and master Euse are determined as
parameters to compare the compressive
strength, absorption, resistance to Sodium
Sulfate and infiltration rate.
2. Based on the test results, it can be concluded
that the optimum variation is on variation I
(BP 0) because it has the highest compressive
strength and a large infiltration. For variation
Previous Concrete Development
315

I (BP 0) compressive strength is 13.29 MPa,
resistance to Sodium Sulfate of 13.50 MPa,
and infiltration rate of 3.71 x 10⁻³ mm / h.
3. Based on the discussion, it can be concluded
that previous concrete without using sand has
a larger copressive strength when compared
to using sand. Variation II (BP 5)
compressive strength is 12.23 MPa, variation
III (BP 10) is 6.08 MPa, Variation IV (BP 15)
is 5.78 MPa, and variation V (BP 20) is 7.4
MPa.
4. For the results of the resistance of Sodium
Sulphate test, Variation II (BP 5)
compressive strength is 10.17 MPa, variation
III (BP 10) is 5.53 MPa, variation IV (BP
15) is 5.07 MPa, and variation V (BP 20) is
6.30 MPa
.
5. For the infiltration rate test, it is obtained that
Variation II (BP 5) is 3.15 x 10⁻³, variation
III (BP 10) is 3.24 x 10⁻³, variation IV (BP
15) is 3.36 x 10⁻³, and variation V (BP 20) is
2.39 x 10⁻³.
5 SUGGESTIONS
After seeing the research results and realize the
possibility of deficiencies in this research, the
authors can provide suggestions as follows:
1. Further research is needed to be done with
different dosage variations and combined with
other types of chemical admixture.
2. For further research, it needs to be done for
different materials and different gradations.
3. In the process of porous concrete casting, it is
necessary to notice the water content because if
the cement water factor is less or more, it will
greatly affect the spreading of pores.
ACKNOWLEDGEMENTS
Thank you to USU Research Institute and
TALENTA USU Research Program 2018 for
funding this research.
REFERENCES
ANNUAL BOOK of ASTM
STANDARDS.(1991).Concrete and Aggregate
FIE, PASCE, CEng FICE, BEng MEng, and R. N.
Swamy. "Concrete Technology and Design, New
Concrete Material." (1983).
Fintel, Mark. "Buku Pegangan tentang Teknik
Beton." Cetakan Pertama. Jakarta: PT Pradanya
Paramita (1987).
Ginting, A. (2016). Kuat Tekan dan Porositas Beton
Porous Dengan Bahan Pengisi Styrofoam. Jurnal
Teknik Sipil, 11(2).
Handana, M. A. P., Karolina, R., & Syahputra, E. (2018,
March). Previous concrete as one of the technology to
overcome the puddle. In IOP Conference Series:
Earth and Environmental Science (Vol. 126, No. 1, p.
012041). IOP Publishing.
Hanta, L., & Makmur, A. STUDI EKSPERIMENTAL
PENGARUH BENTUK AGREGAT TERHADAP
NILAI POROSITAS DALAM CAMPURAN BETON
BERPORI PADA APLIKASI JALUR PEJALAN
KAKI.
Karolina, Z. R. (2017). KAJIAN PENDAHULUAN
BETON LOLOS AIR (POROUS CONCRETE)
DENGAN PENAMBAHAN MASTERROC
HCA10. Jurnal Teknik Sipil USU, 6(1).
Nevile M A . 1977. “Properties of Concrete”. The Englsih
Language Book Society Pitman Publishing
Nugraha, Paul. "Antoni." Teknologi Beton (2007)
Prabowo, D. A. (2014). Desain Beton Berpori Untuk
Perkerasan Jalan Yang Ramah Lingkungan
(Porous Concrete Pavement Design For
Environmentally Friendly Pavement).
Puja, A., and P. Rachmat. "Pengendalian mutu beton
sesuai SNI, ACI dan ASTM." (2010).
Shetty, M. S. "Concrete technology." S. chand & company
LTD (2005): 420-453.
Sugianto, K. J. R. (2002). Banjir, Beberapa Penyebab dan
metode pengendaliannya dalam perspektif
Lingkungan.
Yap, S. P., Chen, P. Z. C., Goh, Y., Ibrahim, H. A., Mo,
K. H., & Yuen, C. W. (2018). Characterization of
pervious concrete with blended natural aggregate and
recycled concrete aggregates. Journal of Cleaner
Production, 181, 155-165.
.
ICOSTEERR 2018 - International Conference of Science, Technology, Engineering, Environmental and Ramification Researches
316
