
Perceived Stress Profile among Lecturers in Universitas Sumatera
Utara
Elvi Andriani Yusuf
1
, Hasnida
2
, Amalia Meutia
3
1
Developmental Psychology Departement. Faculty of Psychology, Universitas Sumatera Utara, Medan
2
Clinical Psychology Departement. Faculty of Psychology, Universitas Sumatera Utara, Medan
3
General and Experimental Psychology Departement. Faculty of Psychology, Universitas Sumatera Utara, Medan
Keywords: Coping Stress, Lecturer, Mandala Creation.
Abstract: This study is a preliminary study that collect data to provide empirical evidence on the stress profile among
lecturers in Universitas Sumatera Utara, Medan. The data later will be use for an experimental research using
Mandala creative art intervention to reduces stress among lecturers. 275 lecturers from various faculty were
invited to participate in this research, only 53 participants completed the online survey of the Perceived Stress
Scale. The variables of this research are level of stress, sex, stage of development, level of education and area
of specialisasion. Data analysed by descriptive statistic. Findings showed that the level of lecturers stress,
1.9% very light, 13.2% mild, 34% moderate, 45% severe and 5.6 % very severe level of stress . The results
also showed that female leturers are more stress than male lecturers, 30.20% of female lecturers were at the
level of severe stress. According to area of specializasion, there were no differences level of stress according
to area of specialization Science & and Technology, Health and Social Humaniora. There were also no
differences level of stress between lecturers from different level of education and stage of development.
1 INTRODUCTION
In Indonesia now a days, stress is a common
condition for everyone, including lecturers. Working
in the university todays are more demanding than
before. Beside the three pillars (Tridharma) of higher
education responsibilities, lecturer certification that
must be obtain and upgrade and the higher amount of
student that entering the university every year are
some of the situation that makes the job load of
lecturer are very big. This shows that lecturers
require a high level of commitment to accomplishing
their responsibilities. The number of demands and
responsibilities that the lecturers should take, plus the
environmental conditions and other triggering factors
can cause stress.
Study about stress among lecturer had been
conduct at several university in Indonesia such as
Universitas Gajah Mada (Cahyono, 2017),
Universitas Negeri Semarang (Rustiana, 2012) and
others. Lecturer was not an healthy profession today
(Cahyono, 2017),. Study reports that 13% lecturers
have mild stress, 77% moderate stress and 10%
severe stress (Rustiana, 2012). The stress was caused
by work stress, 42,3 % because of work load, 22,7%
work environment, 17,7% personal problems and 17,
7% other problems (Kusnadi, 2014).
Stress occurs when one sees an event or
circumstance is threatening, demanding, or beyond
his or her capacity to handle (Cohen, S., Kamarck, T.,
& Mermelstein, R, 1983). Stress is the response of
individuals to taxing circumtances and event called
stressors, that threaten them and tax their coping
abilities. A number of factors are involved in stress:
physical and biological, personality, cognitive,
environmental and sociocultural (Santrock W.J.
,2002).
Another approach to understanding stress
examines it as a broader perceived experience.
Perceived stress is one’s global evaluation of life as
being unpredictable, uncontrollable or overloaded .
Perceived stress is theoretically influenced by how
well an individual adapted to or coped with all of the
situational stress he or she has recently encountered,
as well as the number of stressors the individual has
Yusuf, E., Hasnida, . and Meutia, A.
Perceived Stress Profile among Lecturers in Universitas Sumatera Utara.
DOI: 10.5220/0010089815891593
In Proceedings of the International Conference of Science, Technology, Engineering, Environmental and Ramification Researches (ICOSTEERR 2018) - Research in Industry 4.0, pages
1589-1593
ISBN: 978-989-758-449-7
Copyright
c
2020 by SCITEPRESS – Science and Technology Publications, Lda. All rights reserved
1589
faced (Cohen, S., Kamarck, T., & Mermelstein, R,
1983).
Stress has two components: physical involving
direct material or body challenge and psychological,
involving how individuals perceive circumtances in
their lives (Sarafino, 2006). According to Dougall &
Baum and Hobfoll this component can be examined
in three way : first, environment : stress is seen as a
stimulus, as when there is a demanding job or
experience or family/health problems. Second, stress
as a response, focusing on people reaction to stressor.
Third, stress as a process that include stressor and
strain, add the relationship between the person and
environment (Sarafino E.P., 2006).
2 MATERIALS AND METHODS
2.1 Research Location
Research conducted at Universitas Sumatera Utara.
2.2 Methods
2.2.1 Study Design and Data Collection
This study is a descriptive quantitative study that used
a non-experimental survey design to describe
lecturer’s perceive stress profile. 275 lecturers from
various faculty were invited online to participated in
the study and 53 lecturer complete the online survey.
2.2.2 Measurement
Perceived Stress Scale (PSS) is a well known
psychological instrument for measuring the
perception of stress that conduct by Sheldon Cohen
(Cahyono, 2017) (Cohen, 1983). PSS-10 measure of
the degree to which situation in one’s life are
appraised as stressful. Items were designed to assess
how unpredictable, uncontrollable, or overloaded
participant find their lives to be. The responses to the
10 items were then summed to create a
psychological stress score, with higher
scores indicates greater psychological stress.
Internal reliabilities (Cronbach’s Alpha) for the
PSS-10 were .78 in the Harris Poll sample,
and .91 in both the 2006 and 2009 eNation
samples (Cahyono, 2017) Participants answer
each question using a five –point Likert rating scale,
rate their current level of stress ranging from 0 =
never, 1 = almost never, 2 = sometimes, 3 = fairly
often, 4 = very often. The PSS-10 total scores are
obtained by reversing the scores on the four positive
items, then summing across all 10 items, so that a
higher total score indicates higher stress.
2.2.3 Data Analysis
The data collected analyse by descriptive statistics (
SPSS).
3 RESULTS
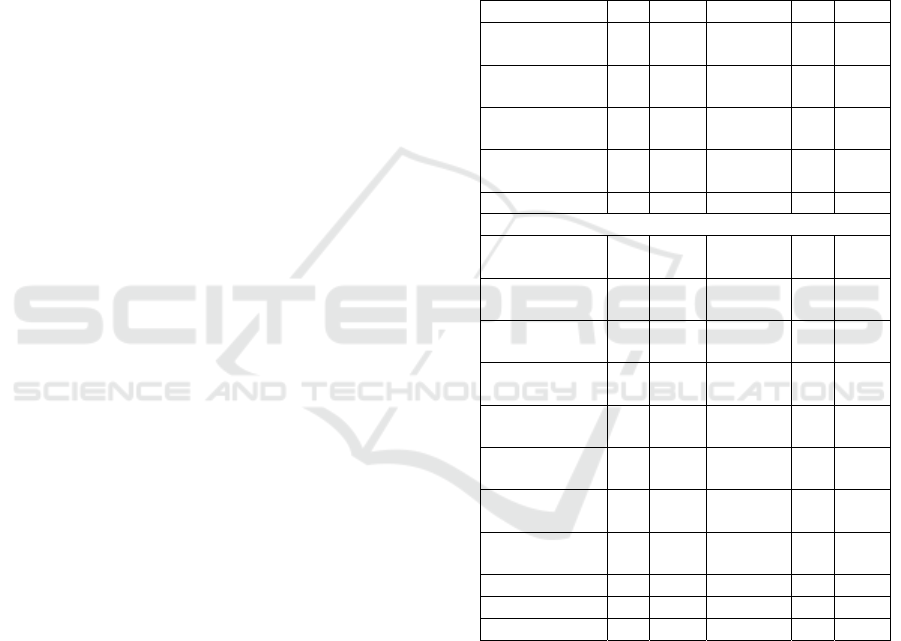
Table 1. Description of Subject Characteristic.
At Table 1, total participants are 53 lecturers, with the
variables of level of education, stage of development,
sex, area of specialization and stress profile. From 53
participants, the characteristic lecturer with master
degree (47.2%), master specialist (34%) and doctoral
(18.9%). According to area of specialization, social-
humanity (58.5%), health (28.30%) and science and
technology (13.2%). The variables of development
stage shows that lecturer in early adulthood 56.6%
and female lecturer 69.8%. The results also shows
the stress profile of the partisipants, lecturers with
severe stress (45.3%), moderate stress (34%), mild
Variable N % Variable N %
Level of
education
Sex
Maste
r
25 47.2
Male
16
3
0.2
Master
specialist 18 34
Female
37
6
9.8
Doctoral 10 18.9
Total
53
1
00
Total 53 100
Area
Spesialization N %
Stress
Level N %
Science &
Tech 7 13.2
Very
mil
d
3
5
.7
Health 15 28.3
Mild
5
9
.4
Social-
humanit
y
31 58.5
Moderat
e 18
3
4
Total 53 100
Severe
24
4
5.3
Very
severe
3
5
.7
Total 53
1
00
Stage of
develo
p
ment
n %
Early adult 30 56.6
Middle adult 23 43.4
Total 53 100
ICOSTEERR 2018 - International Conference of Science, Technology, Engineering, Environmental and Ramification Researches
1590
stress (9.4%), and stress level for very mild and very
severe has a same amount (5.7%). At table 2,
according to level of education, stage of development,
area of specialization, and sex, most of the participant
are in the level of severe stress (45.30%) dan only
5.7% are in the level of mild stress and very severe
stress.
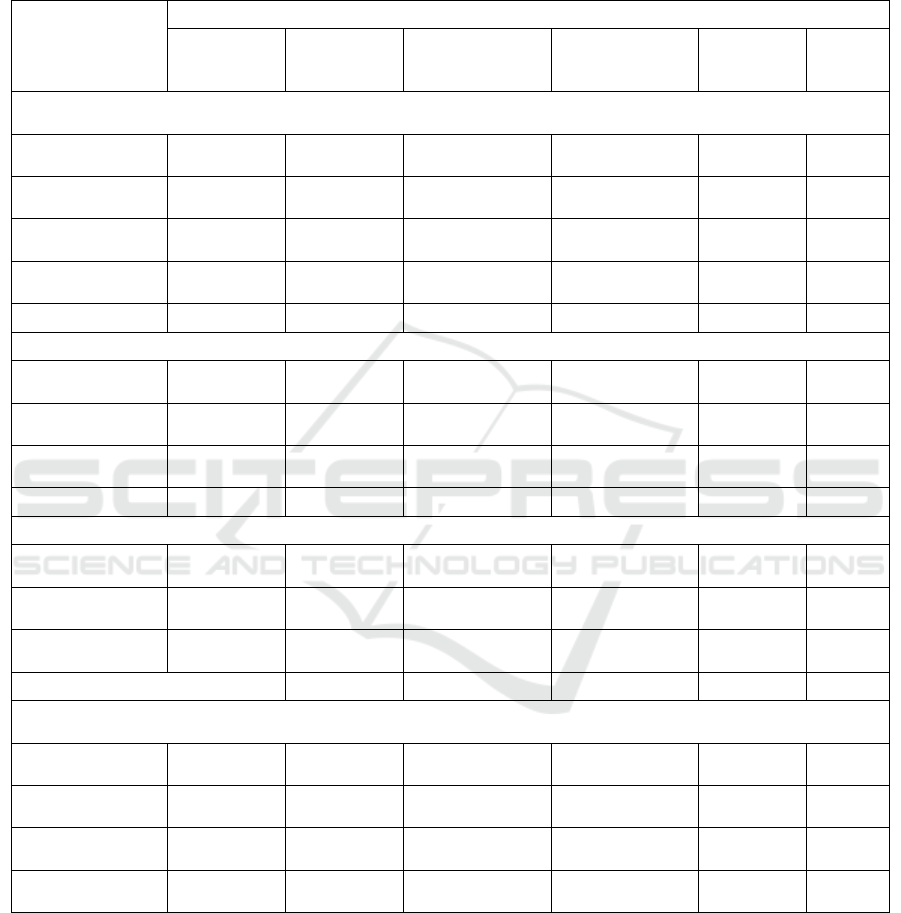
Table 2. Cross Tabulation Within Variable.
Variables
Stress level
Very mild
n (%)
Mild
n (%)
Moderate
n (%)
Severe
n (%)
Very
severe. n
(%)
Total
n (%)
Level
of education
Maste
r
3
(
5.70
)
3
(
5.70
)
8
(
15.10
)
8
(
15.10
)
3
(
5.70
)
25(47.2
0
)
Master s
p
ecialist
0(0.00) 0(0.00) 7(13.20) 11(20.80) 0(0.00)
18(34.0
0
)
Doctoral 0(0.00) 2(3.80) 3(5.70) 5(9.40) 0(0.00)
10(18.9
0)
Total 3(5.70) 5(9.40) 18(34.00 24(45.30) 3(5.70)
53(100.
00
)
Stage of development
Earl
y
adulthoo
d
2
(
3.80
)
2
(
3.80
)
12
(
22.60
)
13
(
24.50
)
1
(
1.90
)
30(56.6
0
)
Middle adulthoo
d
1 (1.90) 3(5.70) 6(11.30) 11(20.80) 2 (3.80)
23
(43.40)
Total 3(5.70) 5(9.40) 18(34.00) 24(45.30) 3(5.70)
53(100.
00)
Sex
Male 2
(
3.80
)
0
(
0.00
)
3
(
5.70
)
8
(
15.10
)
3
(
5.70
)
16(30.2
0
)
Female 1(1.90) 5(9.40) 15(28.30) 16(30.20) 0(0.00)
37(69.8
0)
Total 3 (5.70) 5(9.40) 18(34.00) 24(45.30) 3(5.70)
53(100.
00)
Area
specialization
Science & Tech
0
(
0.00
)
1
(
1.90
)
3
(
5.70
)
3
(
5.70
)
0
(
0.00
)
7(13.20
)
Health 1
(
1.90
)
2
(
3.80
)
3
(
5.70
)
9
(
17.00
)
0
(
0.00
)
15(28.3
0
)
Social-humanit
y
2(3.80) 2(3.80) 12(22.60) 12(22.60) 3(5.70)
31(58.5
0)
Total 3(5.70) 5(9.40) 18(34.00) 24(45.30) 3(5.70)
53(100.
00)
Severe stress level mostly found in the participants
with level of education Master specialist (20.80%),
Master degree (15.20%) and doctoral (9.40%).
Further, the very severe stress level only found in the
lecturers with master degree. (5.70%). Stress at all
levels from very mild to very severe tend to be found
at both stages of development (early and middle
adulhood) and with the most are at severe stress levels
(24.40% and 20.80%). Although female sex tended to
vary in levels of stress from mild to severe levels
(9.4%, 28.30% and 30.20% respectively), only male
participants experienced very severe stress (5.7%).
Contingency Correlation showed that there is a very
significant relationship between sex and stress level
(c = 0.439; p = 0.01).
Perceived Stress Profile among Lecturers in Universitas Sumatera Utara
1591

Participants with the area of the health program
also had a variety of stress levels from mild to severe
(1.90%, 3.80%, 5.70% and 17%), but only
participants from the social-humanity department
who tended to have very severe stress (5.70%).
4 DISCUSSION
The findings shows that there were no differences in
stress level according to level of education, stage of
development and area of specialization. The
association between work and education depends on
the social gradient and socioeconomic positions,
which means that the level of education will differ
in stress if the person have a different socioeconomic
position [9]. The higher education the lower stress
level and the lower education will creates a greater
stress. In this study the subject were all lecturer that
have post graduate education whether they were in
the level of master degree, master specialist or
doctoral. The subject also have the same level of work
and socioeconomic position. They face the same
stressor and job demands of higher education duties
that made them have a similar stress profile.
The lecturer’s stress profile at Universitas
Sumatera Utara showed most of the lecturer were at
the moderate to severe stress level. This founding
supported the study that conduct in Universitas Gajah
Mada (Lee, 2013) and Universitas Negeri Semarang
(Hyde, 2013) where 87% of respondent were in the
level of moderate and severe stress.
Other finding is that there we a strong relationship
between sex and stress level, female lecturer are most
at moderate and severe stress mean while male
lecturers tended to have very severe stress level. This
finding is opposite to the theory (Throsten, 2015) and
finding in the previuos research that Indonesian
culture demands women to take the role of “good
housewives,” and this condition often makes those
working women feel guilty and depressed, which
develop into stress. (Cohen, 2012). This is related the
condition of gender equality in this recent years, the
family roles for men and women are balance and
equal so the demand of the house wife role not been
focus anymore. In Indonesia, most of the family are
extended family, so role of house wife can be taken
offer by the member of the family. Futhermore, men
report being less concerned about managing their
stress that can lead men to have a higher level of
stress. Women are more likely than men spoken up
their stress and using multitude of strategies to
manage stress such as reading, spending time with
family or friends, praying, shopping and getting
massage and spa (Zulkarnain, 2015)
This study has several limitation, first, because
this is an on going research that still collecting data,
the subject in this research are still limited, only 53
subjects completed the online survey so the result
could not be generalized for all lecturer in Universitas
Sumatera Utara.
5 CONCLUSIONS &
RECOMMENDATIONS
This preliminary research findings showed that the
lecturers stress level vary from very mild to very
severe stress level..Stress at all levels also found at
both stages of development, early and middle
adulhood with the most are at severe stress. There are
a very significant relationship between sex and stress
level. There are no differences of stress profile
between level of education and area of specialization.
It is recommended to increase the amount of
participant to represent the more accurate stress
profile of the lecturers in Universitas Sumatera Utara.
Further, data collection can be combine in online and
offline survey. The variables of status of marital from
female lecturer can be study further to see if there is
a differences between married and unmarried female
stress level.
ACKNOWLEDGEMENTS
This paper is basic research scheme funded by
Universitas Sumatera Utara “Penelitian Keunggulan
Akademik (TALENTA) USU T.A USU 2018“.
REFERENCES
Cahyono., 2017. Kerja Dosen dan Umur Pendek.
http://www.jambiupdate.co/artikel-dosen-
berumur-pendek.html
Cohen, S., & Janicki-Deverts, D., 2012. Who's
stressed? Distributions of psychological stress in
the United States in probability samples from
1983, 2006 and 2009. J.of Applied Social
Psychology.
Cohen, S., Kamarck, T., & Mermelstein, R. (1983). A
global measure of perceived stress J. Health and
Social Behavior, Vol.24, 385-396.
ICOSTEERR 2018 - International Conference of Science, Technology, Engineering, Environmental and Ramification Researches
1592

Eun Hyun Lee (2013 ). Erratum to review of the
psychometric evidence of the Perceive Stress
Scale. Asian Nursing Research. Vol.7. N0.160
Hyde J.S & Quest N E., 2013. Half the human
experince, The psychology of women. Eight
edition. Wadsworth USA.
Kusnadi, Miqdad Arats., 2014. Hubungan antara
Beban Kerja dan Self Efficiacy dengan Stres Kerja
pada Dosen Universitas X. Surabaya : J. Ilmiah
Mahasiswa Universitas Surabaya Vol.3 No.1
Psychology Association American., 2011. Stress and
Gender, Stress in America.
http://www.apa.org/news/press/release/stress/201
1/gender/pdf
Rustiana., 2012. Stres Kerja Dengan Pemilihan
Strategi Coping. Jurnal Kesehatan Masyarakat.
Vol.7 No.2 (2012)
Sarafino E.P., 2006. Health Psychology,
biopsychosocial interaction, Fifth Edition, John
Wiley & Son.
Santrock W.J., 2002. A Topical Approach to Life
span development, International Edition,
Mc.Graw & Hill.
Thorsten Lunau et.al., 2015. The Association
between Education and Work Stress: Does the
Policy Context Matter? Plos One Journal
Zulkarnain, Yusuf, E. A., Pulungan, A. V., 2015. The
impacts of work-family conflict on burnout
among female lecturers. J.Makara Hubs-Asia,
Vol.19. No.2 DOI: 10.7454/mssh.v19i2.3477
Perceived Stress Profile among Lecturers in Universitas Sumatera Utara
1593
