
The Accuracy of Indonesian Version of HAM-A
Juliana Irmayanti Saragih
1
and Etti Rahmawati
2
1
Department of Clinical Psycology, Universitas Sumatera Utara, Jl. Dr. Mansyur No.7, Medan, Indonesia
2
Department of Experiment, Universitas Sumatera Utara, Jl. Dr. Mansyur No.7, Medan, Indonesia
Keywords: Test Anxiety, HAM-A, Hamilton Anxiety Scale.
Abstract: This study is part of a research to see if Diaphragmatic Breathing and Progressive Muscle Relaxation are
effective in reducing students' anxiety during tests. One tool that can be used to measure anxiety is the
Hamilton Anxiety Rating Scale (HAM-A). To see if HAM-A has accurate quality measurement results to
measure anxiety, it is tested upon the validity and reliability by involving 220 participants. The adaptation
process begins by examining the coexistence of anxiety constructs that exist in HAM-A. The next process is
an estimate of the correlation of HAM-A with the dimensions of the neurotic personality to prove convergent
validity. The Neurotical Subscale is one of five subscales in the Big Five Inventory (BFI). Based on the
analysis and review of the results, it can be concluded that the Hamilton Anxiety Rating Scale Scale (HAM-
A) which has been translated into the Indonesian language has an accurate quality measurement results to
measure anxiety.
1 INTRODUCTION
One of the factors that make student academic
performance is not optimal is anxiety and one of its
type is anxiety when facing examinations (Burns,
2004). Many students who experience anxiety during
the exam state that they are difficult to concentrate on
questions during the exam, which ultimately makes
their academic performance unsatisfactory even if
they know the material that is being tested (Amiri &
Ghoonsoly, 2015). This anxiety also appears to be
related to some other problems both physically and
psychologically in an academic setting. Students who
feel anxiety cannot optimize their potential while
undergoing the exam (Hancock, 2001). Anxious
students will also get lower test results (Everson et al.,
1991), more difficult to learn new materials in the
classroom and generally lower academic
performance (Chapell et al., 2005) They are also
reported to have low motivation, self-assessments
tend to be negative and difficult in concentration
(Swanson & Howell, 1996) even leading to suicidal
behavior (Schaefer et al., 2007).
The anxiety of facing a student exam can be
measured by the Hamilton Anxiety Rating Scale
(known as HAM-A) (Hamilton, 1959). Hamilton
Anxiety Rating Scale is a scale created by Max R
Hamilton in 1959 to measure anxiety levels
experienced by a person. The high level of student's
anxiety in facing the exam appears on the score
obtained on the scale of HAM-A. The higher the
score gained means the higher the anxiety felt by the
student when facing the exam, the lower the score
obtained means the lower the anxiety level
.
1.1 Validity
Validity refers to how far the evidence and theories
support the interpretation contained in the test scores
required for the use of the test itself. Validity is not
seen from the test instrument as a research instrument,
but viewed from the measurement results of a test
device (Osterlind, 2010).
Evidence of validity based on internal structure
emphasizes the study of the construction of
measuring instruments in accordance with the theory
on which it is based. With proof of internal structure,
we will be able to know whether a measuring
instrument is really a representation of the latent
attribute to be measured. Analysis model of validity
evidence with internal structure can be done with
Multitrait-multimethod and confirmatory factor
analysis. Evidence of validity based on the
relationship with other variables is a review of how
far the scores obtained are related to other scores
(criteria). Procedures that can be done through
Saragih, J. and Rahmawati, E.
The Accuracy of Indonesian Version of HAM-A.
DOI: 10.5220/0010088015451549
In Proceedings of the International Conference of Science, Technology, Engineering, Environmental and Ramification Researches (ICOSTEERR 2018) - Research in Industry 4.0, pages
1545-1549
ISBN: 978-989-758-449-7
Copyright
c
2020 by SCITEPRESS – Science and Technology Publications, Lda. All rights reserved
1545

experimental and correlational studies based on
nomological network construct are measured.
1.2 Item Discrimination
Ebel (Azwar, 2013) mentions that the evaluation of
the item discrimination power index can be divided
into four categories, namely: item with a
discrimination power index of 0.40 or more is
categorized as excellent, 0.30-0.39 is categorized as
good, but needs to be improved. While the
discrimination power index of 0.20-0.29 is
categorized as unsatisfactory or needs to be corrected
and the item discrimination power index of less than
0.29 is bad and should be discarded.
1.3 Reliability
Reliability refers to the accuracy of measurement in
assessing an individual's ability or personality
(Osterlind, 2010). The accuracy of a measurement is
determined by the consistency of measurement
results from various assessments. The more
consistent the measurement results, the better the
reliability. A measuring instrument must have
consistency, so that the result of measuring
instrument from one subject does not have a relatively
different value every time the measuring instrument
is used. Reliability of a measurement result is said to
be reliable if its value is greater than 0.7 (Coaley,
2010).
2 METHODS
2.1 Participants
Two hundred and twenty students of the Faculty of
Psychology Universitas Sumatera Utara (Women =
181, Men = 39) were selected nonrandomly to be
involved in this study. Age ranging from 18 to 23
(average = 19.90, SD = 1.00)
2.2 Instrument
2.2.1 Hamilton Anxiety Rating Scale
(HAM-A)
HAM-A is an instrument developed to measure
anxiety through the severity of anxiety symptoms.
HAM-A is often used in clinical and research
environments. Consisting of 14 items with response
type of Likert Scale which has 5 alternative answers
from no symptoms = 0 to very heavy = 4, with the
total score indicating the severity of anxiety
experienced. Total range of score 0-56 with score
category <17 indicates mild severity, 18-24 indicates
moderate severity and 25-30 indicates severe severity
to very severe. Each item is defined using a series of
symptoms, and measures both psychic anxiety
(mental distress and psychological distress) and
physical anxiety (physical complaints related to
anxiety). This scale has been translated into:
Cantonese, French, and Spayol. This IVR version of
the measuring tool is available at Healthcare
Technology Systems.
2.2.2 Big Five Inventory
The Neurotic subscale is one of five subscales in the
Big Five Inventory (BFI). BFI is based on personality
theory of Big Five model to know the profile of
individual personality. BFI Indonesian version was
developed by Rahmawati and Maryanti (2013). The
Neurotic subscale is used to identify individual
susceptibility to psychological distress: it is easy to
experience sadness, excessive fear and anxiety, has
excessive impulse and has a maladaptive or
inappropriate coping response. This subscale consists
of 8 item using Likert response format with
alternative answer ranging from disagree = 1 to
strongly agree = 5. Total score indicates the level of
vulnerability of individual to distress. The higher the
score is interpreted that the individual has a high
susceptibility to the distress, and the lower the total
score indicates an increasingly stable individual
emotion. The reliability of neurotic subscale in
Indonesian version is 0.762 (Rahmawati, et al, 2016).
In this study, the reliability of the results measured by
Alpha Cronbach of subscale has a good criterion
which is 0.86.
2.3 Procedure
The adaptation process begins with a review of the
coexistence of anxious construct in HAM-A
(Hamilton, 1959) whether it can be used in Indonesia
or not. Phase of language adaptation is done by using
back translation method. HAM-A English version is
translated into Indonesian (translated I), then
translation result I translated back into English
(translation II). The results of translation II are
compared with the original version and analyzed to
ensure that the two forms are equivalent. At this phase
of adapting the language it was also involving 2
people who have expertise in the field of Psychology
to review the content of each item in measuring
anxiety.
ICOSTEERR 2018 - International Conference of Science, Technology, Engineering, Environmental and Ramification Researches
1546
The psychometric properties testing phase of
HAM-A uses trial data to find out whether the results
of the HAM-A measurement can reliably measure
anxiety on the respondents. Validity based on internal
structure evidence is done by confirmatory factor
analysis. Estimation of the correlation of HAM-A
was done with the neurotic personality dimension to
prove convergent validity. Testing the mean
differences in the two groups as well as the estimation
of the item difference power to ensure that HAM-A
are truly capable of distinguishing people who
experience and do not experience anxiety. The
accuracy of the measurement results of HAM-A is
known by estimating the Alpha Cronbach coefficient.
3 RESULTS
3.1 Source of Validity Proof based on
Internal Structure
The result of confirmatory factor analysis showed that
62.5% (5 of 8) model matching indexes used showed
good fit with CFI Index = 0.93, IFI = 0.93, GFI = 0.9,
NNFI = 0.91, RMSEA = 0.078, AGFI = 0.86, RFI =
0.86, NFI = 0.89. The 14th factor load is above the
good limit of 0.53 to 0.78 and all the t values are
above the limit of 1.96, moving from 8.13 to 13.57
and all positive errors. The model matching index is
presented in Table 1 and the factor load values for
each item are presented in Table 2. The reliability of
the measurement model is very good (Construct
reliability = 0.99 and Variance extracted = 0.87).
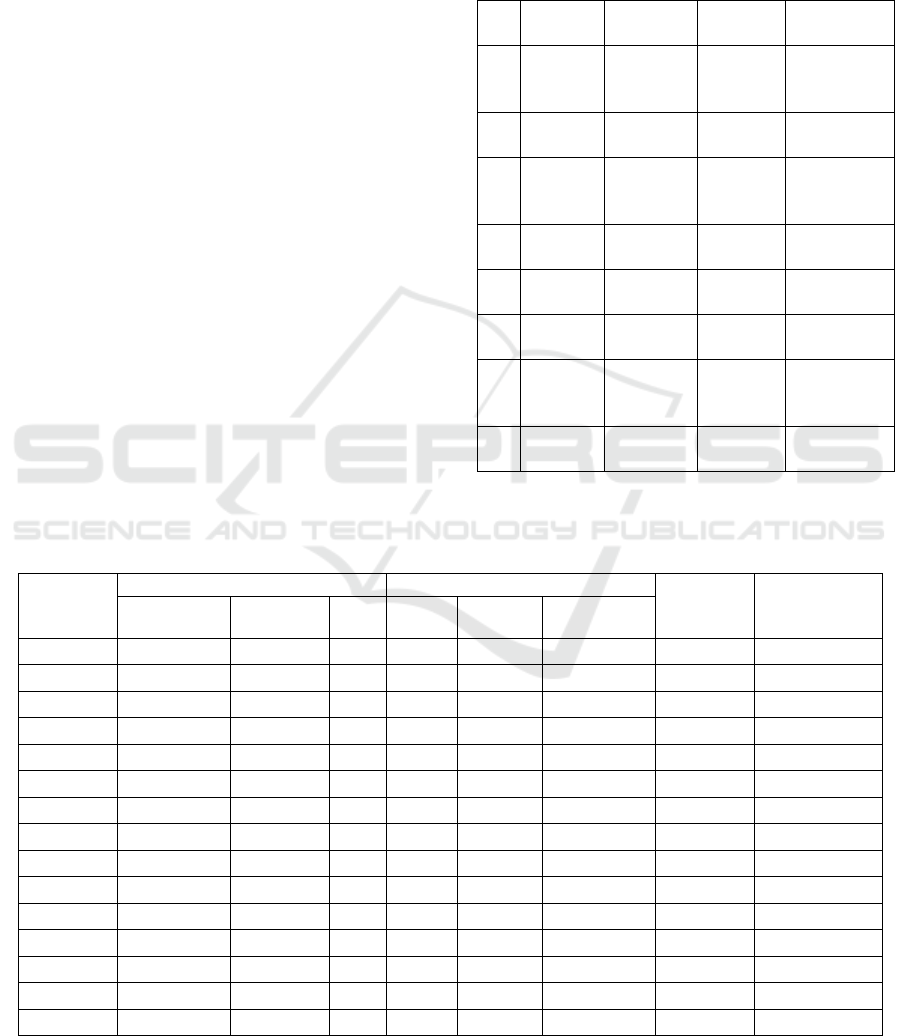
Table 1: Model Matching Index.
No Size Goodness
of Fit
Limit Explanation
1 NFI 0.89 0.80 ≤
NFI ≤
0.90
Marginal
Fit
2 NNFI 0.91 NNFI ≥
0.90
Good Fit
3 RFI 0.86 0.80 ≤
RFI ≤
0.90
Marginal
Fit
4 CFI 0.93 CFI ≥
0.90
Good Fit
5 IFI 0.93 IFI ≥
0.90
Good Fit
6 GFI 0.90 GFI ≥
0.90
Good Fit
7 AGFI 0.86 0.80 ≤
AGFI ≤
0.90
Marginal
Fit
8 RMSEA 0.078 RMSEA
≤ 0.08
Good Fit
Table 2: Characteristics of items in HAM-A.
Item CFA Test of Mean Difference
Difference
power
Reliability If
Item is
Disposed
Factor Load Value of T SE t p Mean
Difference
HAM-A - - - 34.20 0.0001 25.93 - 0.92*
item1 0.54 8.39 0.07 10.29 0.0001 1.58 0.59 0.92
item2 0.68 11.06 0.07 16.35 0.0001 2.18 0.70 0.91
item3 0.63 10.16 0.08 13.36 0.0001 2.12 0.64 0.92
item4 0.65 10.42 0.09 11.52 0.0001 2.15 0.60 0.92
item5 0.60 9.41 0.07 11.60 0.0001 1.80 0.59 0.92
item6 0.78 13.44 0.07 18.26 0.0001 2.35 0.74 0.91
item7 0.77 13.18 0.06 13.84 0.0001 1.93 0.72 0.91
item8 0.78 13.57 0.07 13.30 0.0001 1.97 0.73 0.91
item9 0.70 11.55 0.07 12.00 0.0001 1.92 0.69 0.91
item10 0.73 11.97 0.07 13.32 0.0001 1.85 0.67 0.91
item11 0.72 12.02 0.07 12.88 0.0001 1.92 0.68 0.91
item12 0.68 9.84 0.06 9.85 0.0001 1.45 0.56 0.92
item13 0.69 11.38 0.06 11.09 0.0001 1.70 0.65 0.92
item14 0.53 8.13 0.05 7.77 0.0001 1.02 0.51 0.92
*Reliability of HAM-A scale
The Accuracy of Indonesian Version of HAM-A
1547

3.2 Sources of Validity Evidence based
on Relation to Other Variables
Validity based on the relationship of other variables
is evidenced by correlating the score of HAM-A with
the personality dimension subscale of Neuroticism.
The estimation results show that the result of
measurement using HAM-A correlated significantly
with Neurotic dimension. The large correlation
coefficient is presented in table 3.
Table 3: Correlation of HAM-A and Neuroticism
scale score.
Variabel correlation p Explanation
HAM-
A*Neurotis
0.565
0.0001 Significantly
Correlated
3.3 Reliability
Estimation of reliability coefficient scale of HAM-A
with alpha cronbach is good that is 0.92. Items of
HAM-A also has discrimination power in the
excellent category according to Ebel (Azwar, 2013)
in the range 0.51 to 0.74. In addition to knowing the
ability of item and the scale of HAM-A to distinguish
individuals who are actually experiencing anxiety or
not, a mean difference analysis is performed on high
and low score groups. The results show that there is a
significant difference of mean between high and low
group on all items and scale of HAM-A, with all
differences showing the same direction.
Characteristics for each item and in total can be seen
in table 2.
4 DISCUSSION
HAM-A is a scale for measuring anxiety that has been
widely used in the context of research. HAM-A has
been translated into Cantonese, French, and
Spayol.Adaptation and testing of psychometric
characteristics of HAM-A in this study were
undertaken to ensure that the results of measurements
in Indonesia can be interpreted according to the
original purpose of its manufacture. The validity
analysis to find evidence based on the internal
structure using the data obtained from the field, shows
a good level of compatibility with the existing model.
This is indicated by more than 50% of the model
matching indexes having Good criteria. In addition,
all factor load values obtained in this analysis are
considered satisfactory (> 0.50) Thus it can be said
that all valid items contribute to anxiety
measurement.
Evidence of convergent validity by correlating
HAM-A scores and neurotic dimensions of the Big
Five Inventory shows significant results with
correlations classified as medium. It can be
interpreted that the scores obtained by using HAM-A
really measure participants' anxiety. Neurotics were
chosen as criteria, as many studies show a significant
correlation between anxiety with neurotics, among
which results were found by Johansson & Ölund
(2017) anxiety has been shown to be highly
correlated with neuroticism; neuroticism is
significantly associated with anxiety symptoms
(Daniel et al., 2016), neurotic trait represents a
tendency to experience negative emotions e.g anger,
anxiety, or depression (Kadimpati et al., 2015).
In addition to having evidence of validity based
on internal structure and relationships with other
variables, the reliability of the results of the HAM-A
measurements was found to be excellent. According
to Coaley (2010), the reliability of a measurement
result is said to be reliably if its value is greater than
0.7. When viewed from the item different power
index, all items have an acceptable value. Significant
mean differences between high and low groups in
total scores and all items show that all valid items
contribute to anxiety measurement.
5 CONCLUSIONS
Based on the analysis and review of the results it can
be concluded that the HAM-A which has been
translated into the Indonesian language has an
accurate quality measurement results to measure
anxiety. Thus this scale can be used in studies of
anxiety.
ACKNOWLEDGEMENTS
This paper is basic research scheme funded by
Universitas Sumatera Utara “Penelitian Keunggulan
Akademik (TALENTA) USU T.A USU 2018“.
REFERENCES
Amiri, M., & Ghonsooly, B., 2015. The Relationship
Between English Learning Anxiety And The Students’
Achievement On Examinations. Journal of Language
Teachingand Research, 6, 855 – 865.
ICOSTEERR 2018 - International Conference of Science, Technology, Engineering, Environmental and Ramification Researches
1548

Azwar, S., 2013.Penyusunan Skala Psikologi. Pustaka
Pelajar. Yogyakarta.
Burns, D.J., 2004. Anxiety At The Time Of The Final
Exam: Relationships With Expectations And
Performance. Journal of Education for Business, 80,
119-124.
Chapell, M. S., Blanding, Z. B., Silverstein, M. E.,
Takahashi, M., Newman, B., Gubi, A., & McCann, N.,
2005. Test Anxiety And Academic Performance In
Undergraduate And Graduate Students. Journal of
Educational Psychology, 97(2), 268-274.
Coaley, K.., 2010. An Introduction to Psychological
Assessment and Psychometrics. Sage Publication Ltd.
Daniel, J.P.,Salome, V., Peter J.N., and Carla, S., 2016.
Examining unique contributions of three
transdiagnostic vulnerability factors.Personality and
Individual Differences, Volume 94, May 2016, Pages
38-43)
Everson, H. T., Millsap, R. E., & Rodriguez, C. M., 1991.
Isolating Gender Differences In Test Anxiety: A
Confirmatory Factor Analysis Of The Test Anxiety
Inventory. Educational and Psychological
Measurement,51, 243-251.
Hamilton, Max., 1959. The Assessment of Anxiety States by
Rating. The Journal of Medical Psychology, 32, 50-55
Hancock, D. R., 2001. Effects Of Test Anxiety And
Evaluative Threat On Students' Achievement And
Motivation. The Journalof Educational Research, 94,
284-290.
Johansson, M and Ölund, A., 2017. Thinking about
thinking – a study of anxiety, neuroticism and Need for
Cognition.. Tesis. Umeå University.
Kadimpati S, Zale E.L, Hooten M.W, Ditre J.W, Warner
D.O., 2015. Associations between Neuroticism and
Depression in Relation to Catastrophizing and Pain-
Related Anxiety in Chronic Pain Patients. PLoS ONE
10(4): e0126351. doi:10.1371/journal.pone.0126351
Osterlind, S. J., 2010. Modern Measurement: Theory,
Principles, and Application of Mental Appraisal
(Second Edition). United States of America: Pearson
Education, Inc.
Schaefer, A., Matthess, H., Pfitzer, G., & Kohle, K., 2007.
Mental Health And Performance Of Medical Students
With High And Low Test Anxiety. Psychother
Psychosom Med Psychol, 57, 289-297.
Swanson, S., & Howell, C., 1996. Test Anxiety In
Adolescents With Learning Disabilities And Behavior
Disorders. ExceptionalChildren, 62, 389-397.
The Accuracy of Indonesian Version of HAM-A
1549
