
Determinants of Stock Investment Decision through Skill and
Knowledge Financial: An Analysis with Partial Least Squares
Approach
Isfenti Sadalia
1
, Fahmi Natigor Nasution
2
, Desi Astuti
1
1
Department of Management, University of Sumatera Utara, Medan, Indonesia
2
Department of Accounting, University of Sumatera Utara, Medan, Indonesia
Keywords: Investment Decision, Skill and knowledge Financial, Partial Least Squares
Abstract: This study aims to examine the factors affecting stock investment decisions through skill and knowledge
finan. variables on stock investors in the existing investment gallery at state universities in north sumatera,
expressed comprehensively with component-based structural equations, Partial Least Square (PLS). PLS is
an analytical method that is not based on many assumptions. In the PLS is not required multivariate normal
assumption, can use the scale of nominal, ordinal, interval and ratio measurements and sample size should
not be large. PLS estimates the relationship model between latent variables and latent variables with
indicators. Based on the results of the analysis obtained the conclusion that the largest total influence data are
financial capability variables to decision variables, as well as the largest direct effect of financial competence
variables to investment decisions.
1 INTRODUCTION
Investment plays an important role in driving
economic growth and employment in Indonesia. In
accordance with Law No.8 of 1995 on capital market
has a strategic position in national economic
development. Students as young people are expected
early on to have knowledge in managing their
finances in order to have a more prosperous life in the
future.
Research on the factors that influence stock
investment decisions involves several variables. The
variables used are latent variables that can not be
measured directly. This process allows the testing of
a relatively complex set of relationships
simultaneously, so that required analytical techniques
that can accommodate all the variables with either the
structural equation modeling or Structural Equation
Modeling. There are two models of structural
equations that can be applied into a research that is
Covariance Based Structural Equation Modeling
(CBSEM) and Component Based Structural Equation
Modeling or known as Partial Least Square (PLS).
Partial Least Square is an analytical method that is not
based on many assumptions such as does not have to
be multivariate normal distribution and the sample
size does not have to be large.
2 LITERATURE REVIEW
2.1 Financial Competence
Education in the English dictionary means education,
whereas according to Sugihartono (2007), education
comes from the word educating which means
nurturing and forming exercises. Financial
knowledge has a close relationship with financial
litercay or financial education. Financial knowledge
can be channeled and can be understood well through
financial education or financial literacy.
Fernandes (2014) through his research is known
that financial education becomes very important for
increasingly complex financial decisions at the
present moment, and known a close relationship
between financial education with financial literacy
and financial behavior. Later, Yoshino and Wignaraja
(2015) stated in the results of his research that
financial literacy in Asia is still very limited and can
be overcome with appropriate financial education
programs and promote financial education
Sadalia, I., Nasution, F. and Astuti, D.
Determinants of Stock Investment Decision through Skill and Knowledge Financial: An Analysis with Partial Least Squares Approach.
DOI: 10.5220/0010086415271534
In Proceedings of the International Conference of Science, Technology, Engineering, Environmental and Ramification Researches (ICOSTEERR 2018) - Research in Industry 4.0, pages
1527-1534
ISBN: 978-989-758-449-7
Copyright
c
2020 by SCITEPRESS – Science and Technology Publications, Lda. All rights reserved
1527

intensively to increase financial literacy in Asia.
Lusardi (2008) stated in his research that financial
education can improve saving habits and make better
financial decisions.
2.2 Financial Capability
Soekanto (Abdulsyani, 2007) states that social status
is the place of a general person in a society that deals
with others in his or her social environment, its
prestige, rights and obligations. Soekanto (2017)
states that the socio-economic status means the
position of an individual and family based on
economic elements. Soekanto (2017), mentions the
factors that affect one's social economy in society that
is the size of the wealth, the size of honor, and the size
of science.
Ali et.al. (2016) stated in the results of his
research that the economic background of parents,
especially the work of parents does not affect the
financial literacy of students. While Fowdar (2007)
stated in the results of his research that the students'
financial literacy is influenced by the background of
parents and family. Gumus and Dayioglu (2015)
stated that their socioeconomic status and
demographic factors influence investors' perceptions
of risk with different background income levels, it is
also known that the age-gender-level education-
income-profession of investors influences the
perceptions of risk and decision investment taken.
2.3 Skill and Knowledge Financial
Literacy comes from English literacy which means
the ability to read and write. The concept of literacy
is not only synonymous with the literacy of a person,
but also against the technology of computer literacy,
in the financial field known as financial literacy.
Some definitions of financial literacy are:
1) Financial Literacy is the mastery of knowledge
and ability (skills) to make rational economic
and financial decisions with full confidence and
competence (Working Group on Financial
Literacy, 2010).
2) A combination of awareness, knowledge, skills,
attitudes and behavior necessary to make sound
financial decisions and achieve individual
financial well-being (INFE-OECD, 2011). As
part of the science of finance, financial literacy
is a person's ability in personal finance that
includes money management, spending and
credit, savings and investments (Hananto,
2011).
Ali (2013) stated in his research results that
financial literacy provides the knowledge and ability
to make good decisions, good decision-making
ability will make the customer able to achieve
prosperity.
2.4 Decision of Stock Investments
Tandelilin (2010) states that investment is a
commitment to a number of funds or other resources
that are done at this time, with the aim of obtaining
some benefits in the future. Investment decisions as
decisions that have an important role for financial
management, and also have a big role in the
development / growth of the business or even the
development of a country. Meanwhile, according to
Manurung (2012) investing is basically 'buying' an
asset that is expected in the future can be 'resold' with
a higher value.Some reasons someone make an
investment decision (Tandelilin, 2010):
1) A worthy life in the future
The beginning of investment is excess funds
from investors. The excess funds come from
personal funds and loan funds. These
advantages are then invested for future benefits.
2) Reducing inflationary pressure
Investing in the ownership of a company or
other object impacts the investor's self-evasion
from the risk of impairment of property or
property rights due to the influence of inflation.
3) The urge to save on taxes.
Provision of tax facilities to people who invest
in certain business sectors encourage the growth
of investment in the community.
An investment plan needs to be thoroughly analyzed.
An investment plan analysis is basically a study of
whether or not a plan can be successfully
implemented.
2.5 Partial Least Square (PLS)
In the PLS analysis it is necessary to know whether
the data meets the requirements for the SEM PLS
model. Some characteristics that need to be
considered include, sample size, shape of data
distribution, missing values, and measurement scale.
Researchers should pay attention to how much of the
missing data is in the data. In addition, the
measurement of endogenous latent variables should
not use a nominal scale so that the model can be
identified.
Hair et al. (2013) states that the minimum sample
size guidance in SEM-PLS analysis is equal to or
greater (≥) of the following conditions:
ICOSTEERR 2018 - International Conference of Science, Technology, Engineering, Environmental and Ramification Researches
1528

1) 10 times the largest number of formative
indicators used to measure a construct.
2) 10 times of the largest number of structural paths
leading to a particular construct.
The guideline is called the 10 X rule (10 time rule of
thumb) which is practically 10X of the maximum
number of arrows (paths) that pertain to a latent
variable in the PLS model.
This guideline is still rough guidance so that Hair et
al. (2014) suggests researchers to use the Cohen
(1992) approach that considers statistical power and
effect size when determining the minimum sample
size. As preview at Table 1, the determination of the
sample size using the Cohen (1992) approach in
Haryono and Wardoyo (2013) if the maximum
number of arrows on a construct is 10, the 5%
significance level and the minimum R-square 0.25 the
minimum sample size is 91.
Table 1. Sample Size Determination Table In PLS
Source: Cohen 1992 (in Haryono and Wardoyo, 2013)
Data analysis technique
The data collected in this research will be analyzed
quantitatively by using SEM - Partial Least Square
(PLS) method as follows:
1) Estimation Parameter SEM - Partial Least
Square (PLS)
The path analysis model of all latent variables in
the PLS consists of three sets of relationships:
a. Inner model that specifies the relationship
between latent variables (structural
model).
b. Outer model that specifies the relationship
between latent variables with indicators or
variables manifestasinya (measurement
model).
c. Weight relation, to assign a score or
calculate latent variable data.
2) Steps of the model equation model of structural
equations with SEM-Partial Least Square (PLS)
In this research, data analysis on SEM-PLS will
use SmartPLS software support.
a. Obtains concept-based models and
theories to design structural models
(relationships among latent variables) and
their measurement models, ie relations
between indicators with latent variables.
b. Creating a path diagram (diagram path)
that explains the pattern of relationship
between latent variables with the indicator.
c. Convert the path diagram into the
equation.
d. Conduct goodness of fit evaluation by
evaluation of measurement model (outer
model) by looking at validity and
reliability. If the measurement model is
valid and reliable then it can be done next
step that is evaluation of structural model.
If not, then it should re-construct the path
diagram.
e. Model interpretation.
3 RESEARCH METHODOLOGY
This study uses primary data. Primary data was
obtained from questionnaires distributed by email to
all stock investors in investment gallery at public
university in North Sumatra in 2018 (University of
Sumatera Utara, State University of Medan, UINSU,
Medan State Polytechnic). The sample size used is
100. The sampling technique used is non-probability
sampling with accidental sampling, ie the sample is
selected based on the ease in obtaining the required
data.
Determinants of Stock Investment Decision through Skill and Knowledge Financial: An Analysis with Partial Least Squares Approach
1529
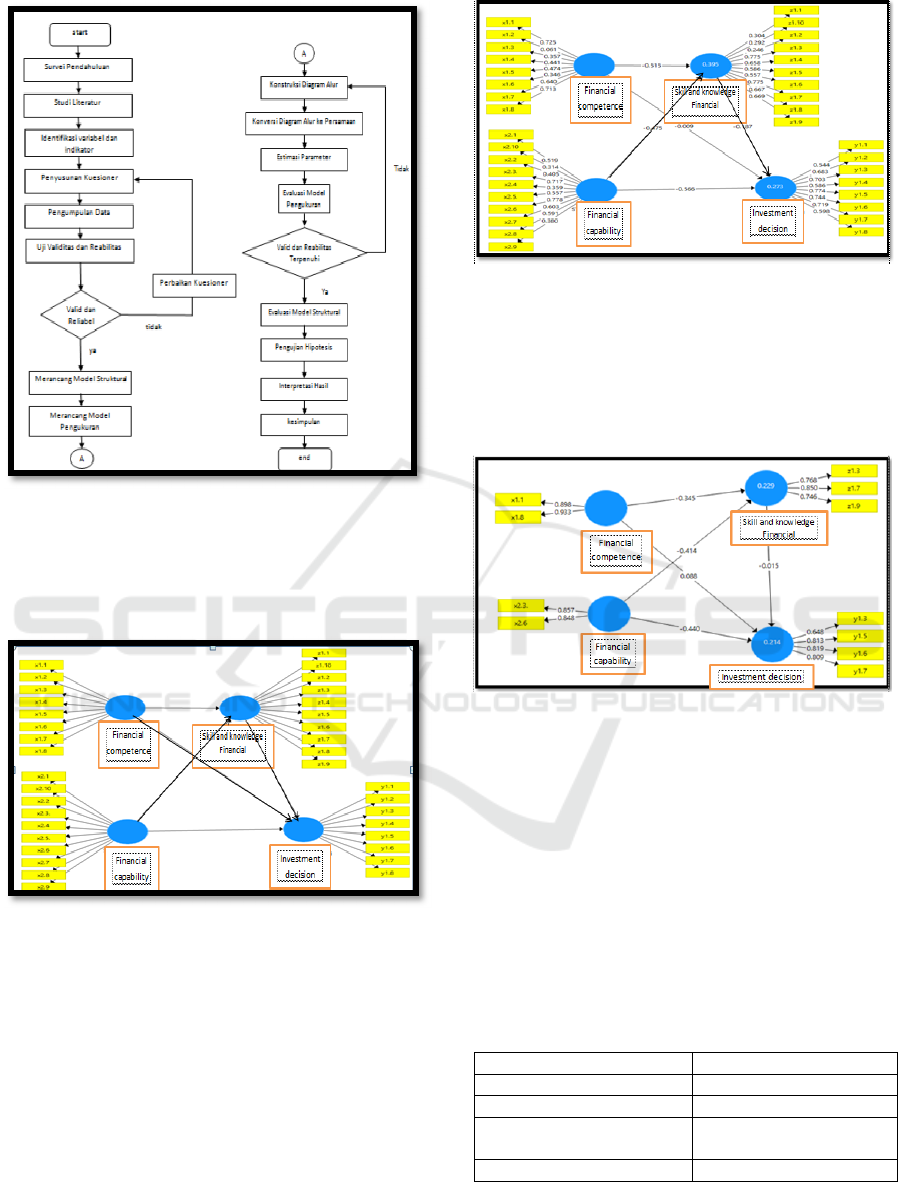
Figure 1. Flow Chart of research
4 RESULT AND DISCUSSION
4.1.Convergent Validity
Figure 2. Theoretical Model Development Diagram
Source: PLS Output of research data (2018)
Convergent validity with reflexive indicator
is valid if it has loading value with latent variable to
be measured> 0.70, if one indicator has loading value
<0.70 then the indicator should be discarded (drop)
because it will indicate that indicator is not good
enough to measure the latent variables appropriately
(Ghozali and Latan, 2015). Here is the output of
structural equation path diagram of PLS using
SMART-PLS software.
Figure 3. Output Diagram
Source: PLS Output of research data (2018)
Indicators whose value loading factor <0.70 is
derived from the model because it is considered less
able to measure well the construct variable. The
model that formed after the issued several invalid
indicators are as follows:
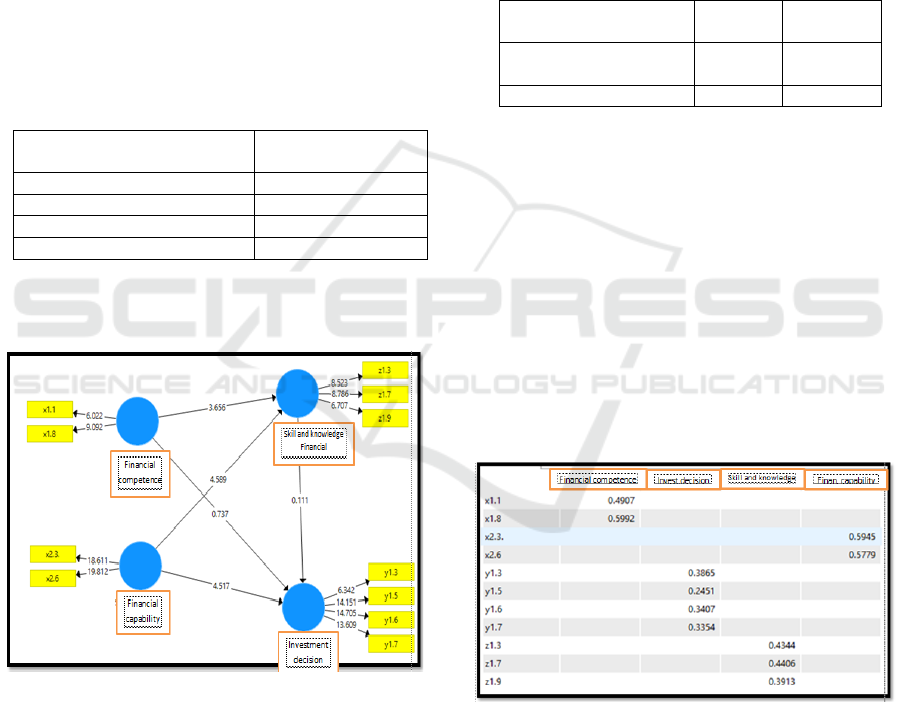
Figure 4. Modified Output Diagram
Source: PLS Output of research data (2018)
4.2. Test Validity and Reliability
In this research, validity test and test result
with all values of r> r-table (with df = 30-2 = 28 and
5% significance, that is 0,374) so it can be concluded
that all items of statement are valid. Next Test
reliability by looking at Alpha Cronbach value. A
latent variable is said to be reliably if the value is>
0.6. Obtained information that all variables have
values> 0.6 which means all variables are very
reliable. Obtained latent variable score as follows:
Table 2. Value Composite Reliability
Reliabilitas Composite
Financial com
p
etence 0,912
Financial ca
p
abilit
y
0,842
Skill and knowledge
financial
0,832
Investment decision 0,857
Source: PLS Output of research data (2018)
ICOSTEERR 2018 - International Conference of Science, Technology, Engineering, Environmental and Ramification Researches
1530
Based on Table 2. Composite Reliability value
obtained information that the value of Composite
Reliability on all blocks of indicators has met the
assumption Composite Reliability is greater than 0.6
means that the indicator blocks in each latent variable
has a high consistency.
Discriminant validity with reflexive
indicator can be seen on cross loading between
indicator with its construct, indicator correlation
value to its construct must be bigger than other
construct value. Another method of assessing
discriminant validity is to use Average Variance
Extracted (AVE) which has a construct value> 0.50
specified as a good model (Ghozali and Latan, 2015).
Visible on the AVE table the terms of construct
value> 0.50 have been met, so it can be said that the
model is a good model.
Table3. Average Variance Extracted (AVE)
Average Variance
Extracted
(
AVE
)
Financial competence 0,839
Financial capabilit
y
0,727
Skill and knowled
g
e financial 0,623
Investment decision 0,601
Source: PLS Output of research data (2018)
4.3 Path Significance Test
Figure 5. Bootstraping Structural Model
Source: PLS Output of research data (2018)
The coefficient value of the structural model is said
to be significant if the t-count> t-table is 1.96 (1.96 is
the t-table value in the 95% confidence level). All the
indicators in Figure 5 look significant on the
condition of t-value> 1.96.
4.4 R-Square
Inner model or structural model testing is done to see
the relationship between construct, significance value
and R-square of the research model. The structural
model is evaluated by using R-square for the t test
dependent construct as well as the significance of the
structural path parameter coefficients.
To assess the model with PLS begins by looking at R-
square for each dependent latent variable. The
following table is the result of R-square estimation.
Table 4. R-Square
Source: PLS Output of research data (2018)
Q-Square predictive relevance for the structural
model, measuring how well the observation value is
generated by the model and also its parameter
estimation. The Q-square value > 0 indicates the
model has predictive relevance otherwise if the Q-
square value ≤ 0 shows the model lacking predictive
relevance.
Q-Square predictive relevance
= 1- (1-Rsqure1)(1-Rsquare2)
= 1 – (0,771)(0,786)
= 1 – 0,606 = 0,394
Table5. Outer Model (Weights of Loading)
Source: PLS Output of research data (2018)
Table outer model describes the relationship between
latent variables with the indicator that is:
1) X1.1 (gain knowledge of various products /
financial services) has a relationship of 0.4907
to financial competence
R-
Square
Adj.
R-Square
Skill and knowledge
financial
0,229 0,213
Investment Decision 0,214 0,190
Determinants of Stock Investment Decision through Skill and Knowledge Financial: An Analysis with Partial Least Squares Approach
1531
2) X1.8 (gain skills in managing benefits, risks,
cost of products / financial services) has a
relationship of 0.5992 to financial competence
3) X2.3 (work) has a relationship of 0.5945 to
financial capability
4) X2.6 (income) has a relationship of 0.5779 to
financial capability
5) Y1.3 (understand personal financial condition)
has a relationship of 0.3865 to the investment
decision
6) Y1.5 (understand financial records) has a
relationship of 0.2451 to the investment
decision
7) Y1.6 (understand financial records) has a
relationship of 0.3407 to the investment
decision
8) Y1.7 (understand the time value of money) has
a relationship of 0.3354 to the investment
decision
9) Z1.3 (risk) has a relationship of 0.4344 to skill
and knowledge financial
10) Z1.7 (portfolio analysis) has a relationship of
0.4406 to skill and knowledge financial
11) Z1.9 (risk-level relationship with return) has a
relationship of 0.3913 against skill and
knowledge financial
Based on that interpretation, it can be
analyzed that the overall view has the greatest value
among all relationships ie x1.8 (gain skills in
managing benefits, risks, cost of products / financial
services) to the financial competence variable of
0.5992.
The fourth indicator (obtaining skills in managing the
risk benefits, product cost / financial services) of this
financial competence variable is a variable that must
be done so that the financial competence process on
the investor can run well. Based on the above
information it can be said that all latent variables in
this study have a relationship less than 50% which
means all latent variables in this study have a weak
relationship / small.
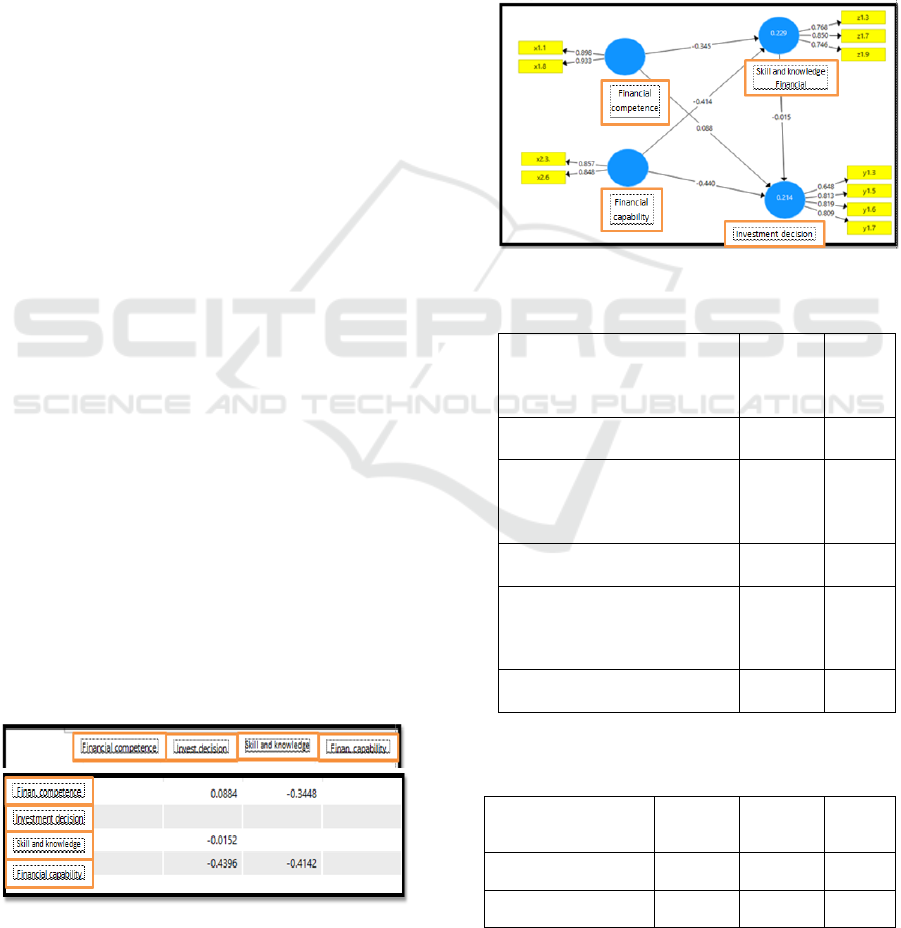
Table 7. Path Coefficient
Source: PLS Output of research data (2018)
Table path coefficient explain the influence of latent
variables are:
1) Financial competence has the effect of 0.0884
on investment decisions
2) Financial competence has a -0.3448 effect on
skill and knowledge financial
3) Financial capability has a -0.4396 influence on
investment decisions
4) Financial capability has a -0.4142 influence on
skill and knowledge financial
5) Skill and knowledge financial has an influence
of -0,0152 against investment decision
Mapping the Influence between Variables
Figure 6. Inflation Diagram Variable Variables
Source: PLS Output of research data (2018)
Table 8. Intergroup Influence Mapping
Direct
influenc
e
Indire
ct
influe
nce
f. competenceskill and
knowled
g
e f.
Yes No
f. competenceDecision Yes Yes
(via
condit
ion)
finan.capabilityskill and
knowled
g
e f.
Yes No
finan.capabilityDecision Yes Yes
(via
condit
ion
)
skill and knowledge
f.Decision
Yes No
Source: PLS Output of research data (2018)
Table 9. Direct Influence, Indirect Effect, and Total
Influence
Direct
influence
Indirect
influence
Total
inflenc
e
f. competenceskill
and knowledge f.
-0,345 No -0,345
f.competenceDecisi
on
0,088 (-0,345)
x(-0,015)
0,005
ICOSTEERR 2018 - International Conference of Science, Technology, Engineering, Environmental and Ramification Researches
1532

=
0,005175
finan.capabilityskill
and knowledge f.
-0,414 No -0,414
finan.capabilityDeci
sion
-0,440 (-0,414)
x (-
0,015) =
0,00621
0,006
skill and knowledge
f.Decision
-0,015 No -0,015
Source: PLS Output of research data (2018)
In the table looks the largest total data influence of
financial capability variables to decision variables.
The biggest direct effect of financial competence
variables to investment decisions.
5 CONCLUSION
5.1 Conclusion
Based on the exposure described in the analysis and
discussion chapter, it can be concluded that:
1. The largest total influence data is the finan.
capability variable to the decision variable.
2. The largest direct effect of financial competence
variables to investment decisions.
5.2 Suggestion
Statistically, the number of results obtained in this
study is relatively small because it is only limited to
the theory, so need more deepening of each factor by
doing individual research and also required other
comparator factors.
ACKNOWLEDGEMENTS
The authors gratefully acknowledge that the present
research is supported by Universitas Sumatera Utara
in accordance with the contract of TALENTA
Universitas Sumatera Utara Fiscal Year 2018 No.
2590/UN5.1.R/PPM/2018 dated March 16, 2018.
REFERENCES
Abdulsyani. 2007. Sociology of Theory and Applied
Sciences.Jakarta: PT Bumi Aksara.
Ali, Suhaimi. 2013. Skill and knowledge finan. in Malaysia:
Issues and Status Update Bank Negara Malaysia.
International Seminar on Financial competence and
Retirement Saving. Kuala Lumpur.
Ali et.al. 2016. The Skill and knowledge finan. of Young
People: Socio Economic Status, Language Background,
and The Rural urban Chasm. Australian and
International Journal of Rural Education. Vol.26 (1), pp
54-56.
Antwi, S., E. F. E. A. Mills, and X. Zhao. 2012. Capital
Structure and Firm Value: Empirical Evidence from
Ghana. International Journal of Business and Social
Science Vol.3 (22), pp 103-111.
Ambuehl,Sandro, B. Douglas Bernheim, and Annamaria
Lusardi. 2014. Financial Education,
Financialcompetence, And Consumer Welfare.
Working Paper Series.
Astuti, Desi. 2018. Determinants Of Stock Investment
Decisions Through Financial Literacy And Risk
Perception. Dissertation.
Besley, S. and E. F. Brigham. 2009. Principle of Finance.
4th ed. South-Western Cengage Learning. United
States.
Brigham, E. F. and J. F. Houston. 2001. Financial
Management. Eighth Edition. Erland. Jakarta.
Cole, Shawn. And Gauri Kartini Shastry. 2007. If You Are
So Smart, Why Are not You Rich?, The Effects of
Education, Skill and knowledge finan. and Cognitive
Ability on Financial Market Participation. Working
Paper. Harvard Business School and Univeristy of
Virginia.
Fernandes, Lynch Jr.Netemayer. 2014. Skill and knowledge
finan., Financial competence, and Downstream
Financial Behaviors. Management Science. Vol.60 (8),
pp:1861-1883.
Fowdar. 2007. Skill and knowledge finan.: Evidance from
Mauritius. Mauritius Research Council.
Gumus and Dayioglu. 2015. An Analysis on The Socio
Economic and Demographic Factors That Have an
Effect on The Risk of Taking Preferences of Personal
Investors. International Journal of Economics and
Financial Issues. Vol.5 (1),pp: 136-147. ISSN: 2146-
4138.
Ghozali, I. 2008. Structural Equation Model: Concepts and
application of Amos 16.0 program. Semarang: BP
University Diponegoro.
Ghozali, I. and H. Latan. 2015. Partial Least Squares:
Concepts, Techniques and Applications Using
SmartPLS 3.0 Program. Diponegoro University
Publishing Agency. Semarang.
Hair, J.F et al. 2014. A Primer On Partial Least Squares
Structural Equation Modeling (PLS-SEM). United
States of America: SAGE.
Hananto, Ligwina. 2011. For a Strong Indonesia: 100 Steps
to Not Poor. Literati: Jakarta
Hardjosoedarmo. 2004. Total Quality Management.
Yogyakarta: Andi
Haryono, S. & Wardoyo, P. 2013. Structural Equation
Modeling (SEM) for Management Research. Jakarta:
PT Intermedia Personnel Utama Jakarta.
Lusardi, Annamaria. 2008. Skill and knowledge finan.: An
Essential Tool for Informed Consumer Choice ?.
Working Paper No. 14084. JEL No.D14. National
Bureau of Economic Research.
Determinants of Stock Investment Decision through Skill and Knowledge Financial: An Analysis with Partial Least Squares Approach
1533

Manurung, A.H. 2012. Investment Theory: Concepts and
Empirical. PT Adler Manurung Press
OECD, INFE. 2011. "Measuring Skill and knowledge
finan.: Questionnaire and Guidance Notes for
Conducting an Internationally Comparable Survey of
Skill and knowledge finan.".
Soekanto, Soerjono. 2007. Sociology An Introduction.
Jakarta: PT Raja Grafindo.
Sugihartono, et al. 2007. Educational Psychology.
Yogyakarta: UNY Press
Tandelilin, Eduardus. 2010. Portfolio and Investment.
Yogyakarta: Kanisius
Trujillo, G.S. PLS Path Modeling with R. Berkeley:
Trowchez Editions.
UU No.8 Year 1995, About Capital Market
Weston, J. F. and T. E. Copeland. 2008. Financial
Management. Ninth Edition. Bina Aksara. Jakarta.
Working Group on Skill and knowledge finan.. 2010. "A
Sound on Investment" Skill and knowledge finan.
Education in Ontario Schools.
www.financialliteracy.eng was downloaded in June
2018.
Yoshino, Morgan. And Wignaraja. 2015. Financial
competence in Asia: Assessment and Recomendations.
ADBI Working Paper. No 534.
ICOSTEERR 2018 - International Conference of Science, Technology, Engineering, Environmental and Ramification Researches
1534
