
Quality Control on Flour Rice with Statistical Quality Control (SQC)
Method and Taguchi Method
Nurhayati Sembiring
1
, Elisabeth Ginting
1
and Sudikse Inggrid
1
1
Department of Industrial Engineering, Faculty of Engineering, Universitas Sumatera Utara , Jl. Almamater Campus
Universitas Sumatera Utara, Medan 20155
Keywords: Statistical Quality Control, Taguchi Method, Optimum, Quality Control, Method.
Abstract: This research was conducted on manufacturing companies engaged in the food industry. The production
process in the company applies the make to stock system. It produces rice flour dan sticky rice flour. Rice
flour is the most popular according to the market. Many defective products that arise during the flour
production process are due to product quality not meeting company standards. The company's daily rice
flour target can be reduced due to the high number of defective products produced. Company standard
determines the quality of rice flour where the product does not meet the perceived quality is not good. The
purpose of this research is to control the quality of rice flour and reduce the number of defects in rice flour.
Taguchi method is one methods that can be used to make improvements. The results of the Taguchi method
show that the optimum level of ash defects of more than 1% is 192 rpm milling spindle speed, 2.5 hours
of rice immersion duration and 197 ° C temperature. Optimum level for crude fiber defects consists of
spindle speed of milling machine is 179 rpm , the duration of soaking rice is 2.5 hours and the counting
process for 1 hour. Application of the Taguchi method, the amount of rice flour that is not suitable also
decreases because ash content reduces the average defect from 5.3 kg / day to 4.89 kg and for crude fiber
from 5kg / day to 4.61 kg.
1 INTRODUCTION
Statistical Quality Control (SQC) and Taguchi
method have been recognized as an effective
approach to process monitoring and diagnosis to
control the quality characteristics of methods,
machines, products, equipment for both companies
and operators (Srinivasan, 2011).
Statistical quality control (SQC) is divided into
product and process control. The quality of the
product can be control through the product and
process control in any manufacturing industry and the
product control has to perform when the product is in
finished mode.
Product control is a technique that is just as
important as process control in the field of statistical
quality control to maintain product quality. However,
in product control, sampling plan for attributes and
variables are available but sampling plan for attribute
is easy to perform in any industry or manufacturing
unit (Kumar, 2018).
Taguchi uses the delineation of experiments to
determine an ideal configuration for the parameters of
the process, as well as, to analyze the existing
interactions between the controllable factors (Souza,
2018).
SPC is an optimization philosophy concerned
with continuous process improvements, using a
collection of (statistical) tools for data and process
analysis making inferences about process behavior
(Chede, 2016).
The process of producing rice flour consists of
eight work stations namely, the outpouring, storage,
washing, grated, refinement, drying, filtering and
packaging. In many companies there is rice flour
whose quality does not meet company quality
standards.
Disability that occurs in rice flour is moisture
content of more than 1%, fiber is still rough and ash
content more than 1%. During the period January
2016 to January 2017 has an average of 22.72% /
month, so the company needs to do the control quality
so that the future will not harm the company either
materially or non-material.
Research focuses on the quality of rice flour to
reduce the number of rejects in the company. The
Sembiring, N., Ginting, E. and Ingrid, S.
Quality Control on Flour Rice with Statistical Quality Control (SQC) Method and Taguchi Method.
DOI: 10.5220/0010084402670272
In Proceedings of the International Conference of Science, Technology, Engineering, Environmental and Ramification Researches (ICOSTEERR 2018) - Research in Industry 4.0, pages
267-272
ISBN: 978-989-758-449-7
Copyright
c
2020 by SCITEPRESS – Science and Technology Publications, Lda. All rights reserved
267
research was conducted quality control by using
statistical quality control (sic) method and Taguchi
method.
The result of this research is to know the number
of rejects that accumulate on the production floor and
to know the main cause of the rejects. And if
occurred, a plan must be devised to improve the
production then that plan must be put into action
(Qasim, 2014).
2 RESEARCH METHODS
The type of research is a type of experimental
research, i.e. which is a study that aims to investigate
the causal relationship and how many relationships
are by imposing treatment on one or more
experimental groups and comparing the results with
one or more control groups or groups that are not
subject to treatment (Paradis, 2016).
The results of this study are expected to minimize
defects in rice flour products. The object of research
observed is rice flour, which is about the quality of
rice flour that does not meet the specification or
standard and categorized a defect product.
Data collection methods used in this study are
through direct observation and interviews with
companies (Johnston, 2014). The Data processing
methods used in this study is (Besterfield, 1998):
1. Identification of factors that cause the deviation of
rice flour quality,
2. Determination of the number of levels and factor
level values for the accuracy of the experiment
3. Calculating the number of degrees of freedom, to
know how many minimum experiments
performed.
4. Selection of appropriate orthogonal matrices
depended on the value of factor and expected
interaction and the level value of each factor.
5. Implementation the Taguchi Method
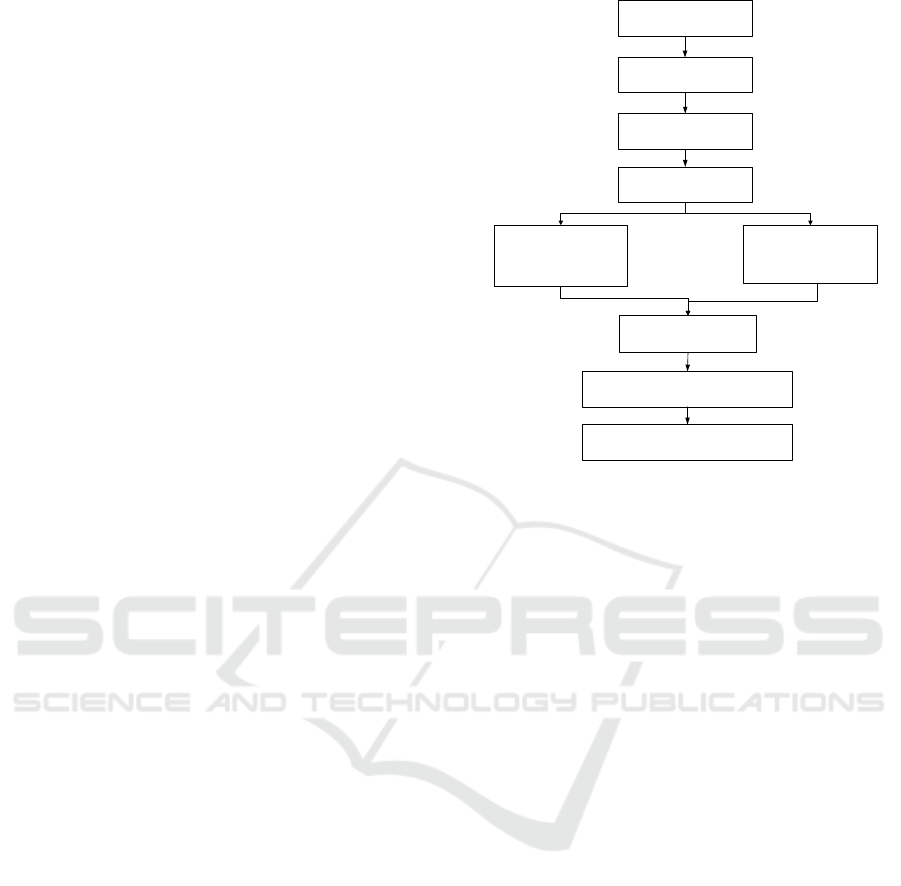
This research stage can be explained briefly through
block diagrams. The Block diagram of this research
can be seen in Figure 1.
Goal Setting
Data collect ion
Primary Data
-Interviews
- Rice Data
Data processing
-SQC
-Taguchi
Problem Solving Analysis
Conclusions and recommendations
Problem Formulation
Secondary Data
- Product Defects Data
- Company History
- A general description of the
company
Problem Identification
Figure 1. Block Diagram of Research.
3 RESULTS AND DISCUSSION
3.1 Quality Control Tools
The Method used to maintain standards in
manufacturing products is by testing sample from
output to specification (
Neuburger, 2017). This quality
control tool is in charge of controlling the quality of
statistical to find out the quality data of rice flour that
is still within the control limits. The results of the
quality control tools produced are as follows:
1. Map Control
Control charts are used to see if the proportion of
ash defects in homogenized rice flour or not
(Blitzkow,2013). In this study map, c is used
because the disability that occurs in rice flour is in
the form of attribute data (Ahme, 2011). The result
of the control chart on the type of ash disability (>
1%) and fiber are still rough is that all data is in
control.
2. The Cause and Effect Diagram
This diagram is used to determine the causes of
rice flour in detail (Liliana, 2016). The result of
causes and effect diagrams for ash disability are
some factors causing disability such as human
factors, machinery, methods, materials and
environment (Belouafa, 2017). And the main
factor is the speed the rotary grinding machine,
drying temperature and long immersion of rice.
The cause and effect diagram for fiber defects is
ICOSTEERR 2018 - International Conference of Science, Technology, Engineering, Environmental and Ramification Researches
268
still rough due to several factors such as humans,
machine, materials, and methods. The main factors
that cause are the speed of rotary grinding
machine, the process of dissolution and the long
immersion of rice.
3.2 Identification of Causes of Rice
Quality Diversity
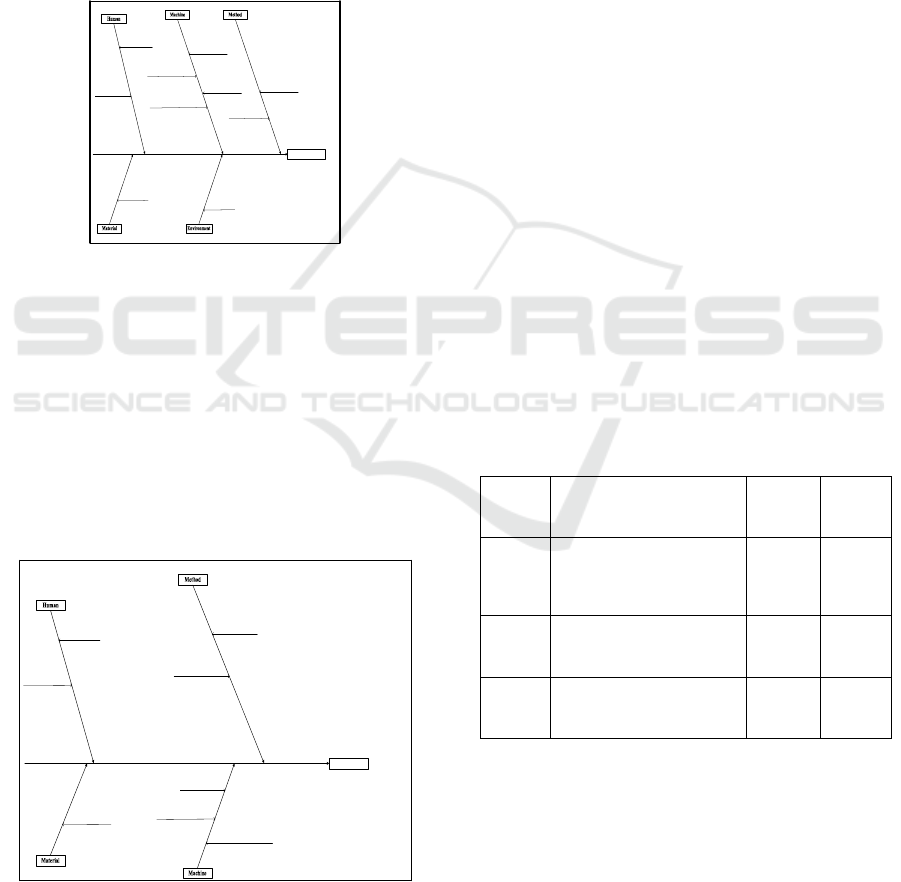
The cause of rice quality drift irregularities can be
seen in the following figure 2.
Ash Content (>1%)
The quality of rice is not good
Lacking to keep working
environment clean
Not filtered on flour
machine all over the dust
and other debris
Rolling speed of the grinding
machine is too fast
Maintenance is not good
Not Thorough While
Working
Working Environment is dirty
Cleanliness of storage tanks
Rice immersion duration
Drying Temperature
Figure 2. Diagram of cause as a result of Ash Content (>
1%).
Figure 2 shows that the cause of ash disability (> 1%)
is the human, machine, method, environment, and
material factor.
Based on the results of the way with that the main
factor is the machine, namely the rotational speed of
the milling machine, the duration of rice immersion
and the drying temperature. For the factors causing
irregularities in the fiber is still rough can be seen in
Figure 3.
Fiber Still Rough
Characteristics of different rice
Less experienced
Immediate rice immersion
time
Maintenance is not good
Not Thorough While
Working
There is rice that is not
completely dissolve d by a
scar
The process of dissolution is
too fast
Rolling speed of the grinding
machine is too fast
Figure 3. Diagram of Causes of Fiber Still Rough.
Figure 3 shows that the cause of fiber defects is still
rough is the human factor, machine, method, and
material.
Based on the results of the interview with the
company that the main factor is the machine, the
rotational speed of the milling machine, the duration
of rice immersion and the dissolution process.
3.3 Determining the Number of Levels
and Level Values
Determining the number of important levels means
for the accuracy of the experimental results (Lamont,
2015). The more levels that are studied the
experimental results will be more researched because
the data obtained more. Determination of this level is
done on the following considerations:
1. The value of each level is within the range set by
the company.
2. Point levels are indicating extreme values.
3. The level can still be handled by the existing
process technology.
Level determination for ash content (>1%) can be
seen in Table 1. The level determination for fiber is
still rough can be seen in Table 2.
Table 1. Determining the Number of Levels and Ash Levels
(> 1%).
Num Control Factor
Level
1
Level
2
A
Machine Play Speed
Milling
179
rpm
192
rpm
B Old Immersion of Rice
2
hours
2,5
hours
C
The process of
dissolution
187
o
C 197
o
C
Quality Control on Flour Rice with Statistical Quality Control (SQC) Method and Taguchi Method
269
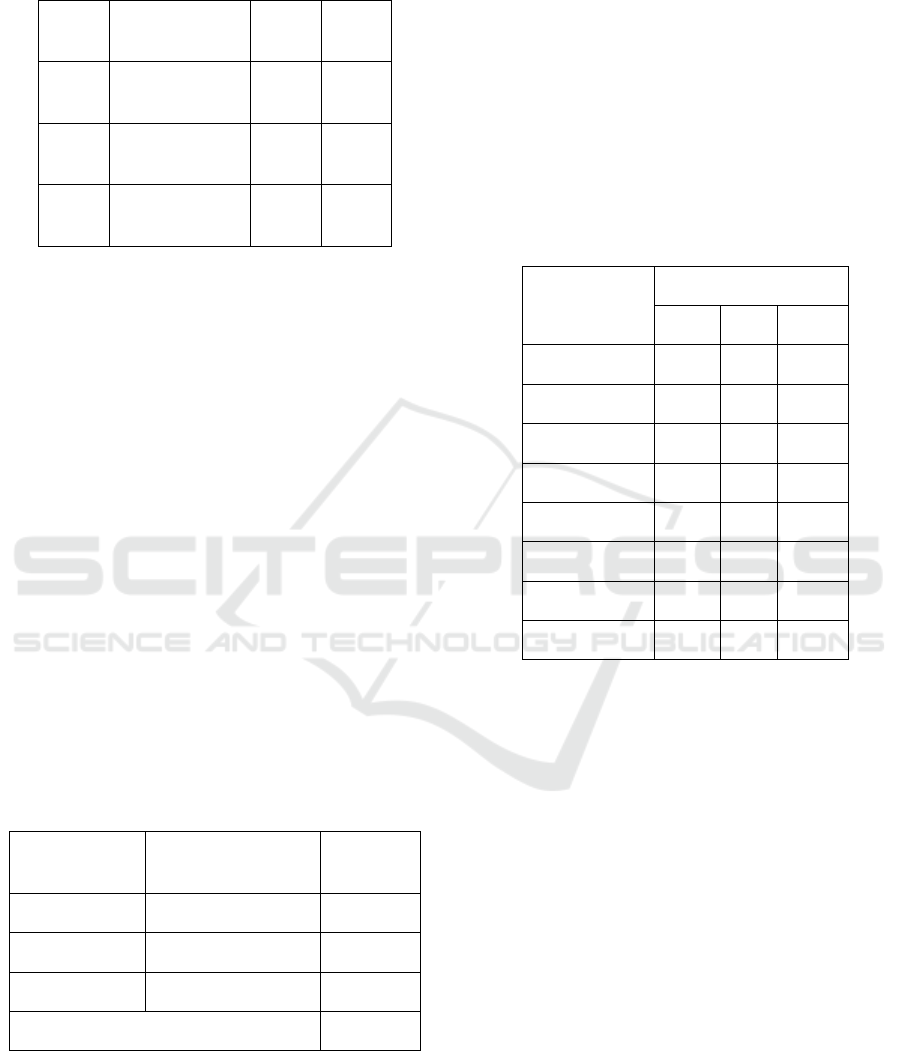
Table 2. Determination of Number Level and Fiber Level
Levels Still Rough.
Num Control Factor
Level
1
Level
2
A
Machine Play
Speed Milling
179
rpm
192
rpm
B
Old Immersion
of Rice
2
hours
2,5
hours
C
The process of
dissolution
1
hours
2
hours
3.4 Calculation of the Number of
Degrees of Freedom
The calculation of degrees of freedom is done to
calculate the minimum amount of research that must
be done to investigate the observed factors
(
Krishankant, 2012).
The computation of degrees of freedom and the
proposed combination will later affect the selection in
the orthogonal matrix table.
V = Number of Levels – 1
In this study, the degrees of freedom for each
type of disability is the same:
1. Factor A = 2 levels
2. Factor B = 2 levels
3. Factor C = 2 levels
Calculation of degrees of freedom can be seen in
Table 3.
Table 3. Calculation of Degrees of Freedom.
Control
Factor
Degrees Free (DB) Total
A 2-1 1
B 2-1 1
C 2-1 1
TOTAL 3
3.5 Selection of Orthogonal Matrices
In selecting an appropriate orthogonal matrix, an
equation of orthogonal matrices is required which
presents the number of factors, the number of levels
and the number of observations made. The general
form of the orthogonal matrix is La (bc).
The orthogonal matrix used in this study was L8
(23). The arrangement of
orthogonal matrix L8
(23) can be seen in Table 4.
Table 4. Orthogonal Array Matrices.
Experiments
Column / Factor
1 2 3
1 1 1 1
2 1 1 2
3 1 2 1
4 1 2 2
5 2 1 1
6 2 1 2
7 2 2 1
8 2 2 2
3.6 Implementation of Taguchi Method
The Taguchi method is used to investigate the
interaction between factor and factor level in the
quality of rice flour. Characteristics used are smaller
the better (Cheng, 2016
).
Calculation of confirmatory experiments using
factor and factor level that has been determined to
produce optimal condition and done as many as 6
times experiment by calculating the average value of
flour and the variability of rice flour. (Amirul 2016)
The results of the Taguchi experiment can be seen in
Table 4
.
ICOSTEERR 2018 - International Conference of Science, Technology, Engineering, Environmental and Ramification Researches
270
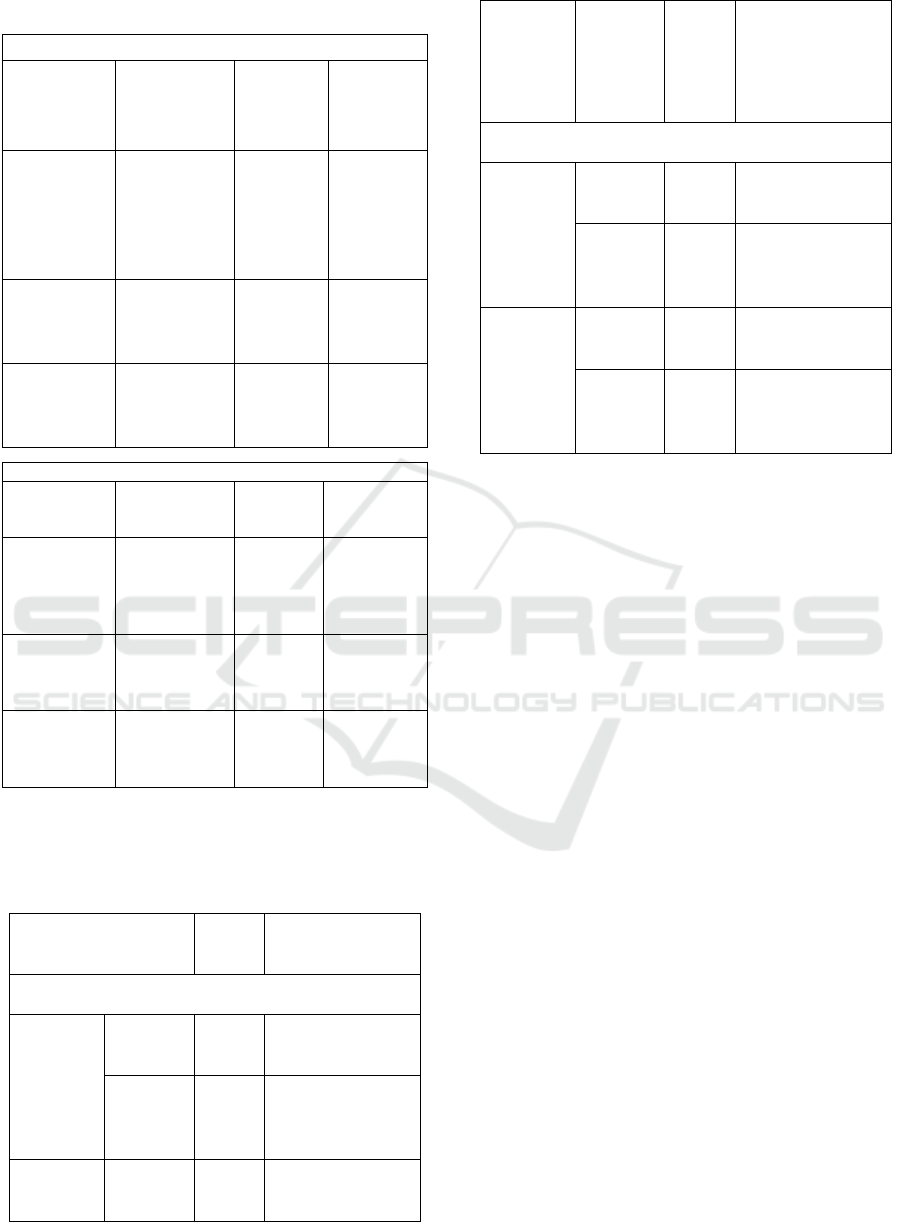
Table 4. Optimal Level Result of Taguchi Experiment.
Ash Content (>1%)
Factor
Percent
Contributio
n (%)
Optimu
m Level
Value of
Optimum
Level
Rotating
Speed of
Milling
Machine
(A)
36,30 2 192 rpm
Lama Old
Immersion
of Rice (B)
- 2 2,5 jam
Drying
Temperatu
re (C)
11,85 2 197
o
C
Fiber Still Rough
Factor
Percent
Contribution
(%)
Optimum
Level
Value of
Optimum
Level
Rotating
Speed of
Milling
Machine (A)
- 1 179 rpm
Lama Old
Immersion
of Rice (B)
16,17 2 2,5 jam
Drying
Temperatur
e (C)
26,73 1 1 jam
The interpretation results for the calculation of the
amount of flour defect can be seen in Table 5.
Table 5. Interpretation Result of Calculation of Total Flour.
Response (Afkir
Flour Rice)
Predic
tion
Optimization
Type of Disability Ash Level (> 1%)
Experim
ents
Taguchi
Average
(µ)
5,08 4,48 ≤ µ
prediction
≤
5,68
Variabil
ity
(SNR)
-13,78 -14,38 ≤ µ
prediction
≤ -13,18
Average
(µ)
4,89 4,16 ≤ µ
confirmation
≤ 5,62
Confirm
ation
Experi
Ment
Variabil
ity
(SNR)
-13,84 -14,57 ≤
µ
confirmation
≤ -8,22
Types of Fiber Defects Still Rough
Experim
ents
Taguchi
Average
(µ)
4,67 4,90 ≤ µ
prediction
≤
5,26
Variabil
ity
(SNR)
-12,85 -13,35 ≤ µ
prediction
≤ -12,35
Confirm
ation
Experi
Ment
Average
(µ)
4,61 3,86 ≤ µ
confirmation
≤ 5,36
Variabil
ity
(SNR)
-13,67 -14,27 ≤
µ
confirmation
≤ -
12,77
The result of experiment from table above can
be seen that by Taguchi method (Mitreva, 2016) to
confirmation experiment decrease at mean value (μ)
flour of defect rice and decrease of defect variation
that happened compared to average value of defect
of rice flour per day, where for type disability ash
content (> 1%) suffered a defect per day of 5.33kg /
day, after the experiment Taguchi decreased to 5.08
and through confirmation experiments of 4.89. The
same is true for fiber defects still rough, where the
average defect per day is 5kg / day. After the
experiment Taguchi decreased to 4.67, and through
confirmation experiments of 4.61.
4 CONCLUSION
Based on the research that has been done, the
following conclusions are obtained:
1. The cause of the number of reed rice flour to the
type of disability ash content, the cause effect
diagram caused by the terms of machine, material,
human, method and environment, with the main
factor is the rotational speed of grinding machine,
rice immersion duration and drying temperature
Cause the number of reed rice flour the type
of
defect is still rough, the cause effect diagram is
caused in terms of machine, material, human and
method, with the main cause is the process of
dissolution, the speed of rotary grinding machine
and the duration of rice immersion.
Quality Control on Flour Rice with Statistical Quality Control (SQC) Method and Taguchi Method
271

2. After the Taguchi experiment and confirmation
experiment, it can be seen that the average number
of rejects decreased after the Taguchi experiment
and the confirmation experiment.
3. Combination of optimum factor level which has
significant influence with Taguchi experimental
design as the basis of quality improvement of rice
flour on ash disability type is Rolling Speed of 192
rpm Milling Machine, 2.5 hours Rice Soaking,
2.57C Drying Time and Temperature. The
combination of optimum factor level which the
significant effect on fiber type of defect is still
rough is Rolling Speed of 192 rpm Milling
Machine, 2.5 Hours Soaking Rice, and Drying
Temperature 197oC. Rotary Speed of Grinding
Machine 179 rpm, Length of Immersion of Rice
2.5 hours, and 1- hour Dissolution Process.
REFERENCES
Ahmed, Mohiuddin. (2011). An Application of Pareto
Analysis and Cause-and-Effect Diagram (CED) for
Minimizing Rejection of Raw Materials in Lamp
Production Process. Vol.
5,No.3,2011,pp.81DOI:10.3968/j.mse.1913035X20110
503.320
Amirul Aliff Bin Jamaludin. (2016). Determination Of
Optimal PDC Cutters Geometry For Multi-Response
Optimization Using The Taguchi Method. Department
of Mechanical Engineering, Universiti Teknologi
Petronas, Bandar Seri Iskandar, Perak, Malaysia.
ARPN
Belouafa, Soumia. (2017). Statistical tools and approaches
to validate analytical methods: methodology and
practical example.Int. J. Metro. Qual. Eng. Volume 8,
2017
Besterfield, Dale H.. (1998). Quality Control. Fifth
Edition. New Jersey: Prentice Hall.
Blitzkow, Denizar. (2013). Use Of Control Charts For
Multi-Temporal Analysis Of Geodetic Auscultation
Data From Dams
Chede, Bahrat. (2016). Statistical Process Control a
Rejection Control Tool “A Case Study”
Cheng, Hsien Li . (2016). Confirmatory Factor Analysis
With Ordinal Data: Comparing Robust Maximum
Likelihood And Diagonally Weighted Least Squares
Journal of Engineering and Applied Science. Vol. 11,
no. 22, November 2016
Johnston, Melissa. (2014). Secondary Data Analysis: A
Method of which the Time Has Come. Qualitative and
Quantitative Methods in Libraries (QQML) 3:619 –
626, 2014
Krishankant. (2012). Application of Taguchi Method for
Optimizing Turning Process by the effects of Machining
Parameter.International Journal of Engineering and
Advanced Technology (IJEAT)
Kumar, Sandeep. (2018). An Optimal Single Sampling Plan
for Minimizing the Producer’s Total Cost and
Providing a Protection for Both Producer and
Consumer. International Journal of Current
Microbiology and Applied Sciences ISSN: 2319-7706
Volume 7 Number 02 (2018)
Lamont, Andrea. (2015). What exactly are degrees of
freedom?: A tool for graduate students in the social
science. DOI:10.13140/RG.2.1. 2017.7127
Liliana, Luca. (2016). A New Model of Ishikawa Diagram
for Quality Assessment. IOP Conf. Series: Materials
Science and Engineering 161 (2016) 012099
doi:10.1088/1757-899X/161/1/012099
Mitreva, Elizabeta. (2016). Optimization of Business
processes in Airport Services Company in Macedonia
using the TQM Philosophy. University "Goce Delcev"
- Stip, R. Macedonia. TEM Journal. Volume 5, Issue 4,
November 2016.
Neuburger, Jenny. (2017). Comparison of Control Charts
for Monitoring Clinical Performance Using
Binary Data. BMJ Qual Saf 2017;26:919–928.
doi:10.1136/bmjqs-2016-005526
Paradis, Elise. (2016). Design: Selection of Data
Collection Method. DOI:http//dx.doi.org/10.
400/JGME-D-16-00098.1
Qasim, Shahla. (2014). Review of True Experimental
Research Studies in Applied Linguistics. Research on
Humanities and Social Sciences
www.i iste.org ISSN (Paper)2224-5766 ISSN
(Online)2225-0484 (Online)
Souza, de Bruno. (2018). Use of the robust design
methodology for identification of factors that contribute
to the intensity of the “orange peel” aspect on painted
bumper surfaces. Gest. Prod., São Carlos, Ahead of
Print, 2018 http://dx.doi.org/10.1590/0104-
530X3160-18
Srinivasan, Rallabandi. (2011).Utility Of Quality Control
Tools And Statistical Process Control To Improve The
Productivity And Quality In An Industry. International
Journal of Reviews in Computing. IJRIC& LLS.
ICOSTEERR 2018 - International Conference of Science, Technology, Engineering, Environmental and Ramification Researches
272
