
The Correlation of Fasting and 2-Hours Postprandial Plasma Glucose
with Glycated Hemoglobin as Glycemic Control
Mutiara Indah Sari
1
, Milahayati Daulay
2
, Dian Dwi Wahyuni
3
and Zaimah Z. Tala
4
1
Department of Biochemistry, Faculty of Medicine, Universitas Sumatera Utara, Jl.Dr. Mansur No.5 Medan, Indonesia
2
Department of Physiology, Faculty of Medicine, Universitas Sumatera Utara, Jl.Dr. Mansur No.5 Medan, Indonesia
3
Department of Microbiology, Faculty of Medicine, Universitas Sumatera Utara, Jl.Dr. Mansur No.5 Medan, Indonesia
4
Department of Clinical Nutrition, Faculty of Medicine, Universitas Sumatera Utara, Jl.Dr. Mansur No.5 Medan, Indonesia
Keywords: Fasting Plasma Glucose, Postprandial Plasma Glucose, Glycated Hemoglobin, Glycemic Control.
Abstract: Diabetes Mellitus (DM) is one of the non-communicable diseases that are currently increasing in number.
One of the indicators that used to describe the longer period of glycemic control in patients with DM is the
level of glycated hemoglobin or HbA1c. The purpose of this study was to determine whether in fasting or 2-
hours postprandial plasma glucose (PPG) level correlated with HbA1c level. So it can be used as the glycemic
control when measurement of the HbA1c is not available. This study is a cross-sectional study, on 60 type 2
diabetes mellitus patients at the University of Sumatera Utara Hospital. Before the examination, respondents
are required to fast for 10-12 hours. Examination of fasting plasma glucose (FPG) and 2-hours PPG were
performed using a cobas 6000 analyzer with hexokinase and immunoturbidimetry method. HbA1c was
measured using high-performance liquid chromatography (HPLC) method. The correlation between FPG with
HbA1c and 2-hours PPG with HbA1c was analyzed with the Spearman bivariate correlation test by SPSS 22
version. We found that the mean and SD values of FPG, 2-hours PPG, and HbA1c were 186.31 ± 71.27,
284.88 ± 92.06 and 8.85 ± 1.73, respectively. The Spearman bivariate correlation indicated a significant
association (p = 0.005, r = 0.357) between FPG with HbA1c. In this study found that no correlation between
2-hours PPG with HbA1c (p = 0.780, r = 0.036). We conclusions, FPG indicated as glycemic control better
than 2-hours PPG on type 2 diabetic if the HbA1c examination is not available.
1 INTRODUCTION
Diabetes mellitus (DM) is a metabolic disorder
marked with elevated chronic blood sugar levels
(hyperglycemic/ BGLs). This hyperglycemia
condition can be affected by insulin resistance
syndrome, insulin deficiency, or a combination of
both. It leads to impaired metabolism (Rodwell,
2015). DM is a non-communicable disease that every
year the incidence of this disease is increases. In year
2015 data by WHO shows that about 415 million
people suffer DM and it will be continued to increase
in over the last three decades. WHO estimate in year
2040 incidence rate of DM will be 642 million people
(WHO, 2016). Oxidative stress is a complications that
happen in DM. Oxidative stress will increase lipid
peroxide as malondialdehyde (MDA) (Sari, 2018).
Increase of lipid peroxide will increase of cell death.
Achieving a good glycemic control is an attempt to
prevent complications.
Glycemic control in DM patients can be
schematically described as the 'glucose triad', with
hemoglobin glycate or HbA1c, fasting plasma
glucose (FPG), and 2-hours postprandial plasma
glucose (PPG) levels (Monnier and Collete, 2009).
Among these three components, the HbA1c level
examination as a glycemic control is more
advantages. The advantage of the HbA1c test is any
diet does not influence it, before HbA1c level
examination, the patients no need to fasting, (it is so
simple for the patients), the results of HbA1c level is
stable to monitor hyperglycemic conditions for three
months ago and stress conditions not affect the
HbA1c levelz (ADA, 2014; Schteingart, 2002). The
rate of hemoglobin glycate formation is equivalent to
the average amount of blood glucose concentration.
When glucose levels rise above normal, the amount
of hemoglobin glycate will also increase. The
direct association between HbA1c and the average
amount of glucose occurs because the erythrocytes
Sari, M., Daulay, M., Wahyuni, D. and Tala, Z.
The Correlation of Fasting and 2-Hours Postprandial Plasma Glucose with Glycated Hemoglobin as Glycemic Control.
DOI: 10.5220/0010080206050609
In Proceedings of the International Conference of Science, Technology, Engineering, Environmental and Ramification Researches (ICOSTEERR 2018) - Research in Industry 4.0, pages
605-609
ISBN: 978-989-758-449-7
Copyright
c
2020 by SCITEPRESS – Science and Technology Publications, Lda. All rights reserved
605

are continuously binding of glucose (Glycosylated)
for 120 days of life (Schteingart, 2002).
There is no perfect clinical diagnostic test. HbA1c
examination techniques and tools are not available in
every hospital or community health center. One of the
other limitations is that the cost of HbA1c
examination is quite expensive. It is, therefore,
necessary to identify whether the HbA1c values are
more closely correlated with the fasting plasma
glucose or to the 2-hours postprandial plasma glucose
levels. This condition is important to know so it can
be determined which of the two is preferred as the
glycemic control if the HbA1c examination is not
possible. Patel .'s research (2016) found that HbA1c
contributed more to fasting plasma glucose so that
FPG and HbA1c were closer to describing glycemic
control (Patel ., 2016). The (Ya'cub, 2014) study
showed a strong correlation between the 2-hours
postprandial plasma glucose and HbA1c values.
(Ketema and Kibret, 2015) state that FPG and 2-hours
PPG are similarly correlated with HbA1c levels, but
the 2-hours postprandial plasma glucose has a closer
association with HbA1c than FPG (Ya’cub, 2014;
Ketema and Kibret, 2015). Thus, the purpose of the
present study was to determine whether HbA1c
correlates with fasting plasma glucose or 2-hours
postprandial plasma glucose as a glycemic control of
type 2 diabetes mellitus (T2DM) in Universitas
Sumatera Utara, Hospital, Medan.
2 METHOD
This research used an analytical cross-sectional
design. The study were approved by the Ethics
Committee of the Faculty of Medicine of the
Universitas Sumatera Utara with No. 227/FK USU.
The population in this research was type 2 diabetes
mellitus patients who were diagnosed by an
endocrine specialist based on the criteria
established by PERKENI (PERKENI, 2015)
in Universitas Sumatera Utara hospital.
The research population consisted of 60 diabetic,
and the inclusion criteria were 1) had experienced
T2DM for more than six months 2) willing to
participate in the research by signing on the
presentation sheet after explanation. The exclusion
criteria were 1) anemia, hemoglobinopathy 2) had a
history of blood transfusion in the last 2-3 months 3)
had a disease affecting erythrocyte age and 4)
impaired renal function.
Data collection of characteristics such as age,
gender and duration of disease were done through
interviews using questionnaires. FPG, 2-hours PPG,
and HbA1c levels were measured from the blood
plasma of the type 2 DM patients obtained from vena
mediana cubiti after fasting for at least 8-12 hours.
FPG, 2-hours PPG, and HbA1c were measured at the
Integrated Laboratory in the Universitas Sumatera
Utara Hospital on the same day. The FPG and 2-hours
PPG measurements used the cobas 6000 analyzer
with hexokinase and immunoturbidimetry method
(Roche Diagnostics, Switzerland). HbA1c was
measured using high-performance liquid
chromatography (HPLC) method. Then the data
was analyzed using the Spearman bivariate
correlation test with p-values of < 0.05 were
considered significant by SPSS version 22.
3 RESULT AND DISCUSSION
In this study, the characteristics of 60 type 2 DM
patients can be seen in Table 1
Table 1: Distribution of respondent characteristics
Variables N (%) Mean, SD
Age (years) - 57.53±9.09
Gender (male/
female)
39(65)/
21(35)
Duration of disease
(years)
- 7.52±2.80
Fasting blood
glucose (mg/dl)
- 186.31±71.
27
2-hours postprandial
blood glucose
(mg/dl)
- 284.88±92.
06
HbA1c (%) - 8.85±1.73
Table 1 shows the mean values of the age of
respondents was 57.53 years (SD = 9.09). Age is one
of the risk factors for diabetes mellitus. This condition
is probably caused by some changes in body
composition which is created by the aging process.
Aging causes a decline in the pancreatic function that
synthesizes insulin (Rochmah, 2009).
In the present research, based on gender found that
male respondents group more than female (65% VS
35%). The males are more likely to suffer from DM
in this population. The results of this research are not
the same as the research conducted by Mihardja
which showed that females are two times more likely
to have hyperglycemia than males (Mihardja, 2009).
Females control the excess energy as fat deposits
while male use their excess energy to synthesize
proteins. In the female, central obesity and increased
body fat will result in a decrease in the action of
ICOSTEERR 2018 - International Conference of Science, Technology, Engineering, Environmental and Ramification Researches
606
insulin in the target tissue, leading to an increase in
blood glucose levels (Flier and Maratos-Flier, 2010).
In the present, the mean value of the duration of
DM disease is 7.52 years. This value can be
seen by reflecting on the mean of FPG, 2-hours PPG
and HbA1c levels of the research subjects. On the
uncontrolled of DM, the length of the duration of DM
will cause the parameters of BGLs will get worse
(Sari
b
, ., 2018). The mean of the three glycemic
parameters were above normal (186.31 mg/dl,
284.88, and 8.85%) with poor HbA1c glycemic
control (glycemic controls of either if HbA1c levels
<7%, poor, if HbA1c levels >7%) (PERKENI, 2015)
HbA1c is a substance formed from a chemical
reaction between glucose and hemoglobin. In HbA1c,
the glucose molecules will bind to the N-terminal
group on the HbA0 chain of HbA1c, so then the
glucose will fuse with the free amino group on valine
N-terminal of β hemoglobin (Rodwell, 2015). This
binding is called glycosylation. In DM patients,
glycosylation of hemoglobin increases
proportionately with blood glucose levels during the
previous two-three months. In 1976, the HbA1c level
was first proposed as an indicator of glucose
regulation in diabetic patients. The HbA1c level is
mainly determined by two factors which are blood
glucose level and erythrocyte age. Since 1980 the
measurement of HbA1c levels as a determination of
the DM glycemia index has been widely accepted.
HbA1c measurement is important for long-term
control of glycemic status in diabetic patients to
predict a decrease or increase in DM complications
(International Expert Committee, 2009)
There is no perfect clinical diagnostic test. HbA1c
as a glycemic control does not reflect glycemic
changes in a relatively short period, and its accuracy
is said to decrease if accompanied by abnormalities
of hemoglobin metabolism such as anemia and in
patients with thalasemia (Monnier and Collete,
2009). Another problem is it is expensive and not
available in most hospitals or health centers.
In addition to the HbA1c test, glycemic control in
patients with DM can be done by measuring the FPG
and 2-hours PPG levels. These three examinations
can schematically be described as 'glucose triads'
(Monnier and Collete, 2009). The significance and
strength of FPG correlations with HbA1c levels and
PPG with HbA1c levels shown in Table 2.
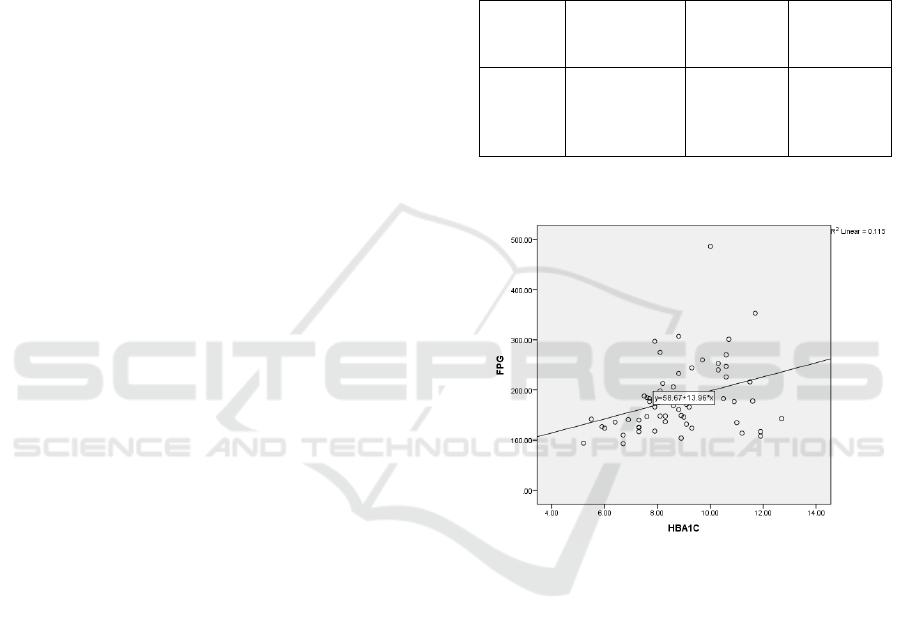
In this study, the Spearman bivariate correlation
test showed a significant correlation between FPG
and HbA1c levels with weak correlation strength (p =
0.005, r = 0.357), The FPG level is the BGLs
measured after a person undergoes an 8-12 hours fast
on the night before the test. The
objective of fasting on this test is to reduce the
variability of glucose metabolites resulting from the
metabolism of nutrients after meals. Fasting ensures
that BGLs are not affected by carbohydrate
metabolites from the last intake of nutrients (Rodwell,
2015). Whether there is a correlation between FPG
and HbA1c levels so that it can be used to replace
HbA1c examination is still debatable. The objective
of the FPG examination is as a substitute for the
HbA1c examination if the HbA1c test is not available.
Table 2: Correlations between FPG and PPG with HbA1c
Variable Mean±SD
mg/dl
p Correlatio
n (r) with
HBA1C
FPG
2-hours
PPG
186.31±71.2
284.88±92.0
0.005*
0.780
0.357**
0.036**
*p< 0.01 level (2-tailed)
Figure 1. Scatter-plot of FPG with HbA1C levels
The results of the present research are similar to
the study by (Akinloye, 2007) who found a significant
correlation between FPG and 2-hours PPG levels in
patients with type 2 DM with a strong correlation, but
no significant in the healthy group (Akinloye, 2017).
Similar results were also found in the research by
(Suprihartini, 2016) and (Kan, 2015) (Suprihartini,
2016; Khan, 2015). In the study of (Kan, 2015)
found a significant correlation between FPG and
HbA1c level with regression analysis on both
variables showed significance. The significant
correlation between the two variables were obtained
by cut-off point criteria of HbA1c ≥ 6.5 (Khan,
2015).
Another research of DM patients in Japan shows
that FPG is significantly correlated with HbA1c if the
cut-off point of HbA1c> 8 (Kikuchi, 2010). The study
The Correlation of Fasting and 2-Hours Postprandial Plasma Glucose with Glycated Hemoglobin as Glycemic Control
607

by Khatab show there was no significant correlation
between FPG and 2-hours PPG in the cut-off
point HbA1c < 8. FPG appears to be a major
contributor to BGLs in uncontrolled diabetes patients
(HbA1C> 8.4%) (Khatab, 2010). Research by (Patel,
2016) suggests FPG correlates to HBA1c with levels
above> 7%, not below 7%. FPG was also conferred
to be the key contributor for glycation of hemoglobin
and can assess the shift of glycemic status in diabetics
(Patel, 2016).
As well as the debate over the correlation of FPG
with HbA1c, the debate over the 2-
hours PPG correlation with HbA1c is also much of a
basis for research. In the present study, the Spearman
correlation between PPG and HbA1c levels show no
significant correlation with p = 0.780, r = 0.036. The
results of this study are different from the research
conducted by (Sikaris, 2009) which states that there
is a significant correlation between PPG with HbA1c
and no significant correlation between FPG and
HbA1c (Sikaris, 2009). Research by (Ketema and
Kibret, 2015) and research by (Shrestha, 2012) found
significant correlations between PPG with HbA1c
levels and also FPG with HbA1c levels, but PPG
found a stronger correlation with HbA1c than FPG
(Ketema and Kibret, 2015; Shrestha, 2012). Research
by Swetha (2014) also shows a correlation between
HbA1c with PPG and FPG, where the r value is PPG>
FPG. Sensitivity test results show that the specificity
obtained by PPG showed better sensitivity (79% vs.
74%) than FPG whereas FPG showed higher
specificity (84% vs. 74%) and positive predictive
value (87% vs. 80%) compared to PPG (Swetha,
2014).
The 2-hours PPG test is a BGLs examination
which is done 2-hours postprandial after fasting for at
least 8-12 hours. The 2-hours PPG test was done to
see how much of the pancreas or insulin function is
made out of the pancreas to regulate the distribution
of glucose levels from the blood circulation into the
cells. Diabetic patients will experience an increase in
BGLs after eating, and because of the insulin, these
BGLs will decline within two hours after eating
(Rodwell, 2015).
The previous research has found that there is a racial
and ethnic variation play a role of HbA1c as a
diagnostic test for diabetes. The role of racial and
ethnic differences in HbA1c values has been
recognized for many years, but so far these
differences have generally been associated with
differences in care patterns or quality of care
(Herman, 2009). Data analysis from the National
Health and Nutrition of 1999-2000 showed a
difference in mean values of HbA1c levels in the
white race compared to black and Hispanic race. This
analysis was done on a population of diabetic and
non-diabetic patients. The study reported an average
HbA1c value in the white race compared to black, and
the Hispanic race was 7.6% VS 8.1% VS 8.2%. This
ethnic and racial role in this HbA1c value may affect
the correlation between HbA1c and the mean value of
either FPG or PPG. The correlation between mean
blood glucose and HbA1c may not be the same in all
people depending on the ethnicity and race (Herman,
2012)
4 CONCLUSIONS
In this study, HbA1c levels show a significant
correlation with FPG levels, not with PPG levels.
Hence, as glycemic control, FPG examination may be
used instead of HbA1c if the HbA1c test is not
available. It should be noted that HbA1c remains the
gold standard in the assessment of glycemic control
with the availability of the HbA1c method.
ACKNOWLEDGEMENT
The present study is supported by the Ministry of
Research and Technology and the Higher Education
Republic of Indonesia, under the research grant
PDUPT USU of the Year 2018 with Contract Number
84/UN5.2.3.1/PPM/KP-DRPM/2018. The authors be
thankful to the Director of the Universitas Sumatera
Utara Hospital, Dr. dr. Syah Mirsya Warli, Sp.U and
the Head of the Integrated Laboratory, Faculty of
Medicine, USU, dr. Dewi Indah Sari Siregar, Sp.PK,
for providing the place for this research.
REFERENCES
Akinloye, O.A., Adaramoye, O.A., Akinlade, K.S., Odetola
A.A., Raji, A.A., 2017. Relationship between Fasting
Plasma Glucose and Glycated Haemoglobin In Adult
Diabetic Nigerian. African Journal of Biomedical
Research 10 127-132.
American Diabetes Association/ ADA, 2014. Diagnosis
and classification of diabetes mellitus. Diabetes Care
37(1) 14-15 doi: 10.2337/dc14-S081
Flier, J.S, and Maratos-Flier, E., 2010. Harrison’s Principle
of Internal Medicine 17
th
edition USA: The McGraw-
Hill Companies 622-629.
Herman, W.H., Dungan, K.M., Wolffenbuttel, B.H., Buse,
J.B., Fahrbach,J.L., Jiang, H., Martin, S., 2009. Racial
and ethnic differences in mean plasma glucose,
ICOSTEERR 2018 - International Conference of Science, Technology, Engineering, Environmental and Ramification Researches
608

hemoglobin A1c, and 1.5-anhydroglucitol in over 2,000
patients with type 2 diabetes. J Clin Endocrinol Metab
94 1689-1694
Herman, W.H., and Cohen, R.M., 2012. Racial and Ethnic
Differences in the Relationship between HbA1c and
Blood Glucose: Implications for the Diagnosis of
Diabetes. J Clin Endocrinol Metab 97 (4) 1067–1072
doi: 10.1210/jc.2011-1894
International Expert Committee, 2009. International Expert
Committee report on the role of the A1c assay in the
diagnosis of diabetes. Diabetes Care 32 1327–1334
Ketema, E.B, and Kibret, K.T., 2015. Correlation of fasting
and postprandial plasma glucose with HbA1c in
assessing glycemic control; systematic review and
meta-analysis. Archives of Public Health Archives of
Public Health 73 (43). DOI 10.1186/s13690-015-0088-
6.
Khan, H.A., Sobki, S.H., Alhomida, A.S., 2015. Regression
analysis for testing association between fasting blood
sugar and glycated hemoglobin in diabetic patients.
Biomedical Research 26 (3): 604-606
Khattab, M., Khader, Y.S., Khawaldeh, A.A., Ajlouni, K.,
2010. Factors associated with poor glycemic control
among patients with Type 2 diabetes. J Diabetes
Complications 24 84-89.
Kikuchi, K., Nezu, U., Shirakawa, J., Sato, K., Togashi,Y.,
Kikuchi, T., Aoki, K., Ito, Y., Kimura, M., Terauchi,
Y., 2010. Correlations of fasting and postprandial blood
glucose increments to the overall diurnal
hyperglycemic status in type 2 diabetic patients:
variations with levels of HbA1c. Endocr J 57 259-266.
Mihardja, L., 2009. Faktor yang berhubungan dengan
pengendalian gula darah pada penderita diabetes
mellitus di perkotaaan Indonesia. Maj Kedokt Indon 59
(9) 418-23.
Monnier, L., Collete, C., 2009. Target for glycemic control:
concentrating on glucose. Diabetes Care 32 (2). DOI:
10.2337/dc09-S310.
Patel, S., Nanda, R., Sahoo, S., Mohapatra, E., 2016.
Predictive Role of Fasting and Post-Prandial Glucose
towards Glycemic Control. National Journal of
Laboratory Medicine 5(4) BO15-BO21. DOI:
10.7860/NJLM/2016/22130:2174.
PERKENI Perkumpulan Endokrinologi Indonesia., 2015.
Pengelolaan dan Pencegahan Diabetes Melitus Tipe 2
di Indonesia.
Rochmah, W., 2009. Diabetes Mellitus pada Usia Lanjut In
Setiati S Ilmu Penyait Dalam Edisi 6 Jakarta: Interna
Publishing 1969-1971
Rodwell, V.W., Bender, D.A., Bitham, K.M., Kennelly,
P.J.,Weil, P.A., 2015. Harper’s Illustrated Biochemistr
Harper’s Illustrated BiochemistryMcgraw-Hill
Medical 58-59.
Sari, M.I
a
.
.
, Sari, N., Darlan, D.M., Prasetya, R.J., 2018.
Cigarette Smoking and Hyperglycaemia in Diabetic
Patients. Open Access Maced J Med Sci 6 (4) 634-637.
https://doi.org/10.3889/oamjms.2018.140.
Sari, M.I
b
., Ilyas, S., Widyawati, T., Antika, M.A., 2018..
Effect of lawsonia innermis (linn) leaves ethanolic
extract on blood glucose and malondialdehyde level in
alloxan-induced diabetic rats IOP Conf. Series: Earth
and Environmental Science 130 012034 doi
:10.1088/1755-1315/130/1/012034.
Schteingart, D.E., 2002. Metabolism of Glucose and
Diabetes Mellitus. In: Price SA, Wilson LM.
Pathophysiology: Clinical Concepts of Disease
Processes. Pancreas 60 345-346. Elsevier Science
Shrestha, L., Jha, B., Yadav, B., Sharm., 2012. Correlation
Between Fasting Blood Glucose, Postprandial Blood
Glucose And Glycated Hemoglobin In Non-Insulin
Treated Type 2 Diabetic Subjects. Sunsari Technical
College Journal 1 (1)
Sikaris, K., 2009. The Correlation of Hemoglobin A1c to
Blood Glucose. Journal of Diabetes Science and
Technology Volume 3, Issue 3, May
Suprihartini, 2016. Hubungan HBA1c Terhadap Kadar
Glukosa Darah Pada Penderita Diabetes Mellitus Di
RSUD. Abdul Wahab Syahranie SamarindaTahun
2016. Mahakam Medical Laboratory Technology
Journal 1 18-26.
Swetha, N.K., 2014. Comparison of fasting blood glucose
& post prandial blood glucose with HbA1c in assessing
the glycemic control International J. of Healthcare and
Biomedical Research 2 (3) 134-139
World Health Organization, 2016. Global Report on
Diabetes 978 (88).
Ya’kub, K.R., Partan, R.U., Habib, M., 2014. Korelasi
Antara Gula Darah 2 Jam Postprandial dan HbA1c di
Laboratorium Klinik Graha Spesialis RSMH
Palembang. MKS 46 (1).
The Correlation of Fasting and 2-Hours Postprandial Plasma Glucose with Glycated Hemoglobin as Glycemic Control
609
