
Waste Identification using Value Stream Mapping in Animal Feed
Industry
Erwin
1
, Khawarita Siregar
1
, Anizar
1
, Indah Rizkya
1
, Khalida Syahputri
1
and Rahmi M. Sari
1
1
Industrial Engineering Department, Faculty of Engineering, Universitas Sumatera Utara, Indonesia
Keywords: Waste Identification.
Abstract: The animal feed industry plays an important role in supporting the development of the livestock industry in
providing the availability of meat and derivative products. Feed also determines product quality, livestock
productivity and profits for livestock entrepreneurs. In general, the main raw material used in the process of
corn import. The dependence of animal feed on imported raw materials leads to increase production costs
and impacts the price of animal feed. To maintain the stability of production costs, the animal feed industry
capable to maintain and improve efficiency in the production process. The efficiency of the production
process improved by waste minimization. To minimize waste, it is necessary to identify the first waste in the
production process of animal feed to find out the most usual waste by categorizing all activities in the
production process into value added, necessary but non value added, and nonvalue added categories. This
identification done by using value stream mapping tools such as current state mapping. With current state
mapping, it is found that the VA percentage of 61.02% with total lead time of 7219.5 seconds, percentage of
necessary but NVA of 18.16% with total transportation and inspection time of 1220.8 seconds and 927.4
sec, while those included in the NVA of 20.82% with total delay and storage time respectively of 1463.3
seconds and 999.6 seconds.
1 INTRODUCTION
Business competition in the animal feed industry is
increasing strictly and growing demands every
company to always making improvements and
improvements in performance to develop and
compete better with other competitors. The domestic
animal feed industry plays an important role in
supporting the development of industry in providing
the availability of meat consumption and its
derivative products. Animal feed determines the
quality of livestock products, livestock productivity
and livestock profits.
Animal feed industry located in Medan City
produces various animal feed products. Products
produced include chicken feed, duck feed, quail
feed, cattle feed and pig feed. All products are
generated generally through the same process stages
of raw material pouring, raw material filtration,
drying of raw materials, weighing raw materials,
milling, mixing, pellet forming, crumble forming,
finage spraying, animal feed packaging. In general,
the main raw material used in the process is
imported corn.
This causes the price of animal feed will
continue the increasing of Indonesian market due to
the spike in the dollar exchange rate against the
rupiah. The dependence of livestock feed on
imported raw materials leads to increase production
costs and impacts the price of animal feed. In
addition, the production of animal feed which is
doing rework causes quality decrease and only be
sold with a lower grade. To maintain the stability of
production costs, animal feed industry must capable
to maintain and improve efficiency in the production
process. The efficiency of the production process
increased by waste minimization (waste) occurs
along the feed supply chain. To minimize the waste,
it is necessary to identify the first waste in the
production process of animal feed to find out the
waste that most often occurs and causing the
production process is disrupted and done
immediately. Waste identification done using
activity description during process production into
value added activity, necessary but non value added,
and non value added activity using lean
manufacturing (Syahputri, 2017).
200
Erwin, ., Siregar, K., Anizar, ., Rizkya, I., Syahputri, K. and Sari, R.
Waste Identification using Value Stream Mapping in Animal Feed Industry.
DOI: 10.5220/0010075702000203
In Proceedings of the International Conference of Science, Technology, Engineering, Environmental and Ramification Researches (ICOSTEERR 2018) - Research in Industry 4.0, pages
200-203
ISBN: 978-989-758-449-7
Copyright
c
2020 by SCITEPRESS – Science and Technology Publications, Lda. All rights reserved

Lean is defined as a strategy in determining a
significant increase of all resources and time in the
total process (Neha, 2013). The term "lean" is a
concept that implies activities to eliminate waste and
non-value-added operation (Manzouri, 2014), (Wee
and Wu, 2009), (Marshall and Farahbakhsh, 2013).
The Lean manufacturing concept derives from the
method developed at Toyota, which is described by
authors such as Taiichi Ohno and Shiego Shingo.
But these concepts in the form of a Lean
Manufacturing System (LMS) are united with
international recognition, as a result of the book,
Machine Changes the World, written by researchers
Womack et al. One method used for lean
manufacturing is value stream mapping. VSM is a
powerful tool that allows visualization and
understanding of material and information flows
through the value chain. This is to provide a global
vision of activities involved in the production
process, and allow projecting of sources (Lacerda,
2016), (Pavnaskar, 2003).
The use of VSM has existed after the success of
the Toyota Company in Japan since the 1980s. It
was developed by the Toyota Company between
1960 and 1970. At the beginning, VSM was a
method that identified waste time and unnecessary
actions in the process. Now is the time for VSM to
work for operations process (Reddy, 2013).
Many researches have been done with lean
manufacturing approach. (Girish) Research was
conducted to create a case study in the foundry using
a value stream mapping tool. (Khannan and
Haryono) Research was also conducted on
companies producing lean manufacturing to
eliminate waste on production lines. (Wojcik and
Kocon, 2015) Other studies were also conducted
with lean manufacturing tools to improve operations
at paper companies. However, there is no much
research with the lean manufacturing approach was
conducted in animal feed industry in Medan. This
study aims to identify waste in the production line to
find out which is the most usual waste in production
lines and animal feed production process becomes
disrupted.
2 METHODOLOGY
The research was conducted on one of the company
produces animal feed in Medan city with the object
is the production line of animal feed making. The
research begins by making direct observations to the
production floor to collect information related to
animal feed production process. Activityat this stage
is observing formulation of the problem occurs in
the company. After the observation, then determined
the topic and research objectives in accordance to
existing conditions on the production floor. After
determined the topic and purpose of the research,
then conducted data collection needed to identify
waste occurs in the production line. The data needed
for the time cycle of making animal feed and the
process flow of animal feed production. After data is
collected, then the waste identification is done with
several steps.
The first stage is to map the flow of the overall
plant with current state mapping. Current State Map
(CSM) chart presents flow of information and
materials as a product through the manufacturing
process. This is an important thing to understand the
need for change and to understand lie's opportunity
(Goriwondo, 2011).
At this stage, each process is combined with
material flow and information flow into a single
flow in the factory. After mapping the flow of the
overall process in the factory is made, the next step
is to identify of waste in the flow of production
process. Identification is done based on the result of
current state mapping. From the current state
mapping results, obtained activities exist in the
production process of making animal feed. The
activities will be classified into three categories:
value added, necessary but non value added, and non
value added. Types of activities includes value
added are operations, the types of activities included
in the category of necessary but non-value added are
transportation and inspection of the types of
activities included in non-value added activity
categories are storage and delay. By grouping
activities by category, will be obtained percentage at
each category of activity and known the percentage
of waste exist in animal feed production line.
3 RESULT AND DISCUSSION
Research in identifying waste with value stream
mapping is done by describing current state mapping
first. Current state mapping is used to describe the
overall system belong to the value stream contained
in the company. With current state mapping, known
the information flow and physical in the system, the
lead time required at each process. Current state
mapping of animal feed production process can be
seen in Figure 1.
Waste Identification using Value Stream Mapping in Animal Feed Industry
201
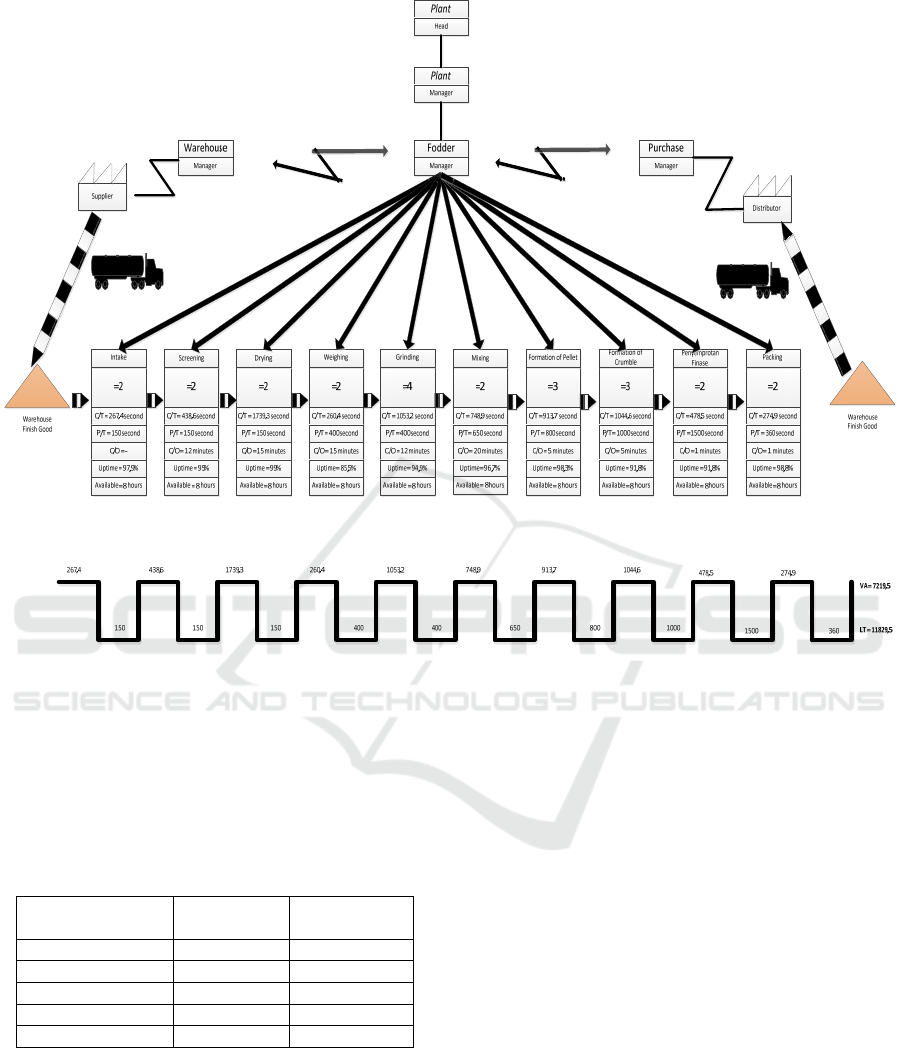
Figure 1. Current State Mapping of Animal Feed Production Process
Based on the mapping above, obtained activities that
exist in the process of making animal feed. The
activities are then classified according to their each
categories to see the percentage at each activity. The
result of activities identified by current state
mapping can be seen in Table 1.
Table 1. Recapitulation of Activity in Animal Feed
Production Process
Activity Category
Time
(Secon
d
)
Percentage
Operation 7219,5 61,02%
Trans
p
ortation 1220,8 10,32%
Ins
p
ection 927,4 7,84%
Dela
y
1463,3 12,37%
Storage 999,6 8,45%
Based on the table above, it is found that the
percentage of value added activity is 61.02%, the
percentage of necessary but non-value added activity
is 18.16%, and non value added activity is 20.82%.
Based on the results obtained, it can be seen that
there are 20.82% of activity in the process of animal
feed
production is an activity has no added value or
activity causing waste. This is related to the number
of waiting activities occurs between stations, causing
the overall process of animal feed production to be
large.
4 CONCLUSIONS
Value stream mapping is used to identify waste
occurring in animal feed production process by
categorizing activities in the production process into
value added, necessary but non-value added, and
non value added categories. By categorizing all
activities according to the three categories, it is
found that the percentage of value added activity is
61.02% with total lead time is 7219.5 seconds, the
percentage of necessary but non value added activity
is 18.16% with total transportation and inspection
time of 1220.8 seconds and 927.4 seconds, while
non value added activity is 20.82% with total delay
and storage time of 1463.3 seconds and 999.6
seconds.
ICOSTEERR 2018 - International Conference of Science, Technology, Engineering, Environmental and Ramification Researches
202

ACKNOWLEDGEMENTS
This work has been fully supported by TALENTA
Research Program (Universitas Sumatera Utara),
No:2590/UN5.1.R/PPM/2018, March 16th, 2018
REFERENCES
K syahputri 2017 IOP Conf. Ser.: Mater. Sci. Eng, 180
012119
S Neha, M G Singh, K Simran, and G Pramod 2013
International Journal of Scientific Research and
Reviews, 2 (1).
M Manzouri, M N Ab-Rahman, C Rosmawati, C M Zain,
and E A Jamsari 2014 Sustainability, 6 179-9204.
H M Wee, S Wu 2009Supply Chain Manag. Int. J., 14,
335–341
R E Marshall, K Farahbakhsh 2013 Waste Management,
33 88–1003
A P Lacerda, A R Xambre, and H M Alvlos 2016
International Journal of Production Reserach, 54 (6).
S J Pavnaskar, J K Gershenson, and A B Jambekar 2003
International Journal of Production Research, 41
(13).
G S Reddy, H Lingareddy, and K Jagadeeshwar 2013
International Journal of Advanced Engineering
Technology, 4
M Girish, et.al.Second International Conference on
Emerging Trends in Engineering (SICETE)
(Jaysingpur: Dr.J.J.Magdum of Engineering).
M S A Khannan, Haryono Jurnal Rekayasa Sistem
Industri, 4 (1).
G P Wojcik, K Kocon 2015 Agricultural Engineering
Journal, 2 (154).
W M Goriwondo, S Mhlanga, A Marecha 2011
Proceeding of the 2011 International Conference on
Industrial Engineering and Operations Management
(Kuala Lumpur, Malaysia 22-24 January).
Waste Identification using Value Stream Mapping in Animal Feed Industry
203
