
Antihyperglycemic and Pancreatic Protective Effect of Squalene
in Streptozotocin-induced Diabetic Rat
Tri Widyawati
1*
, Siti Syarifah
1
, Muhammad Ichwan
1
, Dwi Rita Anggraini
2
, Arlinda Sari Wahyuni
3
1
Department of Pharmacology and Therapeutic, Faculty of Medicine, Universitas Sumatera Utara,
Medan, 20155, Indonesia
2
Department of Anatomy, Faculty of Medicine, Universitas Sumatera Utara, Medan, 20155, Indonesia
3
Department of Public Health, Faculty of Medicine, Universitas Sumatera Utara, Medan, 20155, Indonesia
Keywords: antihyperglycemic, pancreatic islets of Langerhans, squalene, diabetic rat
Abstract: Squalene (Sq), is one compound that reported found in antidiabetic plant (Syzygium polyanthum Wight Walp
leaf). The aim of this study was to evaluate its antihyperglycemic activity and potential pancreactic protective
effect in streptozotocin-induced diabetic rats (SDR). Twenty Wistar rats (male, 180-230 g) were divided into
four groups (n=5) and treated once daily for 14 days p.o. Group I (Sq 160 mg/kg), Group II (metformin (M)
500 mg/kg), Group IV (diabetic control (DC) distilled water 10 ml/kg) and Group III (normal control (NC)
distilled water 10 ml/kg). Blood glucose level (BGL) and a histological study of the pancreas were performed.
As compared to DC, SQ showed significant reduction (p<0.05-0.01) at day6-day14. Interestingly,
histopathological assessment showed the restoration of the STZ-induced pancreatic islet cells damage. The
present study concluded that Sq have antihyperglycemic activity and pancreatic protective effect.
1 INTRODUCTION
Diabetes is a major public health concern (Ramadan
et al., 2017) that being the number one killer among
all chronic diseases in the world (Widyawati et al.,
2015a).
In spite of continuous new drug development to
treat diabetes, medicinal plants remain a potential
alternative therapy as antidiabetic agent (Ramadhan
et al., 2017). The potential of antidiabetic plant is not
only for its antihyperglycemic activity but also for
identification of the responsible active compounds.
Previous study (Widyawati et al, 2015b) identified
squalene (Sq) as one of compounds in antidiabetic
plant ie. Syzigium polyanthum leaf. Squalene, a
triterpene, that has been implicated in several studies
as a compound that contributes to the
antihyperglycemic activities of plants (Baskar et al.,
2011; Jananie et al., 2011; Widyawati, 2015a)
Considering that diabetes is associated with impaired
pancreatic function, in this study we investigated the
effect of Squalene (Sq) on blood glucose level and
pancreatic structure in streptozotocin-induced
diabetic rats.
2 MATERIAL AND METHODS
2.1 Chemical
Squalene, streptozotocin and tween 80 were
purchased from Sigma Aldrich (St. Lous, MAU,
USA).
2.2 Animals
Healthy male Wistar rats weighing between 180-250
g were obtained from animal house of Universitas
Sumatera Utara. The animals were acclimatized at
room temperature and a 12-h dark/light cycle, and
were allowed to access food and water ad libitum for
one week before being used for experimentation. The
study was performed after approved by Animal
Research Ethics Committees (AREEC), Faculty of
Mathematics and Natural Sciences (FMIPA),
Universitas Sumatera Utara (No. EC: 115/KEPH-
FMIPA/2017).
Widyawati, T., Syarifah, S., Ichwan, M., Anggraini, D. and Wahyuni, A.
Antihyperglycemic and Pancreatic Protective Effect of Squalene in Streptozotocin-induced Diabetic Rat.
DOI: 10.5220/0010045204830486
In Proceedings of the 3rd International Conference of Computer, Environment, Agriculture, Social Science, Health Science, Engineering and Technology (ICEST 2018), pages 483-486
ISBN: 978-989-758-496-1
Copyright
c
2021 by SCITEPRESS – Science and Technology Publications, Lda. All rights reserved
483
2.3 Diabetes Induction in Experimental
Diabetic Rats
STZ (55 mg/kg, prepared in a 0.9% NaCl solution)
was injected intra-peritoneally to 16-hrs-fasted rats. ,
administered at single dose of 120 mg/kg body weight
intraperitoneally. Diabetes was confirmed by
determining the blood glucose concentration using
glucometer (Accu Check), after 72 hours of STZ
injection. The rats that had BGL above 200 mg/dl
were included for the study (Yusoff et al, 2017).
2.4 Experimental Set up
Diabetic rats were divided randomly into three groups
(n=5). The first group (Sq) was administered Sq (160
mg/kg). The second group (M) was given metformin
(500 mg/kg) to serve as the positive control. The third
group (DC) was treated with normal saline (10 ml/kg)
and served as the negative control. Normal control
(NC) rats were included to the study that received
normal saline (10 ml/kg). All treatments were
dissolved in NaCL 0.9% and tween 80 5% before
administration.
2.5 Preparation Pancreatic for
Histopathological Analysis
The 14-days treated diabetic rats were sacrified with
the carbogen gas (95% O2 and 5% O2) and the
pancreas was excised for histological studies. The
pancreas was fixed in 10% buffered formaldehyde for
24 hours, followed by dehydration using 70% alcohol
(60 min), 96% alcohol (45 min), and absolute alcohol
(2 h). The clearing phase of the samples was made by
repeated xylene immersions, followed by paraffin
wax infiltrations.
The samples were automatically processed with
tissue processor Thermo Scientific STP 120-3 and
paraffin embedding was prepared using modular
tissue embedding center Thermo Scientific Microm
EC 350-1. The parafffin-embedded tissues were
sectioned into 5 μm using the Leica RM 125RTS
microtome and mounted on a microscope slides. The
mounted slides were stained with hematoxylline (H)
and eosin (E) according to H&E staining technique.
The stained sections were then mounted in DPX
mounting medium with cover slide.
2.6 Photomicrography and Image
Analysis
Records of the histopathological results were obtained
by photomicrography using digital photomicrographic
microscope (Olympus BX 41 and Olympus DP25
video camera) at the Anatomic Pathology Laboratory,
Department of Anatomic Pathology, Universitas
Sumatera Utara.
2.7 Statistical Analysis
Data was expressed as mean ± standard error of the
mean (S.E.M). The results were analysed using
Kruskall Wallis
followed by Mann-Whitney. p <0.5 was
considered significant.
3 RESULT AND DISCUSSIONS
3.1 Blood Gucose Level (BGL)
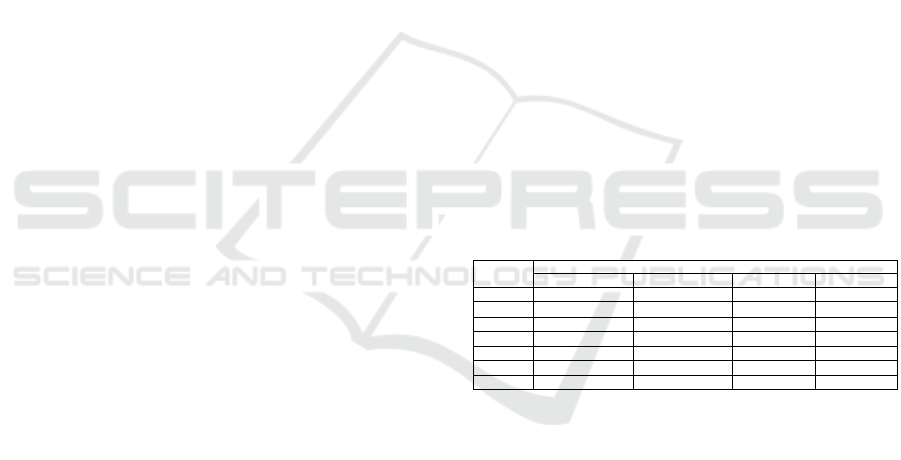
The effect of once daily oral administration of Sq on
the BGL is presented in Table 1. Administration of Sq
(160 mg/kg) showed significant blood glucose
reduction at day6 to day14 (p<0.05-0.01) compared
to DC-treated group. Metformin as the positive
control decreased the BGL significantly at day6 to
day14 as well (p<0.01). However, only NC-treated
groups showed significant different from day3-day14
(p<0.01).
Table 1. Effect of 14 days daily oral administration of
Squalene on the blood glucose level of SDR
BGL
(mg/dL)
Group
Sq M NC DC
BL
67.2 1.4* 75 2* 80 4.8 80.8 2.2
Day0
327 9** 354.8 24** 79 5.1** 249.6 14.6
Day3
280.4 10.8 271.8 15.9 81.2 3.7** 284.4 8.5
Day6
241.4 16.8* 181.8 24.7** 81.4 3.9** 293.6 17.6
Day9
184 11.7* 144.2 14.2** 79.4 3.4** 300.2 10.9
Day12
136.2 9.2* 108.4 8.2** 81 4.1** 307 20
Day14
85.2 1.6** 80.4 5.7** 78.4 4** 318.4 26
Data is expressed as mean S.E.M, n=5.*p<0.05, **p<0.01, ***p<0.001versus DC.
Sq has been reported in several studies as one of
compounds found in the plants that have
antihyperglycemic activity (Baskar et al, 2011;
Jananie et al, 2011; Widyawati, 2015b; Ragasa et al,
2014). The present study support the previous study
that showed dose-dependently antihyperglycemic
activity of Sq (Widyawati, 2015b). However, the
present study evaluate the effect after 14 days
treatment that longer than the previous study.
3.2 Evaluation of the islets of
Langerhans (iL)
Figure 1 shows a digital visualization of H & E
staining of normal pancreas rat. The islet of
Langerhans (IL) was clearly distinguished from the
surrounding exocrine tissue by a continuous
ICEST 2018 - 3rd International Conference of Computer, Environment, Agriculture, Social Science, Health Science, Engineering and
Technology
484
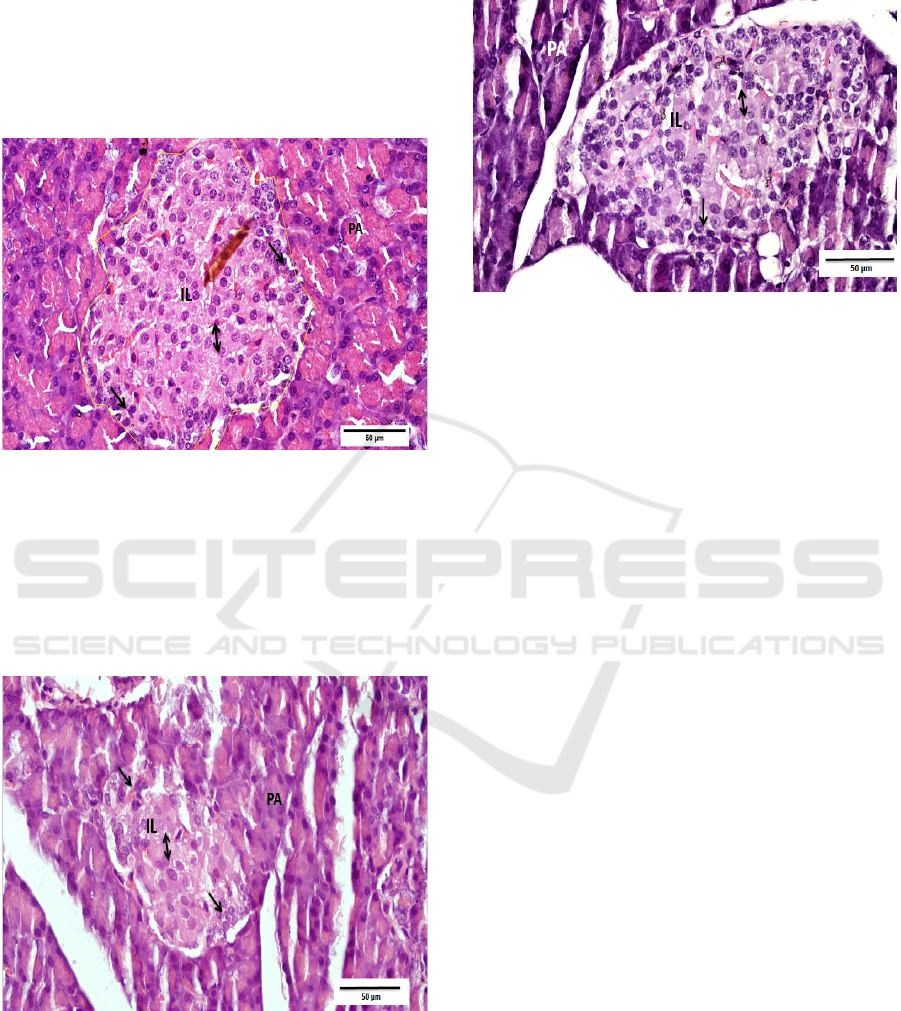
conncetive tissue capsule. Exocrine area is the area
outside of the IL. The islet cells were appeared
rounded with prominent blue-black nuclei and
various light pink cytoplasma. The figure 1 also
shows the IL with granulated cytoplasm of islet cell
with small, dark nuclei on the peripheral (alpha-cells),
and with light and large nuclei (beta-cells), and
pancreatic acinus (PA).
Figure 1. Histological appearance with H&E staining of the
islet of Langerhans of normal rats (40x10 magnification).
*alpha-cells (arrow), beta-cells (double arrow), pancreatic
acinus (PA)
Figure 2 shows a digital visualization of H & E
staining of DC-treated pancreas rat. The figure shows
that the size of IL of a diabetic rat decreased of size
and the outline was irregular and shrinked.
Figure 2. Histological appearance with H & E staining of
the islet of Langerhans of diabetic control rats (40x10
magnification).
*alpha-cells (arrow), beta-cells (double arrow), pancreatic
acinus (PA)
Figure 3 shows a digital visualization of H & E
staining of Sq-treated pancreas rat. The figure shows
the nearly regular outline of an IL with apparently
normal appearance of most cells.
Figure 3. Histological appearance with H&E staining of the
islet of Langerhans of SQ-treated rats (40x10
magnification).
*alpha-cells (arrow), beta-cells (double arrow), pancreatic
acinus (PA)
H & E staining at the present study revealed
significant changes in the general histological
organisation of the pancreatic tissue between NC and
DC (Figure 1 & 2). The STZ-demonstrated its ability
to destroy the structure of pancreatic IL following
STZ administration. The IL clearly seen in both
normal and diabetic rats. It was due to the
surrounding exocrine cells that were not affected by
the induction (Razak et al., 2010). In NC, the IL
featured circular shape with regular cell lining and no
degenerated cells were observed. This appearance
support the previous reported studies by Juarez et al.,
(2012) and Andrade-Cetto et al., (2008). On the other
hand, DC showed a different histological changes of
IL. The IL showed a shrunk with degeneration of islet
cells. Treatment with Sq at the dose of 160 mg/kg
restored the histological appearance of the IL as the
outline and most of cells appeared nearly regular and
normal.
4 CONCLUSIONS
Squalene have anti-hyperglycemic activity and
pancreatic protective effect in STZ-induced diabetic
rats.
Conflict of Interest Statement
The authors declare that there are no conflicts of
interest.
Antihyperglycemic and Pancreatic Protective Effect of Squalene in Streptozotocin-induced Diabetic Rat
485

REFERENCES
Andrade-Cetto, A., Becerra-Jiménez, J., Cárdenas-
Vázquez, R., 2008. Alfa-glucosidase-inhibiting activity
of some Mexican plants used in the treatment of type 2
diabetes. Journal of ethnopharmacology, 116(1): 27-32.
Bhaskar, A., Nithya, V., Vidhya., V.G., 2011.
Phytochemical evaluation by GC-MS and
antihyperglycemic activity of Mucuna pruriens on
streptozotocin-induced diabetes in rats. Journal of
Chemical and Pharmaceutical Research, 3: 689-696.
Janani, R.K., Priya, V., Vijayalakshmi, K., 2011.
Phytoconstituents evalauation by GC-MS and anti-
hyperglycemic activity of Cynodon dactylon on
streptozotocin-induced diabetes in rats. Journal of
Chemical and Pharaceutical Research, 3 (4): 460-466.
Juárez-Rojop, I. E., Díaz-Zagoya, J. C., Ble-Castillo, J. L.,
Miranda-Osorio, P. H., Castell-Rodríguez, A. E.,
Tovilla-Zárate, C. A., Bermúdez-Ocaña, D. Y., 2012.
Hypoglycemic effect of Carica papaya leaves in
streptozotocin-induced diabetic rats. BMC
Complementary and Alternative Medicine, 12(1): 236.
Razak, A., Mariam, A., Amirin, S., Mohd Zaini, A., 2010.
Assessment on functionality and viability of β cells
following repetitive dosage administration of ethanolic
extracts of Andrographis paniculata on streptozotocin-
induced diabetic rats. International Medical Journal,
9(1): 21-26.
Ragasa, C. Y., Torres, O. B., Shen, C. C., Lachica, M. K. E.
G., Sulit, A. B., Chua, D. B. D. L., Raga, D. D., 2014.
Triterpenes from the Leaves of Syzygium
polycephalum, S. cumini, and S. samarangense.
Chemistry of Natural Compounds, 50(5): 942-944.
Ramadan, B. K., Schaalan, M. F., Tolba, A. M., 2017.
Hypoglycemic and pancreatic protective effects of
Portulaca oleracea extract in alloxan induced diabetic
rats. BMC complementary and alternative medicine,
17(1): 37.
Widyawati, T., Yusoff, N. A., Asmawi, M. Z., Ahmad, M.,
2015. Antihyperglycemic effect of methanol extract of
Syzygium polyanthum (Wight.) leaf in streptozotocin-
induced diabetic rats. Nutrients, 7(9): 7764-7780.
Widyawati, T., 2015. Anti-diabetic activity-guided studies
of Syzygium polyanthum (Wight) leaf extracts and
elucidation of their mechanisms of cction (Doctoral
dissertation, Universiti Sains Malaysia).
Yusoff, N. A., Lim, V., Al-Hindi, B., Abdul Razak, K. N.,
Widyawati, T., Anggraini, D. R., Asmawi, M. Z., 2017.
Nypa fruticans Wurmb. Vinegar’s aqueous extract
stimulates insulin secretion and exerts hepatoprotective
effect on STZ-induced diabetic rats. Nutrients, 9(9):
925.
ICEST 2018 - 3rd International Conference of Computer, Environment, Agriculture, Social Science, Health Science, Engineering and
Technology
486
