
Analysis of Land Conversion and Function of Rice Production
Increase Efforts in Padangsidempuan City, North Sumatra
Nurliana Harahap
1*
, Ameilia Zuliyanti Siregar
2
and Yuliana Kansrini
1
, Ali Jamil
3
1
College of
Agriculture Extension Medan (STPP Medan), Jalan Binjai Km 10 Medan,
Sumatera Utara and Postgraduate Student in University Negeri Medan,
2
Department of Agrotechnology, Universitas Sumatera Utara, Jalan Dr A.Sofyan No 3 Medan, 20155, Sumatera Utara
3
Directorate of Food Crops, Ministry of Agriculture Republic of Indonesia,
Keywords: Conversion of Land, Production Rate, Paddy.
Abstract: Agricultural land conversion is caused by internal factors (urban growth, demography and economy); Internal
factors (age, age, education level, number of dependents, dependence of land), and regulatory factors that
affect growth, especially agricultural sector. The purpose of this study is to determine the factors and
magnitude of the influence of each independent variable (X) on conversion of landeconomics give influence
equal to 42,5%, while internal variable (X2) that is age, age, education level, land dependence gives 38.0%
value and regulation variable (X3) as much as 20.4%. The rate of land transfers in Padangsidempuan city is
high, about 3% per year so that the area of rice field in 2012 is 4,145 hectares which is estimated in 2033 to
live 1,616 Ha. It is expected that local government of Padangsidempuan do socialization, implication and
evaluation of land use change in Padangs (Y). This research used survey method conducted in September
2017 until December 2017 to 45 farmers of respondents in six sub-districts in Padangsidempuan City, namely
Padangsidempuan (Ps) Utara; Ps. Tenggara; Ps. Selatan; Ps. Batunadua; Ps.Timur ; a and Ps. Angkola Julu.
The data collected were analysed in combination, descriptively and regression analysis. The results showed
independent variables (X) influence the significance of the variable Y with the value of F (2.45) = 4.714, p
<0.05). Furthermore, there are real influence from each variable, that is: external variable (X1) consist of
urban growth, demography and idempuan City, Northof Sumatera.
1 INTRODUCTION
The continued growth of the population and the rapid
development of the city and the rapid development of
all sectors will be a challenge in terms of fulfilling
food needs. More and more people will need
increasing food needs, while on the other hand is not
followed by the addition of new or printed areas of
new rice fields. In 2013,the number of Indonesian
population reached more than 240 million people and
North Sumatra Province according to BPS data 2014
amounted to 13,766,851 people spread in 33 districts
/ cities in North Sumatra. The area of rice field in
North Sumatera in the period of 7 years (2010- 2017)
continues to decrease that can be seen in 2010
reduced to 115,961 hectares, 2011 again decreased to
115,897 hectares, 2012 again reduced to 109,585
hectares, 2013 decreased again to 93.338 hectares,
and in 2014 live 87,594 hectares.
North Sumatera Province in 2016 is one of the
provinces of food centres in Indonesia as occupying
the position of no 4 nationally producing food sources
of rice in Indonesia after West Java, Central Java and
East Java. The amount of rice production in North
Sumatera province reaches 4,610,097 tons, an
increase from 2015 from 4,044,829 tons, which
means an increase of 13.96% (Data of Agriculture
Office of North Sumatra, 2016). The achievement of
this increase in production may in the next few years
not be achieved due to the very high land conversion
in the region. According to (BPS, 2015) in the
Province of North Sumatra there has been an average
land conversion of about 10,000 ha/year. This figure
is quite high when compared with other provinces.
Land is a strategic natural resource for
development. Almost all physical development
sectors require land, such as agriculture, forestry,
housing, industry, mining and transportation. In
agriculture, land is a very important resource, both for
Harahap, N., Siregar, A., Kansrini, Y. and Jamil, A.
Analysis of Land Conversion and Function of Rice Production Increase Efforts in Padangsidempuan City, North Sumatra.
DOI: 10.5220/0010042103030311
In Proceedings of the 3rd International Conference of Computer, Environment, Agriculture, Social Science, Health Science, Engineering and Technology (ICEST 2018), pages 303-311
ISBN: 978-989-758-496-1
Copyright
c
2021 by SCITEPRESS – Science and Technology Publications, Lda. All rights reserved
303

farmers and for agricultural development. This is
based on the fact that in Indonesia agricultural
activities are still based on land (land based
agriculture activities). Land has become one of the
main elements in supporting the continuity of life
since humans first occupy the earth. Land serves as a
place of human activity to maintain existence. The
first activity is the use of land to grow crops.
Land use change may occur due to changes in the
spatial plan of the region, the wisdom of development
direction and due to market mechanism. The last two
things happen more often in the past because of the
lack of understanding of society and government
officials on spatial planning. The alignment of
agriculture to non agriculture occurs widely in line
with development policies that emphasize growth
aspects through the ease of investment facilities, both
to local and overseas investors in the provision of land
(Widjanarko, et al, 2006).
Padangsidempuan is one of the potential areas of
food agriculture land in North Sumatra province that
has IP> 2.7 and even occupies the position of no 1 in
Indonesia with rice field area of 4,045 Ha with
productivity level of 6 tons / ha so that in recent years
Padangsidempuan City still self-sufficient in food,
especially rice. On the other hand in the achievement
of rice production has a serious enough obstacle that
there is a significant reduction of productive
agricultural land from year to year although the
Government of Padangsidempuan City has poured
the Regional Regulation Padangsidempuan No. 04 of
2014 About Spatial Plans Padangsidempuan City
including the arrangement of the area agriculture and
plantation and Decree of Mayor of Padangsidempuan
Number 86/KPTS/ 2015 on Sustainable Agriculture
Land In the City of Padangsidempuan. According to
data from the Agriculture Department of
Padangsidempuan City 2015 which states that there is
a land transfer of 2-3% per year even though it has
issued regulations through Regulation but this still
can not be prevented. This is due to various reasons
including demographic factors such as population
growth, urban development and also economic and
social reasons.
Based on the description of the problem of this
condition is the basis of the author in determining the
variables to be tested through research activities while
other factors that are minor are not described in detail
but supported descriptive data from the field. This
research aims to :
1. Analyzing the factors that affect of land
conversion and function in the research area
2. Analyzing the rate of land conversion and
function in Padangsidempuan City
2 RESEARCH METHODOLOGY
The study was conducted in Padangsidempuan for
four months starting from September to December
2017 with seven sub-districts covering the Southeast
Padangsidempuan Subdistrict consist of P. Selatan, P.
Batunadua, P. Utara, P. Hutaimbaru and P. Angkola
Julu. This research is classified as the type of
quantitative research in the form of calculations
analysed by using statistical analysis and the method
used in the survey method (Mardikanto, 2006).
Primary data collection is done by spreading the
quisioner to the respondent.
Each of the variables tested both independent (X)
and dependent (Y) by using ordinal data types and
using Likert scale. The Quisiner tested was developed
based on predetermined indicators. Variable X1
(External Factor) consisting of urban growth factor,
demography and economy, X2 Internal Factor)
consisting of age, education, dependent amount, land
ownership and dependence on land and X3
(Regulation) form of regulation and weakness of
regulation. All the variables tested were rated by
using the Likert Scale with 4 levels of scale and the
type of data used were ordinal data. Variable Y (Land
Acquisition Rate) is measured by the indicator
determined.
Sampling was conducted on 45 farmer
respondents who randomly understood about the land
they manage and experienced land conversion,
whether it is farmer owner, tenant or rent. To know
the factors that affect the Land Use in the City of
Padangsidempuan this is done with the analysis of the
axes of arithmetic along with the following
mathematical formulas:
Y = a + b1X1 + b2X2 + b3X3 + μ
Information :
Y: Land Acquisition Rate
X1: External factors
X2: Internal factor
X3: Regulation / policy
To know the suitability of model of analysis of
these factors used coefficient of determination (R2)
and F test (whole test). The value of determination
(R2) is to know the accuracy of the model used shows
the amount of the ability of independent variables
explain the effect on the dependent variable,
expressed by what percentage of dependent variable
is explained by the independent variable entered into
the regression model. The value of R2 ranges from 0
to 1 and if the result is close to 1, then the model is
said to be good.
The coefficient of determination is formulated as
follows:
ICEST 2018 - 3rd International Conference of Computer, Environment, Agriculture, Social Science, Health Science, Engineering and
Technology
304
R
2
=
Tot
REg
SS
SS
or
2
2
^
2
)(
)(
YYi
YY
R
Information:
Y '= The estimated value of the dependent
variable
Y = Average value of the dependent variable
Yi = Observation value
R2 = Coefficient of Determination
Test F is used to determine the level of influence of
all independent variables (X) together to the
dependent variable (Y) or to determine whether the
independent variable (X) together affects the
dependent variable (Y).
F table = (k-1), (n-k): α
Information:
R2 = Coefficient of determination
k = Number of regression coefficients
n = Number of samples
α = Critical value
3 RESULTS AND DISCUSSIONS
3.1 Respondent's Characteristic
Based on the results of research conducted that the
number of respondents as much as 45 farmers who
are farmers who have transfer land floor both owners,
tenants and tenants with characteristics of
respondents consist of age, last education, gender,
land area, land ownership status and cropping
frequency IP) in detail can be described as follows.
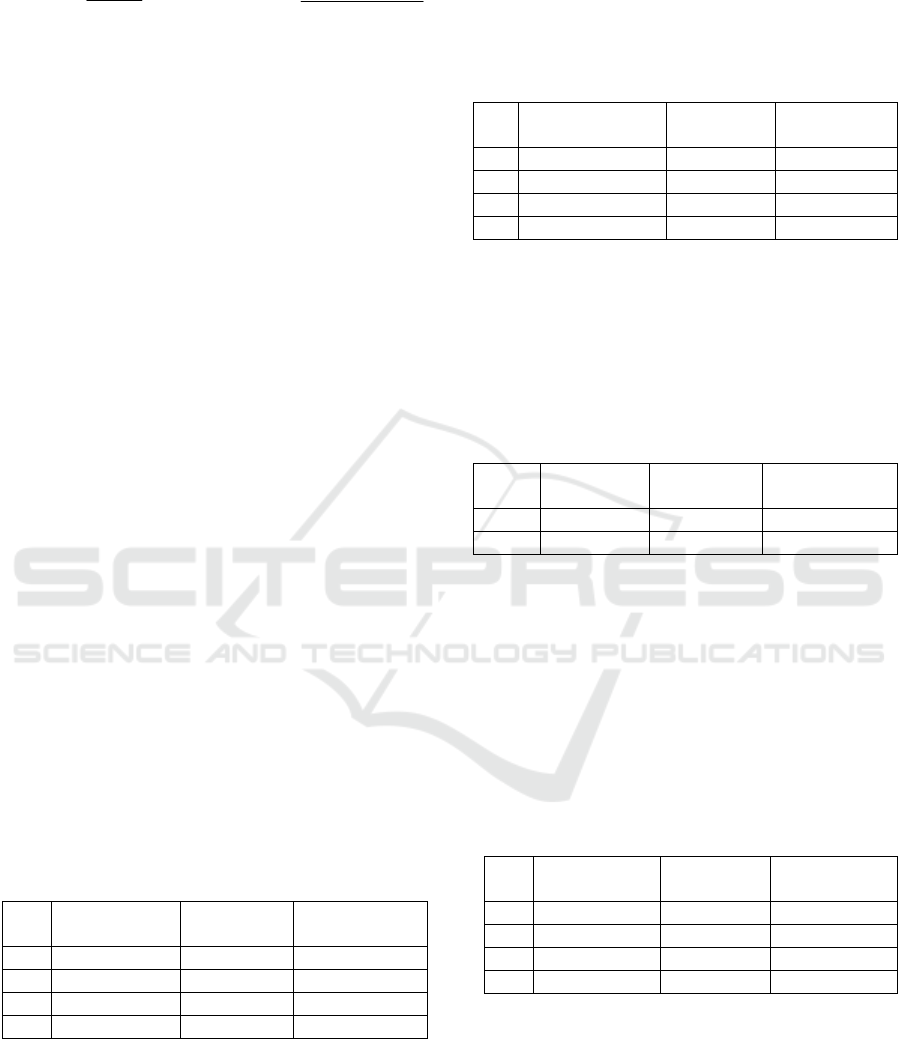
a. Ages
Table 1. Respondents distribution based on ages
No Ages
Criteria (year)
Quantity
(person)
Percentages
(%)
1 25 – 37 9 20
2 37,5 – 50 20 44,44
3 50,5 – 62 10 22,22
4 62,6 – 75 6 13,33
Source : Primer data (2017)
Based on table 1 can be concluded that it can be
concluded that most farmers are still classified as
productive age. This can be seen from 45 respondents
39 farmers (86.67%) is still classified as productive
age. This means that farmers in the age range 25 - 62
years can still do good farming, especially planting
rice paddy fields.
b. Education
Table 2. Respondents distribution based on education
No Education
Criteria (year)
Quantity
(person)
Percentages
(%)
1 Primary School 9 20
2 Secondary School 10 22,22
3 High School 21 46,67
4 University 5 11,11
Source : Primer data (2017)
Based on table 2 can be concluded that the level of
education of farmers most respondents can be said to be
quite good. It can be seen from all respondents there are
57.77% educated from high school and university.
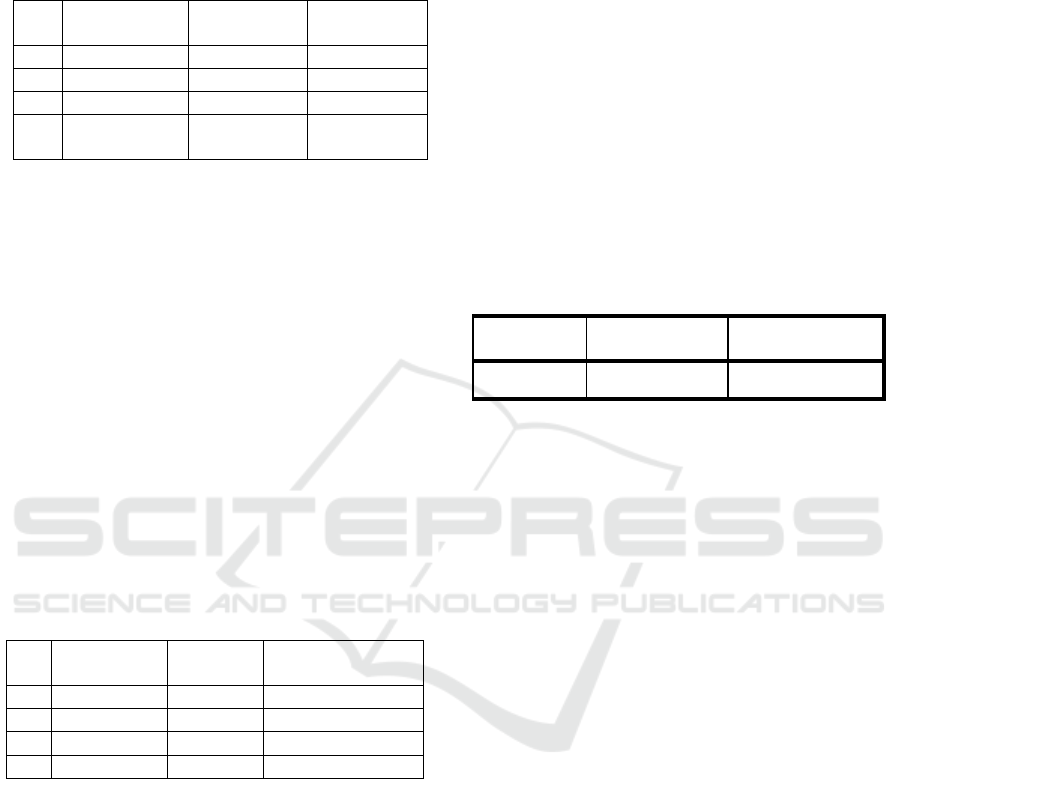
c. Gender
Table 3. Distribution of respondents by sex
No Sex Quantity
(person)
Percentages
(%)
1 Male 37 82,22
2 Female 8 17, 78
Source : Primer data (2017)
Based on table 3 it can be concluded that the
farmers of respondents in general are male (82.22%)
and 17.78% have female gender. In this region, the
father is more dominant in carrying out the farming
business, although at certain stages in doing women's
in the rice field of business is more dominant such as
planting and weeding weeds.
d. Land Area
Table 4. Distribution of respondents based on land area
No Land Area
(Ha)
Quantity
(person)
Percentages
(%)
1 0,1 – 0,5 25 55,55
2 0,6 – 1,0 15 33,33
3 1,1 – 1,5 4 8,88
4 > 1,6 1 2,22
Source : Primer data (2017)
Based on table 4 it can be concluded that the
farmers of the respondents have a small enough land
to be managed ie between 0.1 - 0.5 Ha and this is more
dominant (55.55%), which has a land of 0.6 to 1.0)
while those who have land more than 1.1 Ha only a
small part of 11.1% or 5 people from 45 respondents.
Analysis of Land Conversion and Function of Rice Production Increase Efforts in Padangsidempuan City, North Sumatra
305
e. Status of Land Ownership
Table 5. Distribution of respondents based on land
ownership status
No Status of Land
Ownership
Quantity
(person)
Percentages
(%)
1 Rent 17 37,77
2 Owner 26 57,77
3 Working on 1 2,22
4 Rent + Working
on
1 2,22
Source : Primer data (2017)
Based on table 5 can be seen that the farmers of
respondents who own their own land that is 26 people
(57.77%) while the farmers who rent and cultivate
that is 42.23%. In terms of land ownership, farmers
are more dominant to own paddy fields, but the land
is very narrow (0.1 to 0.5 Ha) owned by 55.55 of the
total respondents. This means that the land owned by
farmers is not sufficient to meet the needs of life when
making farmers as the main income. Based on the
results of interviews with respondents that the farmers
who still cultivate their own land is generally not only
work farming but have other jobs outside farmers
such as buildings, trade, workshops, rickshaw and
other attractions.
f. Planting Frequency
Table 6. Distribution of respondents by frequency of
planting
No Frequency of
plants
Total Percentages
1 1,0– 1,5 - -
2 1,6 - 2 4 8,89
3 2,1 – 2,5 8 17,77
4 2,6 – 3,0 33 73,33
Source : Primer data (2017)
Based on table 6 it can be concluded that most
farmers in Padangsidempuan City have an
intercropping frequency of between 2.6 - 3 per year,
in the sense that the farmers in this area have done
intensive cultivation. Conditions like this can be said
farmers have been empowering the land optimally.
Based on interviews with farmers that the intensity of
planting or the frequency of planting is quite high due
to the condition of water sufficient for cultivation and
other factors ie the land managed by the farmers are
mostly rent and rental system is the rental system per
year, so with this rental system farmers seek to
manage continuously in order to gain profit.
3.2 Factors Affecting of Land
Conversion and Function
a. The influence of the joint (compound) variable X to
Y
To see the magnitude of the effect of variable
X to Y where the variable X consists of external
variables (X1) consisting of three sub variables
namely urban growth, demography and economy,
while the internal variable (X2) consists of 5 sub-
variables namely age, education, , land area and
dependence on land and Regulation Variable (X3)
consisting of two sub variables namely Form of
policy and weakness of Implementation of regulation.
the results can be seen based on the calculation in the
Summary Model shown by the R square value.
Model Summar
y
R S
q
uare Ad
j
usted R S
q
uare
Std. Error of the
Estimate
,638 ,407 2,28601
a. Predictors: (Constant), Weaknesses Legal Aspects,
Economic Factors, Land Area, Land Dependency,
Demography, Forms of Policy, Development of City,
Education, Quantity of Families, and Ages.
The magnitude of R square (r2) is 0.638. This
number indicates that the bears influence variables
X1, X2 and X3 on the rate of land use by calculating
the coefficient of determination (CD) with the
following formula:
CD = r2 x 100%
= 0.638 x 100%
= 63.8%
This figure explains that the effect of variables
X1, X2 and X3 to the rate of land transfer is 63.8%,
while the remaining 36.2% (100% - 63.8%) is
influenced by other factors. In other words, the
variable rate of land transfer can be explained using
X1 (external), X2 (internal) and X3 (regulation)
variables of 63.8% while 36.2% influence is caused
by other variables outside of this model.
To know the effect of shared variable X to Y can
be seen by comparing the value of F arithmetic with
F table. Based on the analysis results obtained F
calculated value of 4.714 while the value of F table of
2, 018. Value 4.714> 2.018, it can be concluded F
arithmetic> F table, so Ho is rejected and H1
accepted. This means that there is a linear relationship
between external, internal and regulatory variables on
land conversion. The conclusion is that the external,
internal and regulatory variables jointly affect the rate
of land transfer function is 63.
ICEST 2018 - 3rd International Conference of Computer, Environment, Agriculture, Social Science, Health Science, Engineering and
Technology
306
ANOVA
b
Model
Sum of
S
q
uares D
f
Mean
S
q
uare F
Sig
.
Re
g
ressio
n
89,566 10 9,957 4,714 ,000
a
Residual 177,678 34 2,3,226
Total 267,244 44
Predictors: (Constant), Weaknesses Legal Aspects,
Economic Factors, Land Area, Land Dependency,
Demography, Forms of Policy, Development of City,
Education, Quantity of Families, and Ages.
b. Partial influence of variable X to Y
To see the magnitude of the effect of Partial
Variable X (X1, X2 and X3) on Y conversion of land
level individually or partially used T test while to see
the total influence (contribution) each variable can be
used Beta number or Standardized Coefficient can be
seen based on the results of the analysis as follows:
Coefficients
a
Model
Unstandardized
Coefficients
Stan
dardized
Coefficie
nts
t Si
g
.B
Std.
Erro
r
Bet
a
Constan
t
15,691 2,202
4,939 ,000
External
6,012 ,089 ,425 3,131 ,003
Internal
5,035 ,072 ,380 3,489 ,003
Regulation
3,060 ,094 ,204 2,365 ,005
a. Dependent Variable: Level of Land function
conversion.
Based on the analysis of the resulting data, then
obtained Model Regression equation as follows:
Y = a + bX1 + bX2 + BX3 + €
Y = 15,691 +6,012,060 X
1
+ 5,035 X
2
+ 3,060 X
3
+ €
From the calculation results obtained T count of
4.939 and the value of t table 2.08. If the value of t
arithmetic> t table, then the independent variable (X)
gives influence positive on the dependent variable
(Y). In detail the partial effect of each variable seen
from the value of t count of each X1 of 3, 131, X2 of
3.489 and X3 of 2,365. The t value of the three
variables is greater than the value of t-table (2.018),
meaning that the variables X1, X2 and X3 give a
significant influence on Y. To see how much partial
influence of each variable can be seen from the value
of standardized coefficient beta for each variable
where the variable X1 of 0.425 means that the
external variable gives an influence are 42.5% to
variable Y or land function conversion conversion,
variable X2 of 0.380 or 38.0% and X3 value 0.204 or
20.4% influence on land transfer.
When analysed partially from each sub variable,
then the influence of partial can be seen in table 7
below:
Table 7. The influence of partial
Coefficients
a
Model
Unstandardiz
ed Coefficients
St
andardiz
ed
Coefficie
nts
T Sig.B Std. Erro
r
Beta
(Constant) 23,33
4
5,401
4,320 ,000
Development of
cit
y
(
X1.1
)
,388 ,164 ,225 2,361 ,001
e
mo
g
ra
p
h
y
(
X1.2
)
,306 ,329 ,158 ,929 ,003
Economy factor
(
X1.3
)
,245 ,171 ,169 1,432 ,002
A
g
es
(
X2.1
)
,230 ,273 ,076 -,843 ,405
d
ucation (X2.2) ,557 ,248 ,114 2,246 ,004
Total of family
cost
(
X2.3
)
,110 ,275 ,079 ,402 ,006
Area
(
X2.4
)
,263 ,197 ,165 1,337 ,002
Land
degradation
(
X2.5
)
,111 ,211 ,097 ,524 ,005
Policies
(
X3.1
)
-,017 ,192 -,015 -,089 ,009
Legal weakness
(X3.2)
,237 ,169 ,139 1,401 ,004
a. Dependent Variable: Rate of Land conversion
Function
Based on the results of the analysis obtained that
sub variable X1.1 gives the most dominant influence
when compared with the influence of other sub
variables. This is evidenced by the value of
Standardized Coeffient Beta X1.1 of 0.225 means sub
variable of urban growth become the highest cause
factor of land transfer. With the rapid growth of the
city requires land for development in all sectors be it
the education sector, economy and tourism. Based on
data in the field that Padangsidempuan Batunadua
Sub-district experienced a fairly high land conversion
because it is directly adjacent to the city center and a
strategic position as the centre of economic activity
as business development. After urban growth factor
followed by sub variable factor X1.3 (16,9%), X2.4
(land area) equal to 16,5%, and X3.2 (weakness of
legal aspect) equal to 13,9%.
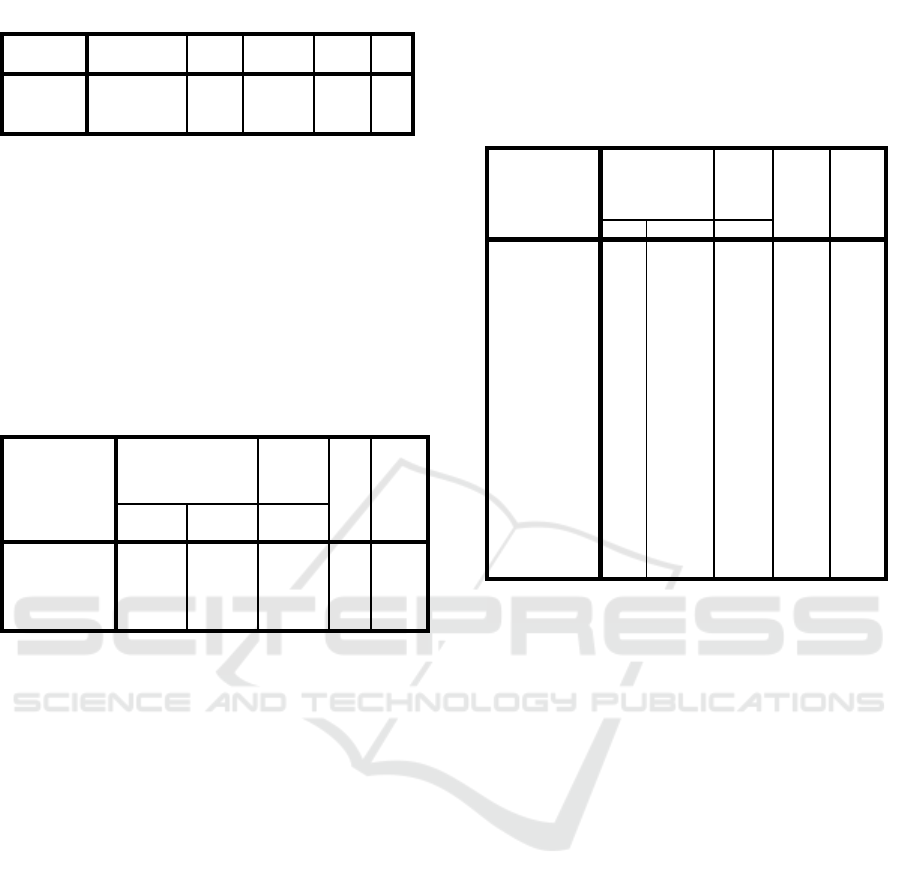
3.3 Condition of Land Conversion
Function
Based on data from BPS Kota Padangsidempuan
(2016) obtained data of land area from 2012 to 2016.
Details can be seen in table 8 below.
Analysis of Land Conversion and Function of Rice Production Increase Efforts in Padangsidempuan City, North Sumatra
307
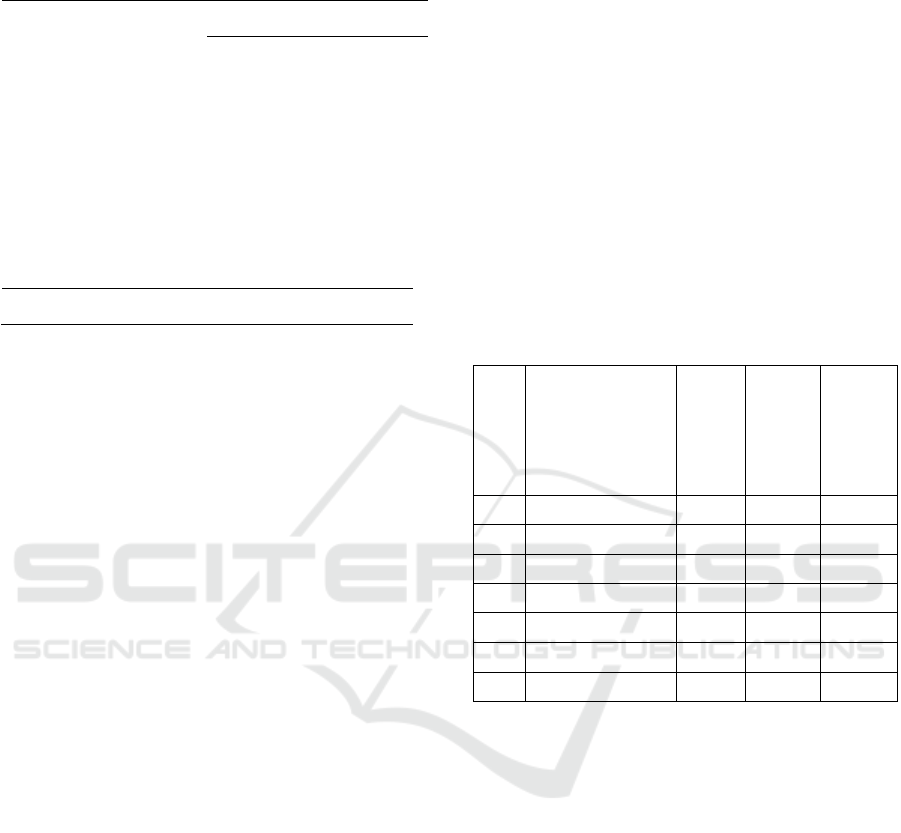
Table 8: Padangsidempuan city land size (BPS, 2016)
(Data reduction of land during 2012 s/d 2016)
Districts
Land areas (BPS Data)
2012 2013
0
14
0
15 2016
Ps. Tenggar
a
736 736 736 699 699 37
Ps. Selata
n
173 173 173 173 173 0
Ps. Batunadu
a
1.065 1.065 1.065 610 610
45
5
Ps. Utar
a
337 337 337 333 333 4
Ps. Hutaimbar
u
849 849 849 837 837 12
Ps. An
g
kola Jul
u
885 885 885 514 514
37
1
Total 4.045 4.045 4.045 3.166
3.16
6
87
9
Sources : Primer Data ( 2017)
Based on data obtained from BPS in table 8 it can
be concluded that in 2012 the area of paddy fields in
Padangsidempuan City is 4.045 Ha and in 2016 the
land area of 3,166 Ha. Based on this data, it can be
seen that in Padangsidempuan City there is a
reduction of land in other words there is a land
conversion of 879 ha or 15% of the total rice field area
in 2012. This means that within 5 years there is an
average land reduction of 3% per year. The rate of
land transfers in Kota Padangsidempuan is high and
if this can not be overcome, it will be a threat to the
region in the fulfilment of food availability,
especially rice.
The use of agricultural land to avoid overturning
of land especially sustainable agriculture seems
inevitable with the rapid development of the city so
that local governments also support efforts prevention
of land function through regulation or policy as
outlined through Local Regulation
Padangsidempuan. 04 of 2014 on Spatial Planning of
Padangsidempuan City Year 2013-2033. In the
Regional Regulation as set forth in Article 41 on the
Area of Allotment of Agriculture, it is stipulated that
the plan of the designated area of agriculture shall
consist of the area of food crop agriculture and the
horticultural cultivation area. More areas of wetland
farming are agriculture crops of approximately
1,618.87 Ha including:
a) Southeast Padangsidempuan District covering an
area of approximately 444.21 Ha
b) Padangsidempuan Batunadua Subdistrict of
approximately 185.75 Ha
c) Padangsidempuan Angkola Sub-district of
approximately 403.49 Ha
d) District of Padangsidempuan Selatan covering
approximately 13.69Ha
e) North Padangsidempuan Subdistrict of
approximately 71.55 Ha
f) Padangsidempuan Hutaimbaru Sub-district of
approximately 500.18 Ha
In addition to Local Regulation no. 41 Year 2014
is also reinforced by the Decree of Mayor of
Padangsidempuan Number. 86 / KPTS / 2015 on
Sustainable Agriculture Land In the City of
Padangsidempuan. Extensive data on the standard of
sustainable agriculture land in accordance with city
regulation Padangsidempuan No. 4 of 2014 on Spatial
Planning Padangsidempuan City Year 2013-2033
namely:
Table 9: Data of Rice Field Area of Sustainable Food
Agriculture Based on Local Regulation of
Padangsidempuan City No. 4 of 2014 on Spatial Planning
of Territory City of Padangsidempuan Year 2013-2033
No Districts
Total
area
ricefield
in 2010
Year
(Ha)
Total
area
ricefield
in 2013
Year
(Ha)
Total
area
ricefield
until
2033
Year
(Ha)
1 Ps. Tenggara 736 699 444,21
2 Ps. Selatan 173 173 13,69
3 Ps. Batunadua 1065 610 185,75
4 Ps. Utara 337 334 71,55
5 P Ps. Hutaimbaru 849 837 500,18
6 Ps Ps. Angkola Julu 885 513 403,49
Total 4.045 3.166 1.618,87
Sources : Primer Data ( 2017)
Based on data from the Regional Agricultural
Office of Padangsidempuan City 2017 yag based on
Agricultural Statistics (SP) data that the area of rice
fields in 2017 is experiencing a fairly high land
reduction of about 100 ha, because the land area in
2016 of 3,166 Ha to 3,063, 72 Ha.
4 DISCUSSIONS
4.1 Respondent's Characteristic
Based on the characteristics of respondents as key
informants can be concluded that the farmers of
respondents in general are at the age of productive,
have a job and educated. According to table 1 it is
found that the farmers of respondents are generally
still belong to the productive age (88.67). Productive
conditions show that farmers physically are still able
to do good farming and can still choose the activities
ICEST 2018 - 3rd International Conference of Computer, Environment, Agriculture, Social Science, Health Science, Engineering and
Technology
308

they consider most profitable, including choosing to
convert land as it is considered more economically
profitable. In general, respondents have narrow land
(0,1 - 0,5 Ha) owned by 55,55% and 33, 33% have
land 0,6 -1,0 Ha. Based on the ownership of this land
can be concluded that the farming business can not be
used as the main income in living the family because
the results obtained are not able to meet the needs of
the family.
The area of land owned by the farmers of the
respondents is closely related to the level of
production produced. Based on the research results, it
is found that most farmers own their own land
(55.77%) and 33, 77% are rent. But on the other hand
the land owned by farmers is so narrow that it is
unable to meet the needs of the family. According to
research (Irnawati, 2006) that the income of paddy
farmers in meeting the needs of life is very dependent
on the success of rice crops in the effort. Land area as
one of production factor which is agricultural factory
which have big contribution to farming business, the
size of production from farming is influenced by the
narrow area of land used (Winarti, 2012).
According to Yayuk Yuliati, (2003: 32), that in an
agrarian society where his life is still dependent on
the production of land as a means of basic production
and has a homogeneous style in the livelihood of
farmers (Basrowi & Juariyah, 2010). To improve the
welfare of the community will not be achieved if the
peasant community does not have the keiginan to
increase agricultural production (Yardi et al., 2012).
This is in accordance with the essence of agricultural
development, the Indonesian government seeks to
change the application of technology in farming in the
hope of increasing productivity, business efficiency
and increasing farmer income (Welson et al., 2011).
In Mardikanto's opinion (2009) the educational
level of a person will greatly affect the ability or
mastery of the given material, the skills of choosing
an extension method and effective communication
techniques with (the community).
4.2 Factors Supporting Rice Land
Conversion and Function in
Padangsidimpuan City
Broadly speaking, the factors causing land transfers
in Kota Padangsidempuan are grouped into three
external, internal and regulatory factors (policies), in
which each grouping will be discussed in detail as
follows:
a. External Factors
Land conversion is closely related to increasing
population density. Rusli (1995) discloses that with
increasing population, the ratio of human-land
becomes larger, even though the utilization of every
inch of land is strongly influenced by the level of
cultural development of a society. Population growth
causes a shrinking average of land stock per person.
As the population grows, the unrestrained are
expected to grow. In this situation the heavy
population pressure provides an opportunity for the
development of land tenure forms that are less
favorable to the cultivators. Competition among
fellow farmers increasingly fierce in getting job
opportunities.
With the increase of population every year will
cause the activity of the population also increased
which require land for settlement while the
availability of land is more limited. Rapid population
growth will require increasing land, not only for
residential use but also as an extension of economic
activities to meet family needs. Therefore the
problem that will arise is the occurrence of land
conversion in the areas of rice
Farming. Many productive farms are switching to
the need to continue family life.
Poverty is closely related to employment
opportunities. Denser populations and with relatively
fast growth rates require rapid rates of growth and
employment growth as well. In the unemployment of
non-agricultural employment opportunities, and the
average supply of agricultural land per person has
been limited, not only some of the labour force has
been increasingly difficult to find employment, but
also many who are engaged in underemployment seen
from the number of hours worked as well as from the
very low income levels received. It is this kind of
situation that causes widespread poverty in certain
areas. Not surprisingly, looking at this condition,
people who own the smallest land are very likely to
be converted or sold in order to survive (Rusli 1995).
Economic growth is marked by a shift in the role
of inter-sectoral demands for the conversion of
agricultural land that number is not small. The case of
land transfers in Kota Padangsidempuan occurred in
areas that are directly adjacent to the city, such as in
Padangsidempuan Batunadua subdistrict, where 43%
of the landfill occurred within 5 years (2012 - 2016),
where the land area of 1,665 Ha in 2012 to 610 Ha in
2016 then followed by sub-district Padangsidempuan
Angkola Julu also experienced a fairly high land
conversion (42%) during the period of 5 years. This
can be seen in 2012 the total land area of 885 Ha and
in 2016 to 371%. Based on the facts in the field that
Analysis of Land Conversion and Function of Rice Production Increase Efforts in Padangsidempuan City, North Sumatra
309

rice fields are converted widely used for activities
supporting the economy such as building markets,
workshops, hotels and other trading activities. The
livelihoods of farmers who have been farmers are
slowly turning jobs because the farmland managed
has been reduced and the farmers or the wet land
owners prefer to sell the land because it has a higher
selling value and profitable when compared with
agricultural products.
b. Internal factors
Influence Internal variable of 38% to the land
conversion consisting of age factor, education,
dependent number, land area and land dependence.
Farmers respondents when viewed from the level of
education can be said to be high. It can be seen from
all respondents 46,67% have high school education
and 11,11% college. According to Mardikanto (2009)
the level of education will greatly affect the ability or
mastery of the given material, skills selecting
methods of counselling and communication
techniques effective with (the community).
Therefore, the higher the level of education owned by
the farmers, the higher the ability of farmers to
analyse the business to be run or managed, including
to choose the work to be cultivated, including the
farmers choose to transfer the land into a new
business or by selling and switching jobs.
Padangsidempuan city experienced a fairly rapid
development seen from the development of physical
development undertaken by the government. In the
increasingly modern era is not denied the younger
generation prefer to work in the field of industry and
office rather than working in agriculture. This causes
rural areas that move in agriculture lack of productive
energy, because left to the city. In addition, the
increased operational costs of farmland cultivation
also cause farmers to lose, so they prefer to switch
professions and sell their farms.
4.3 Regulation Factor (policy)
According to Suhadi (2012) that the implementation
of spatial planning is an important step to achieve the
goal of city spatial planning, because its
implementation in principle is a way for the policy to
achieve its objectives. In the absence of
implementation activities, the whole strategy of
utilization and management of city space is only to be
a planning document that is stored as an archive.
Legislation related to land conversion is Law No.
41 of 2009 on Sustainable Agriculture Land that was
broken down by local government of
Padangsidempuan city. 41 According to Widodo
(2011) argues that however clear and consistent are
the provisions and rules and however accurate the
delivery of those provisions, if the policy
implementers responsible for implementing the
policy lack the resources to implement the policy
effectively then the implementation of the policy will
not be effective.
According to data obtained in the field that there
is not much prevention effort that can be done by the
local government in Padangsidempuan City. As one
form of preventive measures on the spreading of the
landfill is poured through Mayor Regulation no. 86 of
2015 and No. 04 in 2014, but the implications of this
regulation are poorly implemented. This can be seen
from the lack of sanctions given to the actors of land
conversion. This condition is caused by two of the
most basic reasons of the lack of clarity of the rules
and the lack of sanctions on the recruitment. The
same is true of Isa (2014) that the system of
legislation and law enforcement of the rules that aa
still weak. Therefore, it is necessary to coordinate
between the government and the farmers or the
community so that the transfer of land in
Padangsidempuan can be prevented.
land of function conversion is a dilemma because on
the one hand the government must maintain irrigated
rice fields for food security can be realized. On the
other hand the need for land for development is
inevitable.
land of function conversion agricultural land in
general have a very big impact on the field of social
and economy. This can be seen as one of the changes
in land function conversion conversion. The
narrowness of agricultural land will cause many
problems in the short term or long term. The
implications of agricultural land conversion to socio-
economic life are complex. At the start of the
increasingly expensive food prices, the loss of
employment for farmers to the high number of
urbanization. In addition, the impact is the lack of
interest of young people to work in the field of
agriculture.
When viewed from the population of
Padangsidempuan City based on 2016 BPS data of
212,917 people with production of 6 tons / ha. Land
area in 2016 3.166 Ha, it will produce rice production
as much as 18.996 tons / Ha, IP in Padangsidempuan
city is 2.7 then total production is 51.298 tons per
year. If the yield is converted to rice with an average
yield of 60% then the amount of rice produced is
33.338 ton/year while the consumption of rice per
capita/year, predicted is 98.5 kg then the need for rice
is 209,723,245 kg/year or 209,723 tons. The results
of this production up to the current condition is still
ICEST 2018 - 3rd International Conference of Computer, Environment, Agriculture, Social Science, Health Science, Engineering and
Technology
310

able to meet the needs of the population but for how
in the future if no measures taken prevention of land
land conversion this will be a threat to rice production
intake in the city of Padangsidempuan.
5 CONCLUSIONS AND
RECOMMENDATIONS
5.1 Conclusions
Based on the results of the analysis carried out, then
obtained conclusion:
1. The external variables X1, the internal (X2) and the
regulation (X3) affect the rate of land transfer in
the city of Padangsidempuan and the contribution
of each variable in giving effect to the land
transfer rate (Y) The external variable is more
dominant (42,%%) , internal variables (38%) and
regulatory variables (20.4%) and more dominant
factors are external factors.
2. The rate of land transfer in Padangsidempuan city
reaches 3% per year from 2012 until 2016 there is
a drastic reduction of land so it is predicted that in
2033 the land area of Padangsidempuan will only
be 1,618.87 Ha.
5.2 Recommendations
There are a number of possibilities that can be
presented based on the results of this study:
1. To avoid problems of land transfer in
Padangsidempuan City, it is necessary to have
firmness and clarity of government rules related
to land conversion
2. Need to improve coordination between government
and community or farmers by conducting
socialization and coordination in a sustainable
manner
REFERENCES
Anonimus. 2013. Agricultural Land Statistics 2009 - 2013.
Ministry of Agriculture of the Republic of Indonesia.
Jakarta.
Anonimus. 2015. Central Bureau of Statistics of the
Province of North Sumatra.
Isa, Iwan. 2014. Strategy for Controlling Land Use
Alihfungsi. National Land Agency.
Lestari, T. 2009. Impact of Agricultural Land Conversion
for Farmers' Lives. Essay. Bogor. Bogor Agricultural
Institute
Nasoetion, Winoto. 1996. The Problem of Land Function
Functionalities of Agriculture and Its Impact on the
Continuity of Food Self-Sufficiency. In Workshop
Proceedings: Competition in the Utilization of Land
and Water Resources: Its Impact on Rice Self-
Sufficiency Sustainability. Result of Cooperation of
Center for Agricultural Socio Economic Research with
Ford Foundation. Bogor.
Narbuko, C and Abu Achmadi. 2007. Research
Methodology. Earth Script. Jakarta.
Rauf, A.H. 2010. Transfer of Agricultural Land Function
to Land of Sugarcane Plantation and Its Impact on
Rural Community (Case Study of Social Change of
Farmers in Kecamatan Tolangohula Kabupaten
Gorontalo). Dissertation, Gorontalo
Suhadi. 2012. Influence Factor and Implication of Spatial
Detail Plan of Gunungpati Subdistrict of Semarang
City to Land Transfer function. Journal of Pandecta.
Sugiyono. 2008. Understanding Qualitative Research.
Bandung: Alfabeta
Slamet, M. 2003. Establishing Patterns of Human Behavior
Development. IPB Press. Bogor.
Sukino. 2013. Building Agriculture With Farmer
Communities Empowerment. New Press Library.
Yogyakarta.
Widjanarko, B. S. 2006. Land aspect in controlling the
distribution of agricultural functions (rice field),
Jakarta. BPN Research and Development Center.
Winarti, E, T., and Mulyo, A, S. 2012. Development of
Agricultural Land and Agricultural Land Improvement
through Agricultural Technology Renewal. Journal.
Journal of Agriculture. 3 (2), 21-45
Analysis of Land Conversion and Function of Rice Production Increase Efforts in Padangsidempuan City, North Sumatra
311
