
Learning and Extracting Priori-driven Representations
of Face Images to Understand the Human Visual
Recognition System
Carlos E. Thomaz
1
, Gilson A. Giraldi
2
, Duncan F. Gillies
3
, and Daniel Rueckert
3
1
FEI University Center, Sao Paulo, Brazil
2
National Laboratory of Scientific Computing, Rio de Janeiro, Brazil
3
Imperial College London, U.K.
Abstract. Faces are familiar objects that can be easily perceived and recognized
by humans. However, the computational modeling of such apparently natural and
heritable human ability remains challenging. This chapter shows theoretical and
empirical results about the processes underlying face perception using frontal
and well-framed images as stimuli. Exploring eye movements of a number of
participants on distinct classification tasks, we have implemented a multivari-
ate statistical method that combines variance information with focused human
visual attention. Our experimental results carried out on publicly available face
databases have indicated that we might emulate the face perception processing as
a pattern-based coding scheme rather than a feature-based one to properly explain
the proficiency of the human visual system in recognizing face information.
1 Introduction
Similarities between facial images can be described as a high dimensional and sparse
statistical pattern recognition problem well addressed by humans but with non-trivial
scientific issues related to feature extraction and automatic coding of relevant infor-
mation, classification and prediction of patterns, modeling and visual reconstruction of
discriminant subspaces. These issues are multidisciplinary and inherent to several ap-
plications in Computer Science, Psychology and Neuroscience, among others, with the
aim to explain and emulate how humans accomplish so successfully this discriminant
process of coding and decoding high dimensional visual patterns that may be metrically
very close to each other.
Although faces are expected to have a global and common spatial layout with all
their parts such as eyes, nose and mouth arranged consistently in a multidimensional
representation, specific variations in local parts are fundamental to explain our percep-
tion of each individual singularity, or groups of individuals when distinguishing, for
example, between gender or facial expression [9–15]. To understand and emulate how
humans accomplish this process of coding faces, it seems necessary to investigate and
develop computational extraction methods that explore the combination and relative in-
teraction of the global and local types of information, considering as well the embedded
visual knowledge that might be behind the human face perception task under investi-
gation. For instance, recent research on human face processing using eye movements
42
Thomaz, C., Giraldi, G., Gillies, D. and Rueckert, D.
Learning and Extracting Priori-driven Representations of Face Images to Understand the Human Visual Recognition System.
DOI: 10.5220/0008861900420055
In OPPORTUNITIES AND CHALLENGES for European Projects (EPS Portugal 2017/2018 2017), pages 42-55
ISBN: 978-989-758-361-2
Copyright
c
2019 by SCITEPRESS – Science and Technology Publications, Lda. All rights reserved

has consistently demonstrated the existence of preferred facial regions or pivotal areas
involved in successful identity, gender and facial expression human recognition [2–5].
In fact, these works have provided evidence that humans analyze faces focusing their
visual attention on a few inner facial regions, mainly on the eyes, nose and mouth, and
such sparse spatial fixations are not equally distributed and depend on the face percep-
tion task under investigation.
In this context, this chapter describes a unified computational method that com-
bines global and local variance information with eye-tracking fixations to represent
task-driven dimensions in a multidimensional physiognomic face-space. Our unified
computational method allows the exploration of two distinct embedded knowledge ex-
tractions, named here feature- and pattern-based information processing, to disclose
some evidence of how humans perceive faces visually. The eye-tracking fixations are
based on measuring eye movements of a number of participants and trials to frontal and
well-framed face images during separate gender and facial expression classification
tasks. In all the automatic classification experiments carried out to evaluate the unified
computational method proposed, we have considered: different numbers of face-space
dimensions; gender and facial expression sparse spatial fixations; and randomly gener-
ated versions of the distribution of the human eye fixations spread across faces. These
randomly generated spatial attention maps pose the alternative analysis where there
are no preferred viewing positions for human face processing, contrasting the literature
findings.
The remaining of this chapter is organized as follows. In section 2, we describe the
eye-tracking apparatus, participants, and frontal face stimuli used to generate different
fixation images depending on the classification task. Then, section 3 translates in a uni-
fied method the combination of face-space dimensions and eye movements sources of
information for feature- and pattern-based multivariate computational analysis. Section
4 describes the eye-tracking experiments carried out and the training and test face sam-
ples used from distinct image datasets to evaluate the automatic classification accuracy
of the method. All the results have been analyzed in section 5. Finally, in section 6, we
conclude the paper, summarizing its main findings.
2 Materials
In this section, we describe mainly the eye-tracking apparatus, participants and frontal
face stimuli used to generate different fixation images with distinct classification tasks.
2.1 Apparatus
Eye movements were recorded with an on-screen Tobii TX300 equipment that com-
prises an eye tracker unit integrated to the lower part of a 23in TFT monitor. The eye
tracker performs binocular tracking at a data sampling rate of 300Hz, and has minimum
fixation duration of 60ms and maximum dispersion threshold of 0.5 degrees. These are
the eye tracker defaults for cognitive research. A standard keyboard was used to collect
participants responses. Calibration, monitoring and data collection were performed as
implemented in the Tobii Studio software running on an attached notebook (Core i7,
16Gb RAM and Windows 7).
43
Learning and Extracting Priori-driven Representations of Face Images to Understand the Human Visual Recognition System
43

2.2 Participants
A total number of 44 adults (26 males and 18 females) aged from 18 to 50 years par-
ticipated in this study on a voluntary basis. All participants were undergraduate and
graduate students or staff at the university and had normal or corrected to normal vi-
sion. Written informed consent was obtained from all participants.
2.3 Training Face Database
Frontal images of the FEI face database [16] have been used to carry out the eye-
movements stimuli. This database contains 400 frontal 2D face images of 200 subjects
(100 men and 100 women). Each subject has two frontal images, one with a neutral or
non-smiling expression and the other with a smiling facial expression. We have used
a rigidly registered version of this database where all these frontal face images were
previously aligned using the positions of the eyes as a measure of reference. The regis-
tered and cropped images are 128 pixels wide and 128 pixels high and are encoded in
gray-scale using 8-bits per pixel. Figure 1 illustrates some of these well-framed images.
Fig. 1. A sample of the face stimuli used in this work.
2.4 Stimuli
Stimuli consisted of 120 frontal face images taken from the training face database. All
the stimuli were presented centralized on a black background using the 23in TFT mon-
itor with a screen resolution of 1280x1024 pixels. To improve the stimuli visualization
on the TFT monitor all the face images were resized to 512x512 pixels. Presentation of
the stimuli was controlled by the Tobii Studio software.
2.5 Spatial Attention Maps
Eye-movements were processed directly from the eye tracker using the Tobii Studio
software. Fixation was defined by the standard Tobii fixation filter as two or more con-
secutive samples falling within a 50-pixel radius. We considered only data from partici-
pants for whom on average 25% or more of their gaze samples were collected by the eye
tracker. One participant (1 female) did not meet this criterion and was excluded from
the analysis. The standard absolute duration heat maps available at the Tobii Studio
software were used to describe the accumulated fixation duration on different locations
in the face images at the resolution of 512x512 pixels. These absolute duration heat
maps were averaged from all participants and from all face stimuli, generating different
fixation images, called here spatial attention maps, depending on the classification task.
44
EPS Portugal 2017/2018 2017 - OPPORTUNITIES AND CHALLENGES for European Projects
44

3 Method
The computational method combines face images variance with the spatial attention
maps modeled as feature- and pattern-based information sources in a multidimensional
representation of the face-space physiognomic dimensions [17, 18]. It builds on our
previous works [16, 19, 4] of incorporating task-driven information for a unified multi-
variate computational analysis of face images using human visual processing.
3.1 Face-space Dimensions
We have used principal components to specify the face-space physiognomic dimensions
[17, 18] because of their psychological plausibility for understanding the human face
image multidimensional representation [20–23, 18], where the whole face is perceived
as a single entity [24].
A single entity face image, with c pixels wide and r pixels high, can be described
mathematically as a single point in an n-dimensional space by concatenating the rows
(or columns) of its image matrix [20], where n = c × r. The coordinates of this point
describe the values of each pixel of the image and form a n-dimensional 1D vector
x = [x
1
, x
2
, . . . , x
n
]
T
.
Let an N × n data matrix X be composed of N face images with n pixels, that is,
X = (x
1
, x
2
, . . . , x
N
)
T
. This means that each column of matrix X represents the val-
ues of a particular pixel all over the N images. Let this data matrix X have covariance
matrix
S =
1
(N − 1)
N
X
i=1
(x
i
− ¯x)(x
i
− ¯x)
T
, (1)
where ¯x is the grand mean vector of X given by
¯x =
1
N
N
X
i=1
x
i
= [¯x
1
, ¯x
2
, . . . , ¯x
n
]
T
. (2)
Let this covariance matrix S have respectively P and Λ eigenvector and eigenvalue
matrices, that is,
P
T
SP = Λ. (3)
It is a proven result that the set of m (m ≤ n) eigenvectors of S, which corresponds
to the m largest eigenvalues, minimizes the mean square reconstruction error over
all choices of m orthonormal basis vectors [25]. Such a set of eigenvectors P =
[p
1
, p
2
, . . . , p
m
] that defines a new uncorrelated coordinate system for the data ma-
trix X is known as the (standard) principal components.
The calculation of the standard principal components is based entirely on the data
matrix X and does not express any domain specific information about the face percep-
tion task under investigation. We describe next modifications on this calculation that
handle global and local facial differences using feature- and pattern-based combina-
tions of variance and the spatial attention maps.
45
Learning and Extracting Priori-driven Representations of Face Images to Understand the Human Visual Recognition System
45

3.2 Feature-based Combination of Variance and Spatial Attention Map (wPCA)
We can rewrite the sample covariance matrix S described in equation (1) in order to
indicate the spatial association between the n pixels in the N samples as separated n
features. When n pixels are observed on each face image, the sample variation can be
described by the following sample variance-covariance equation [26]:
S = {s
jk
} =
(
1
(N − 1)
N
X
i=1
(x
ij
− ¯x
j
)(x
ik
− ¯x
k
)
)
, (4)
for j = 1, 2, . . . , n and k = 1, 2, . . . , n. The covariance s
jk
between the j
th
and k
th
pixels reduces to the sample variance when j = k, s
jk
= s
kj
for all j and k, and the
covariance matrix S contains n variances and
1
2
n(n − 1) potentially different covari-
ances [26]. It is clear from equation (4) that each pixel deviation from its mean has the
same importance in the standard sample covariance matrix S formulation.
To combine these pixel-by-pixel deviations with the visual information captured by
the eye movements, we first represent, analogously to the face images, the correspond-
ing spatial attention map as a n-dimensional 1D w vector, that is,
w = [w
1
, w
2
, . . . , w
n
]
T
, (5)
where w
j
≥ 0 and
P
n
j=1
w
j
= 1. Each w
j
describes the visual attention power of
the j
th
pixel separately. Thus, when n pixels are observed on N samples, the sample
covariance matrix S
∗
can be described by [19, 4]
S
∗
=
s
∗
jk
=
(
1
(N − 1)
N
X
i=1
√
w
j
(x
ij
− ¯x
j
)
√
w
k
(x
ik
− ¯x
k
)
)
. (6)
It is important to note that s
∗
jk
= s
∗
kj
for all j and k and consequently the matrix S
∗
is a
nxn symmetric matrix. Let S
∗
have respectively P
∗
and Λ
∗
eigenvector and eigenvalue
matrices, as follows:
P
∗T
S
∗
P
∗
= Λ
∗
. (7)
The set of m
∗
(m
∗
≤ n) eigenvectors of S
∗
, that is, P
∗
= [p
∗
1
, p
∗
2
, . . . , p
∗
m
∗
], which
corresponds to the m
∗
largest eigenvalues, defines the orthonormal coordinate sys-
tem for the data matrix X called here feature-based principal components or, simply,
wPCA.
The step-by-step algorithm for calculating these feature-based principal compo-
nents can be summarized as follows:
1. Calculate the spatial attention map w = [w
1
, w
2
, . . . , w
n
]
T
by averaging the fixa-
tion locations and durations from face onset from all participants and from all face
stimuli for the classification task considered;
2. Normalize w, such that w
j
≥ 0 and
P
n
j=1
w
j
= 1, by replacing w
j
with
|w
j
|
P
n
j=1
|w
j
|
;
3. Standardize all the n variables of the data matrix X such that the new variables
have ¯x
j
= 0, for j = 1, 2, . . . , n. In other words, calculate the grand mean vector
as described in Equation (2) and replace x
ij
with z
ij
, where z
ij
= x
ij
− ¯x
j
for
i = 1, 2, . . . , N and j = 1, 2, . . . , n;
46
EPS Portugal 2017/2018 2017 - OPPORTUNITIES AND CHALLENGES for European Projects
46

4. Spatially weigh up all the standardized z
ij
variables using the vector w calculated
in step 2, that is, z
∗
ij
= z
ij
√
w
j
;
5. The feature-based principal components P
∗
are then the eigenvectors correspond-
ing to the m
∗
largest eigenvalues of Z
∗
(Z
∗
)
T
, where Z
∗
= {z
∗
1
, z
∗
2
, . . . , z
∗
N
}
T
and
m
∗
≤ n.
3.3 Pattern-based Combination of Variance and Spatial Attention Map (dPCA)
We can handle the problem of combining face samples variance with the perceptual
processing captured by the eye movements assuming a pattern-based approach rather
than a feature-based one as previously described. Here, we would like to investigate the
spatial association between the features with their perceptual interaction preserved, not
treated separately.
The set of n-dimensional eigenvectors P = [p
1
, p
2
, . . . , p
m
] is defined in equation
(3) as the standard principal components, and the n-dimensional w spatial attention
representation, where w = [w
1
, w
2
, . . . , w
n
]
T
, is described in equation (5).
To determine the perceptual contribution of each standard principal component we
can calculate how well these face-space directions align with the corresponding spatial
attention map, that is, how well p
1
, p
2
, . . . , p
m
align with w, as follows:
k
1
= w
T
· p
1
, (8)
k
2
= w
T
· p
2
,
...
k
m
= w
T
· p
m
.
Coefficients k
i
, where i = 1, 2, . . . , m, that are estimated to be 0 or approximately 0
have negligible contribution, indicating that the corresponding principal component di-
rections are not relevant. In contrast, largest coefficients (in absolute values) indicate
that the corresponding variance directions contribute more and consequently are impor-
tant to characterize the human perceptual processing.
We select then as the first principal components [16] the ones with the highest visual
attention coefficients, that is,
P
+
= [p
+
1
, p
+
2
, ..., p
+
m
+
] = arg max
P
P
T
SP
, (9)
where {p
+
i
|i = 1, 2, . . . m
+
}is the set of eigenvectors of S corresponding to the largest
coefficients |k
1
| ≥ |k
2
| ≥ . . . ≥ |k
m
| calculated in Equation (8), where (m
+
< m ≤
n).
The set of m
+
eigenvectors of S, that is, P
+
= [p
+
1
, p
+
2
, . . . , p
+
m
+
], defines the or-
thonormal coordinate system for the data matrix X called here pattern-based principal
components or, simply, dPCA.
The step-by-step algorithm for calculating these pattern-based principal compo-
nents can be summarized as follows:
1. Calculate the spatial attention map w = [w
1
, w
2
, . . . , w
n
]
T
by averaging the fixa-
tion locations and durations from face onset from all participants and from all face
stimuli for the classification task considered;
47
Learning and Extracting Priori-driven Representations of Face Images to Understand the Human Visual Recognition System
47

2. Normalize w, such that w
j
≥ 0 and
P
n
j=1
w
j
= 1, by replacing w
j
with
|w
j
|
P
n
j=1
|w
j
|
;
3. Calculate the covariance matrix S of the data matrix X and then its respectively P
and Λ eigenvector and eigenvalue matrices. Retain all the m non-zero eigenvectors
P = [p
1
, p
2
, . . . , p
m
] of S, where λ(j) > 0 for j = 1, 2, . . . , m and m ≤ n;
4. Calculate the spatial attention coefficient of each non-zero eigenvector using the
vector w described in step 2, as follows: k
j
= w
T
· p
j
, for j = 1, 2, . . . , m;
5. The pattern-based principal components P
+
= [p
+
1
, p
+
2
, . . . , p
+
m
+
], where m
+
<
m, are then the eigenvectors of S corresponding to the largest coefficients |k
1
| ≥
|k
2
| ≥ . . . ≥ |k
m
+
| ≥ . . . ≥ |k
m
|.
3.4 Geometric Idea
We show in Figure 2 the main geometric idea of the feature- and pattern-based principal
components. The hypothetical illustration presents samples depicted by triangles along
with the spatial attention vector w represented in red.
It is well known that the standard principal components [p
1
, p
2
] are obtained by
rotating the original coordinate axes until they coincide with the axes of the constant
density ellipse described by all the samples.
On the one hand, the feature-based approach uses the information provided by w
for each original variable isolated to finding a new orthonormal basis that is not neces-
sarily composed of the same principal components. In other words, in this hypothetical
example the influence of the variable deviations on the x
2
axis will be relatively mag-
nified in comparison with x
1
because w is better aligned to the original x
2
axis than x
1
one, that is, |w
2
| > |w
1
|. This is geometrically represented in the figure by large gray
arrows, which indicate visually that the constant density ellipse will be expanded in the
x
2
axis and shrunk in the x
1
axis, changing the original spread of the samples illus-
trated in black to possibly the constant density ellipse represented in blue. Therefore,
the feature-based principal components [p
∗
1
, p
∗
2
] would be different from the standard
principal components [p
1
, p
2
], because p
∗
1
is expected to be much closer to the x
2
di-
rection than x
1
, providing a new interpretation of the original data space based on the
power of each variable considered separately.
On the other hand, the pattern-based approach uses the information provided by w
as a full two-dimensional pattern, ranking the standard principal components by how
well they align with the entire pattern captured by w across the two-dimensional space
samples. Since w as a whole is better aligned to the second standard principal compo-
nent p
2
direction than the first one p
1
, i.e. |w
T
· p
2
| > |w
T
· p
1
|, then p
+
1
= p
2
and
p
+
2
= p
1
. Therefore, the pattern-based approach selects as its first principal component
the standard variance direction that is most efficient for describing the whole spatial
attention map, which comprises here the entire pattern of the eye movements across the
whole faces, rather than representing all the pixels visual attention power as unit apart
features.
4 Experiments
The experiments consisted of two separate and distinct classification tasks: (1) gender
(male versus female) and (2) facial expression (smiling versus neutral). During the gen-
48
EPS Portugal 2017/2018 2017 - OPPORTUNITIES AND CHALLENGES for European Projects
48
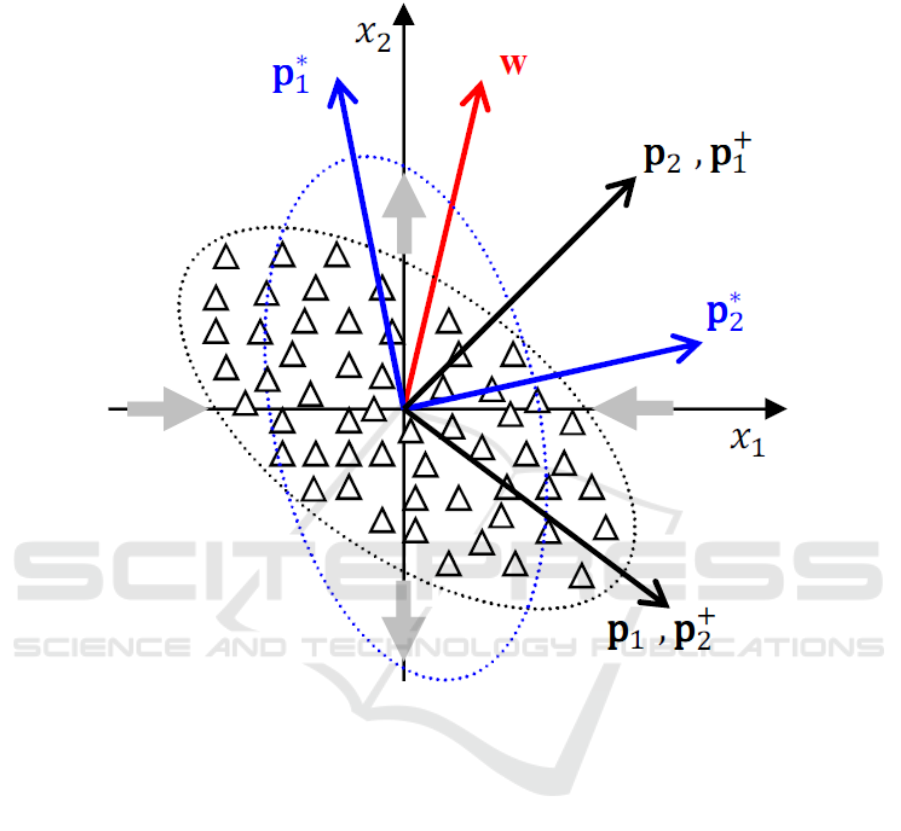
Fig. 2. An hypothetical example that shows samples (depicted by two-dimensional points rep-
resented by triangles) and the geometric idea of the feature- and pattern-based approaches. The
former magnifies or shrinks the deviation of each variable separately depending on the direction
of w, where |w
2
| > |w
1
|, and [p
1
, p
2
] and [p
∗
1
, p
∗
2
] are respectively the standard and feature-
based principal components. The latter re-ranks the standard principal components [p
1
, p
2
] by
how well such directions align with w as a whole, where |w
T
· p
2
| > |w
T
· p
1
| and [p
+
1
, p
+
2
]
are consequently the pattern-based principal components.
der experiments, 60 faces equally distributed among gender were shown on the Tobii
eye tracker, all with neutral facial expression (30 males and 30 females). For the facial
expression experiments, all the 60 faces shown were equally distributed among gen-
der and facial expression (15 males smiling, 15 females smiling, 15 males with neutral
expression and 15 females with neutral expression).
Participants were seated in front of the eye tracker at a distance of 60cm and initially
filled out an on-screen questionnaire about their gender, ethnicity, age and motor pre-
dominance. They were then instructed to classify the faces using their index fingers to
press the corresponding two keys on the keyboard. Participants were asked to respond
49
Learning and Extracting Priori-driven Representations of Face Images to Understand the Human Visual Recognition System
49

as accurately as possible and informed that there was no time limit for their responses.
Each task began with a calibration procedure as implemented in the Tobii Studio soft-
ware. On each trial, a central fixation cross was presented for 1 second followed by a
face randomly selected for the corresponding gender or facial expression experimental
samples. The face stimulus was presented for 3 seconds in both tasks and was followed
by a question on a new screen that required a response in relation to the experiment,
that is, ”Is it a face of a (m)ale or (f)emale subject?” or ”Is it a face of a (s)miling or
(n)eutral facial expression subject?”. Each response was subsequently followed by the
central fixation cross, which preceded the next face stimulus until all the 60 faces were
presented for each classification task. Each participant completed 60 trials for the gen-
der classification task and 60 trials for the facial expression one with a short break in
between the tasks.
We adopted a 10-fold cross validation method drawn at random from the gender
and smiling corresponding sample groups to evaluate the automatic classification accu-
racy of the feature- and pattern-based dimensions. Additionally to the FEI face samples
described previously and used for training only, we have used frontal face images of
the well-known FERET database [27], registered analogously to the FEI samples, for
testing. In the FERET database, we have also considered 200 subjects (107 men and
93 women) and each subject has two frontal images (one with a neutral or non-smiling
expression and the other with a smiling facial expression), providing a total of two dis-
tinct training and test sets of 400 images to perform the gender and expression automatic
classification experiments. We have assumed that the prior probabilities and misclassi-
fication costs are equal for both groups. On the principal components subspace, the
standard sample group mean of each class has been calculated from the corresponding
training images and the minimum Mahalanobis distance from each class mean [25] has
been used to assign a test observation to either the smiling and non-smiling classes in
the facial expression experiment, or to either the male or female classes in the gender
experiment.
In all the automatic classification experiments, we have considered different num-
bers of principal components, both gender and facial expression task-driven spatial at-
tention maps accordingly, and their corresponding randomly generated versions with
the distribution of the human eye fixations uniformly spread across faces to pose the
alternative analysis where there are no preferred viewing positions for human face pro-
cessing.
5 Results
The classification results of the 43 participants on the gender and facial expression
tasks were all above the chance level (50%). Their performance on the male versus fe-
male (gender) and smiling versus non-smiling (facial expression) tasks were on average
97.2%(±2.3%) and 92.8%(±4.3%), respectively.
Figure 3 illustrates the spatial attention maps (left side) along with their correspond-
ing randomly generated versions (right side) used to calculate the feature- and pattern-
based principal components. The spatial attention maps (left) are summary statistics
that describe the central tendency of the fixation locations and durations from face onset
50
EPS Portugal 2017/2018 2017 - OPPORTUNITIES AND CHALLENGES for European Projects
50
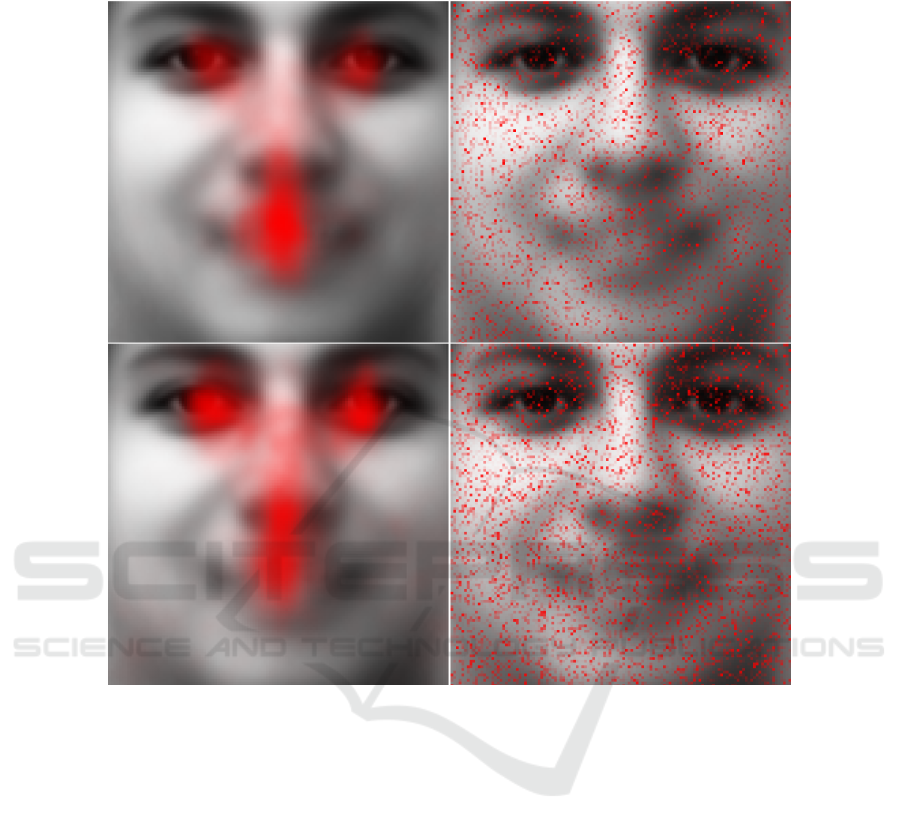
Fig. 3. An illustration of the spatial attention maps (left) and their corresponding randomly gen-
erated versions (right). The upper and lower panels describe the facial expression and gender
classification tasks, respectively, superimposed on the grand mean face of the training database
used.
from all participants and from all face stimuli after 3 seconds for the facial expression
(top panel) and gender (bottom) classification tasks. We have disregarded the first two
fixations of all participants to avoid the central cross bias. There are location similarities
in the manner all the faces were perceived, highlighting relevant proportion of fixations
directed at mainly the pivotal areas of both eyes, nose and mouth. These results show
that participants made slightly different fixations in the two classification tasks on these
areas known as optimal for human processing of the entire faces [1, 2, 5]. In contrast,
as expected, the randomly generated versions (right) of the spatial attention maps are
uniformly distributed, showing essentially a sub-sampling of the entire face without any
preferred features or viewing positions.
Figure 4 shows the recognition rates of the facial expression (top panel) and gen-
der experiments (bottom panel) for the feature- and pattern-based principal components
51
Learning and Extracting Priori-driven Representations of Face Images to Understand the Human Visual Recognition System
51

using the spatial attention maps and their corresponding random versions. The number
of principal components considered varied from 20 to 240 because all the recognition
rates leveled off or decreased with additional components. We can see that both feature-
and pattern-based automatic mappings of the high-dimensional face images into lower-
dimensional spaces are accurately equivalent, with no significant statistical difference
on their recognition rates, when using the facial expression and gender spatial attention
maps to highlight accordingly the preferred inner face regions for automatic classifica-
tion. In other words, both processings have shown to be computationally effective to
automatically classify the facial expression and gender samples used.
However, the feature-based behavior is noteworthy when using the random versions
of the aforementioned maps. In Figure 4, there is no statistical difference between the
feature-based and its random version of results on the facial expression experiments
and, in fact, there is some statistical significant improvement (p < 0.05) on its auto-
matic recognition performance when using the randomly generated version of the spa-
tial attention maps in the gender experiments. On the condition of analyzing frontal and
well-framed face images, the results indicate that the feature-based approach shows no
specific exploitation of the manner in which all the participants have viewed the entire
faces when classifying the samples. These results suggest indeed that there is no crit-
ical region or pivotal areas involved in successful gender and facial expression human
recognition, despite the clear evidence of focused visual attention on the eyes, nose and
mouth described in the previous Figure 3.
Interestingly, though, the findings of the pattern-based dimensions are exactly the
opposite. We can see clearly in Figure 4 statistical differences between the pattern-based
and its random version results (p < 0.001) on both facial expression and gender exper-
iments, where the preferred participants fixation positions augment considerably the
automatic recognition of their face-space dimensions when using the spatial attention
maps rather than their randomly generated versions. These results provide multivariate
statistical evidence that faces seem to be analysed visually using a pattern-based strat-
egy, instead of decomposing such information processing into separate and discrete
local features.
6 Conclusion
Exploring eye movements of a number of participants on gender and facial expression
distinct classification tasks, we have been able to implement an automatic multivariate
statistical extraction method that combines variance information with sparse visual pro-
cessing about the task-driven experiment. The two methods for incorporation of the eye
tracking information described here are radically different: (1) weighting the individual
pixels can be considered a feature-based approach, because we are trying to improve
the face-space using the new knowledge; (2) ranking the features can be considered a
pattern-based approach, because we are seeking the best face-space directions to use.
It is well-known that the procedure of weighting the individual pixels works well
when the corresponding weights have significant discriminant information. However,
our experimental results carried out on publicly available face databases have shown
that such procedure does not work using the spatial attention maps obtained from eye
52
EPS Portugal 2017/2018 2017 - OPPORTUNITIES AND CHALLENGES for European Projects
52
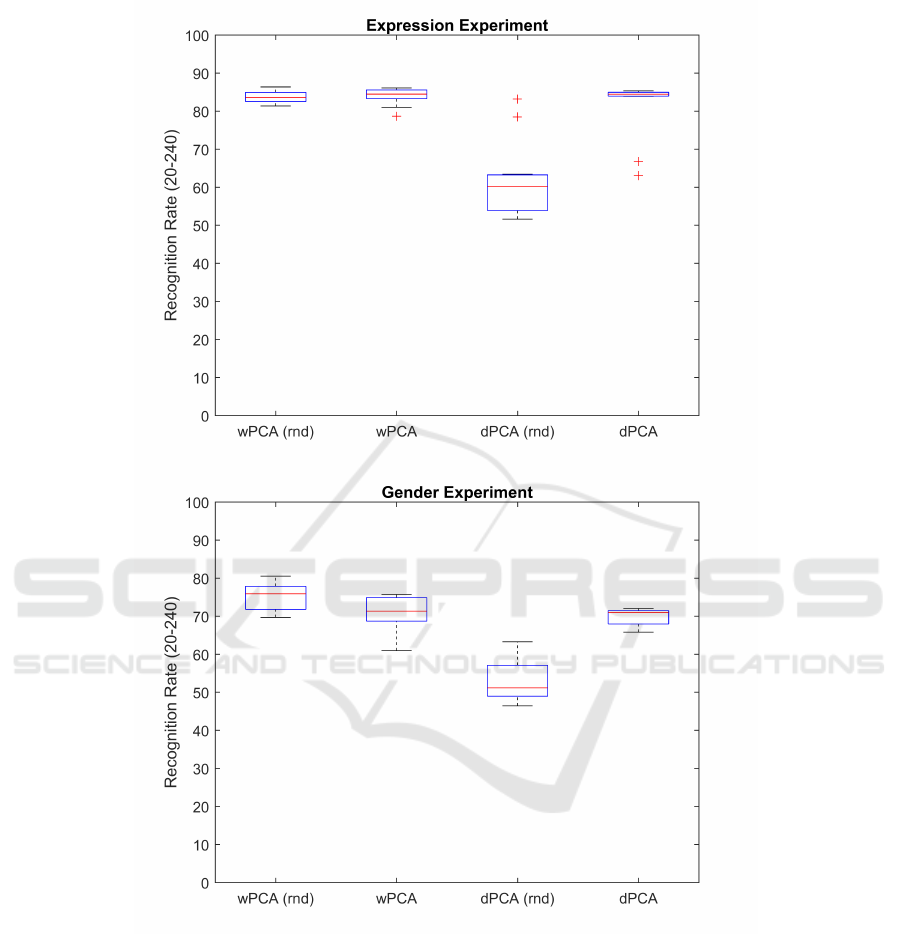
Fig. 4. Facial expression (top) and gender (bottom) boxplots of the recognition rates of feature-
based (wPCA) and pattern-based (dPCA) dimensions given the corresponding spatial attention
maps and their randomly generated versions (rnd). The number of principal components consid-
ered for automatic classification varied from 20 to 240.
tracking. In fact, random weights can even outperform the attention maps when trying to
improve the face-space using this knowledge on a feature-by-feature method. Overall,
we must conclude that the fixation points in human vision are not specific feature points
53
Learning and Extracting Priori-driven Representations of Face Images to Understand the Human Visual Recognition System
53

chosen for their discriminant information, suggesting that the human visual recognition
system is pattern-based by nature.
Acknowledgements The authors would like to thank the financial support provided by
FAPESP (2012/22377-6) and CNPq (309532/2014-0). This work is part of the New-
ton Advanced Fellowship (NA140147) appointed by the Royal Society to Carlos E.
Thomaz.
References
1. Hsiao, J.H.W., Cottrell, G.: Two fixations suffice in face recognition. Psychological Science
19 (2008) 998–1006
2. Peterson, M.F., Eckstein, M.P.: Looking just below the eyes is optimal across face recogni-
tion tasks. Proceedings of the National Academy of Sciences 109 (2012) E3314–E3323
3. Moreno, E.P., Ferreiro, V.R., Gutierrez, A.G.: Where to look when looking at faces: Visual
scanning is determined by gender, expression and task demands. Psicologica 37 (2016) 127–
150
4. Thomaz, C.E., Amaral, V., Gillies, D.F., Rueckert, D.: Priori-driven dimensions of face-
space: Experiments incorporating eye-tracking information. In: Proceedings of the Ninth
Biennial ACM Symposium on Eye Tracking Research & Applications. ETRA ’16 (2016)
279–282
5. Bobak, A.K., Parris, B.A., Gregory, N.J., Bennetts, R.J., Bate, S.: Eye-movement strategies
in developmental prosopagnosia and ”super” face recognition. The Quarterly Journal of
Experimental Psychology 70 (2017) 201–217
6. Crookes, K., McKone, E.: Early mature of face recognition: no childhood development of
holistic processing, novel face encoding, or face-space. Cognition 111 (2009) 219–247
7. Wilmer, J.B., Germine, L., Chabris, C.F., Chatterjee, G., Williams, M., Loken, E., Nakayama,
K., Duchaine, B.: Human face recognition ability is specific and highly heritable. Pro-
ceedings of the National Academy of Sciences of the United States of America 107 (2010)
5238–5241
8. McKone, E., Palermo, R.: A strong role for nature in face recognition. Proceedings of the
National Academy of Sciences of the United States of America 107 (2010) 4795–4796
9. Cabeza, R., Kato, T.: Features are also important: Contributions of featural and configural
processing to face recognition. Psychological Science 11(5) (2000) 429–433
10. Joseph, R.M., Tanaka, J.: Holistic and part-based face recognition in children with autism.
Journal of Child Psychology and Psychiatry 44(4) (2003) 529–542
11. Wallraven, C., Schwaninger, A., Bulthoff, H.H.: Learning from humans: Computational
modeling of face recognition. Network: Computation in Neural Systems 16(4) (2005) 401–
418
12. Maurer, D., OCraven, K.M., Grand, R., Mondloch, C.J., Springer, M.V., Lewis, T.L., Grady,
C.L.: Neural correlates of processing facial identity based on features versus their spacing.
Neuropsychologia 45(7) (2007) 1438–1451
13. Shin, N.Y., Jang, J.H., Kwon, J.S.: Face recognition in human: the roles of featural and
configurational processing. Face Analysis, Modelling and Recognition Systems 9 (2011)
133–148
14. Miellet, S., Caldara, R., Schyns, P.G.: Local jekyll and global hyde: The dual identity of face
recognition. Psychological Science 22(12) (2011) 1518–1526
54
EPS Portugal 2017/2018 2017 - OPPORTUNITIES AND CHALLENGES for European Projects
54

15. Seo, J., Park, H.: Robust recognition of face with partial variations using local features and
statistical learning. Neurocomputing 129 (2014) 41–48
16. Thomaz, C.E., Giraldi, G.A.: A new ranking method for principal components analysis and
its application to face image analysis. Image and Vision Computing 28 (2010) 902–913
17. Valentine, T.: A unified account of the effects of distinctiveness, inversion, and race in
face recognition. The Quarterly Journal of Experimental Psychology Secion A: Human
Experimental Psychology 43 (1991) 161–204
18. Valentine, T., Lewis, M.B., Hills, P.J.: Face-space: A unifying concept in face recognition
research. The Quarterly Journal of Experimental Psychology (2015) 1–24
19. Thomaz, C.E., Giraldi, G.A., Costa, J.P., Gillies, D.F.: A priori-driven PCA. In: ACCV 2012
Workshops (LNCS 7729), Springer (2013) 236–247
20. Sirovich, L., Kirby, M.: Low-dimensional procedure for the characterization of human faces.
Journal of Optical Society of America 4 (1987) 519–524
21. Hancock, P.J.B., Burton, M.A., Bruce, V.: Face processing: Human perception and principal
component analysis. Memory and Cognition 24(1) (1996) 26–40
22. Todorov, A., Oosterhof, N.N.: Modeling social perception of faces. IEEE Signal Processing
Magazine March (2011) 117–122
23. Frowd, C.D.: Facial composite systems. Forensic facial identification: Theory and practice
of identification from eyewitnesses, composites and CCTV (2015) 43–70
24. Rakover, S.S.: Featural vs. configurational information in faces: A conceptual and empirical
analysis. British Journal of Psychology 93 (2002) 1–30
25. Fukunaga, K.: Introduction to Statistical Pattern Recognition. Academic Press, New York
(1990)
26. Johnson, R., Wichern, D.: Applied Multivariate Statistical Analysis. New Jersey: Prentice
Hall (1998)
27. Philips, P.J., Wechsler, H., Huang, J., Rauss, P.: The feret database and evaluation procedure
for face recognition algorithms. Image and Vision Computing 16(5) (1998) 295–306
55
Learning and Extracting Priori-driven Representations of Face Images to Understand the Human Visual Recognition System
55
