
Vector Autoregression Analysis on Inflation Rate, Interest Rate and
Rupiah Exchange Rate with Indonesia Sharia Stock Index
Bangkit Pratama, Eeng Ahman, and Elis Mediawati
Universitas Pendidikan Indonesia, Jl. Setiabudhi, Kota Bandung, Indonesia
bangkit.pratama@student.upi.edu, {eengahman, elis.mediawati}@upi.edu
Keyword: ISSI, Sharia Stock, JII, Macroeconomic, VAR.
Abstract: Sector that is able to survive the financial crisis on 1998 is based on Islamic economic institutions, and its
success still survive today. So, the development of Islamic financial institutions is growing rapidly in various
parts of the world. One of that sector which developing significant is Islamic stocks, in Indonesia the entire
Islamic stocks in gathered in the Indonesia Sharia Stock Index (ISSI). Milestone in the development of Islamic
stocks themselves starting from the publication of the Jakarta Islamic Index (JII) in 2000 and then continued
ISSI in 2011. Ironically ISSI which include overall sharia shares listed on Indonesia Stock Exchange is much
cheaper than JII which only consists of 30 stocks, this indicates the considerable price gap. This research will
try to uncover how the relationship between macroeconomic variables that exist in Indonesia using
Autoregression Vector analysis (VAR) from May 2011 to February 2017. Analysis of VAR has the
advantages which are multivariate, free of spurious variable endogeneity and exogeneity and can detect
relationships between variables. The result of this study indicates that previous period of ISSI and BI Rate
has positive influence to ISSI, while Inflation and Rupiah-Dollar exchange rate has negative influence to ISSI.
1 INTRODUCTION
Currently, the development of sharia capital market
which is part of sharia financial industry very rapidly
(Pasaribu, 2013), including stock and index.
Implementation of sharia principles in the capital
market must be sourced from the Qur'an as the highest
source of law and Hadith of the Prophet Muhammad
SAW. The Qur'an itself suggests the investment in
general in Chapter al-Baqarah [2] verse 261.
A high price index positively reflects stocks with
high returns as well. Various things affect the high
stock price, besides the quality and financial health of
companies that issue shares and listed in the index.
There are macroeconomic factors that have a direct
relationship with the development of shares in the
capital market, among others are the Inflation Rate,
Bank Indonesia Interest Rate (BI Rate) and Currency
Exchange, in this case, Rupiah to US Dollar
(Suciningtias & Khoiroh, 2015) Also, the economic
condition of the concerned country (Utama & Artini,
2015), as in 1998 where the only surviving financial
institutions are in the form of based sharia.
One of the Sharia-based capital market indexes
used by the Indonesia Stock Exchange (IDX) is the
Indonesia Sharia Stock Index (ISSI). The unfortunate
thing about ISSI which covers all Sharia shares is less
attractive than the Jakarta Islamic Index (JII) which
although it can be said to be the only leading Sharia
stocks, it just represents only 30 shares (Bursa Efek
Indonesia, 2016). While the ISSI should be the
benchmark of real sharia investment development
(not only the best) is less well known, and the price is
four times lower than JII.
2 LITERATURE REVIEW
In theory, inflation hurts investment, because
inflation will create greater uncertainty (Sukirno,
2003, p. 305). The interest rate also negatively
influences investment in accordance with Keynes’s
theory of speculate liquidity preference, depending on
the interest rate of a country's savings, in which a
higher expected profit will be chosen (Boediono,
2001, p. 97).
Pratama, B., Ahman, E. and Mediawati, E.
Vector Autoregression Analysis on Inflation Rate, Interest Rate and Rupiah Exchange Rate with Indonesia Sharia Stock Index.
In Proceedings of the 1st International Conference on Islamic Economics, Business, and Philanthropy (ICIEBP 2017) - Transforming Islamic Economy and Societies, pages 87-91
ISBN: 978-989-758-315-5
Copyright © 2018 by SCITEPRESS – Science and Technology Publications, Lda. All rights reserved
87

3 METHODOLOGY
The object of this research is Inflation Rate, Interest
Rate, US Dollar-Rupiah Exchange Rate and
Indonesia Sharia Stock Index with 70 periods data
from May 2011 to February 2017.
Data analysis is performed through a series of test
using the Vector Autoregression (VAR) analyst,
whose superiority to analyze data dynamically with
Impulse-Response Function (IRF) and Forecast Error
Variance Decomposition (FEVD) (Widokartiko, et
al., 2016). Pre-Tests also require before VAR Test
(Tanjung & Devi, 2013).
4 RESULT
4.1 Pre-VAR Test
4.1.1 Stationary Test
Table 1: Stationary Test Result on Level.
Variable
ADF
Statistic
MacKinnon
Crit 5%
P-Value
Ln_ISSI
-2.198953
-3.476275
0.4824
Inflation
-2.246909
-3.477275
0.4564
BI Rate
0.347794
-3.476275
0.9985
Ln_Kurs
-1.479645
-3.476275
0.8273
Based on Table 1, the unit root test results at the
level indicate that all variables are non-stationary at
the critical value 5%, seen from the values of t-ADF
are higher than the absolute value of MacKinnon
Critical Values. In the unit root test which is non-
stationary at the level, an advanced analysis should be
performed at the first difference level.
Table 2: Stationary Test Result on First Difference.
Variable
ADF
Statistic
MacKinnon
Critical 5%
Prob
Ln_ISSI
-7.436425
-3.477275
0.0000
Inflation
-6.392958
-3.478305
0.0000
BI Rate
-5.785225
-3.477275
0.0000
Ln_Rupiah
-8.831402
-3.477275
0.0000
According to Table 2 can be seen that unit root
test results at the first difference level indicate that all
variables are stationary at a 5%, seen from the
absolute value of t-ADF less than the absolute value
of its MacKinnon Critical Values.
4.1.2 Determine the Optimum Lag
Table 3: Lag Test.
Lag
AIC
SC
0
2.860709
2.995639
1
-7.157419*
-6.482768*
2
-7.064130
-5.849759
Based on Table 3 can be seen that values
containing the asterisks (*) lag are most optimum.
Therefore, in this study using lag 1 (one).
4.1.3 Stability Test
Table 4: Stability Test Result.
Root
Modulus
0.971061
0.971061
0.936366
0.936366
0.883529 – 0.108880i
0.890213
0.883529 + 0.108880i
0.890213
According to Table 4, the modulus values obtained do
not exceed one (Lutkepohl, 1991), so it can be
concluded that the VAR model is stable and can
produce valid output.
4.1.4 Cointegrity Test
Table 5: Johansen Cointegrity Test Result.
Trace Stat
Crit Value
Prob
40.99040
47.85613
0.1890
19.53089
29.79707
0.4552
3.773551
15.49471
0.9209
0.788021
3.841466
0.3747
Based on Table 5 can be seen that the Johansen
cointegration test results show no cointegration
equation, i.e., when the trace statistic value is smaller
than the critical value at the critical point of 5%. In
the absence of cointegration in this equation, the
model to be used in this study is Vector Auto
Regression (VAR).
4.1.5 Engel-Granger Causality Test
Table 6: Causality Test Result.
Null Hypothesis
Prob
ISSI affected by Inflation
0.3428
ISSI affected by BI rate
0.2340
ISSI affected by Rupiah
0.0111
Inflation affected by BI rate
0.0031
BI rate affected by Rupiah
0.0424
ICIEBP 2017 - 1st International Conference on Islamic Economics, Business and Philanthropy
88

Based on Table 6, the results show that at the level
of probability value is below 0.05, the rupiah
exchange rate affects the ISSI, and the BI rate affects
the Inflation, as well as the Rupiah exchange rate
influences the BI rate. Changes in the rupiah
exchange rate significantly affected the ISSI price.
4.2 VAR Test and Analysis
4.2.1 Vector Autoregression Result
Table 7: VAR Test Result.
Variable
Coefficient
T-Stat
LN_ISSI (-1)
0.886953
15.6621
Inflation (-1)
-0.004205
-1.15742
BI rate (-1)
0.000188
0.02454
Ln Rupiah (-1)
0.047321
1.13692
C
0.151852
0.55536
R-squared
0.887694
-
Adj. R-squared
0.880675
-
This study uses significance with a critical value
of 5% equal to ± 1.99495. Based on Table 7 can be
seen that the value of an R-squared coefficient of
0.887694 means that 88.76% of ISSI variables can be
explained by the variables in this study, while 11.24%
is explained by other variables outside the model.
And following model equation of this research that
formed:
LN_ISSI = 0.886953
LN_ISSI (-1)
- 0.004205
INFLATION (-1)
+ 0.000188
BIRATE (-1)
+ 0.047321
LN_RUPIAH (-1)
+ 0.151852
4.2.2 Forecast Error Variance
Decomposition Result
Table 8: FEVD ISSI Result.
Period
ISSI
INF
BIRATE
RUPIAH
1
100.00
0.00
0.00
0.00
5
96.89
2.66
0.00
0.45
10
89.89
7.69
0.01
2.41
15
84.71
10.09
0.01
5.19
20
81.97
10.38
0.01
7.64
25
80.43
10.19
0.02
9.36
30
79.48
10.10
0.03
10.39
35
78.91
10.07
0.07
10.96
40
78.60
10.04
0.10
11.26
45
78.42
10.00
0.13
11.44
50
78.32
9.96
0.16
11.55
Based on the FEVD results in Table 8 shows that
in the first-period variability and fluctuation of ISSI
variables can be explained 100% by the variable
itself. Until the end of the period, it is the most
influential variable to the ISSI changes itself with the
contribution amount at the end of the time reaches 78,
32%. Then followed by the variable Rupiah-US
Dollar Exchange Rate which each period has
increased gradually so that at the end of the period
influences 11.55%. And the BI rate variable since the
fifth period of the trend has decreased significantly
which then began to increase step-by-step until at the
end of the period has an effect of 0.16% against ISSI.
Meanwhile, the Inflation variable from 1 to 20 trend
periods has increased but after that until the end of the
trend period has decreased until it reaches its
influence value is only 9,96%.
4.2.3 Impulse-Response Function Result and
ISSI previous period to ISSI Analysis
-.02
-.01
.00
.01
.02
.03
.04
5 10 15 20 25 30 35 40 45 50
Response of LN_ISSI to LN_ISSI
R e s p o n s e t o C h o le s k y O n e S . D . ( d . f . a d ju s t e d ) I n n o v a t i o n s ± 2 S . E .
Figure 1: IRF ISSI Previous Period to ISSI Result.
Definite previous period ISSI significant positive
relation to ISSI according to Demand Function which
is the price of a good following consumer expectation
about price in the future (Ahman & Rohmana, 2012,
pp. 61-64).
Meanwhile, the IRF ISSI to ISSI result in Figure
1 shows that ISSI changes were positively responded
by ISSI at the beginning of the period, which then
decreased quite sharply, although still in the positive
zone. It is due to investors' risk expectations, which
ISSI is a collection of sharia stocks in DES and most
are still in the form of Penny Stocks shares, the
possibility of newbie investors just starting count the
risk after buying stocks in ISSI.
Vector Autoregression Analysis on Inflation Rate, Interest Rate and Rupiah Exchange Rate with Indonesia Sharia Stock Index
89
4.2.4 Impulse-Response Function Result and
Inflation Rate to ISSI Analysis
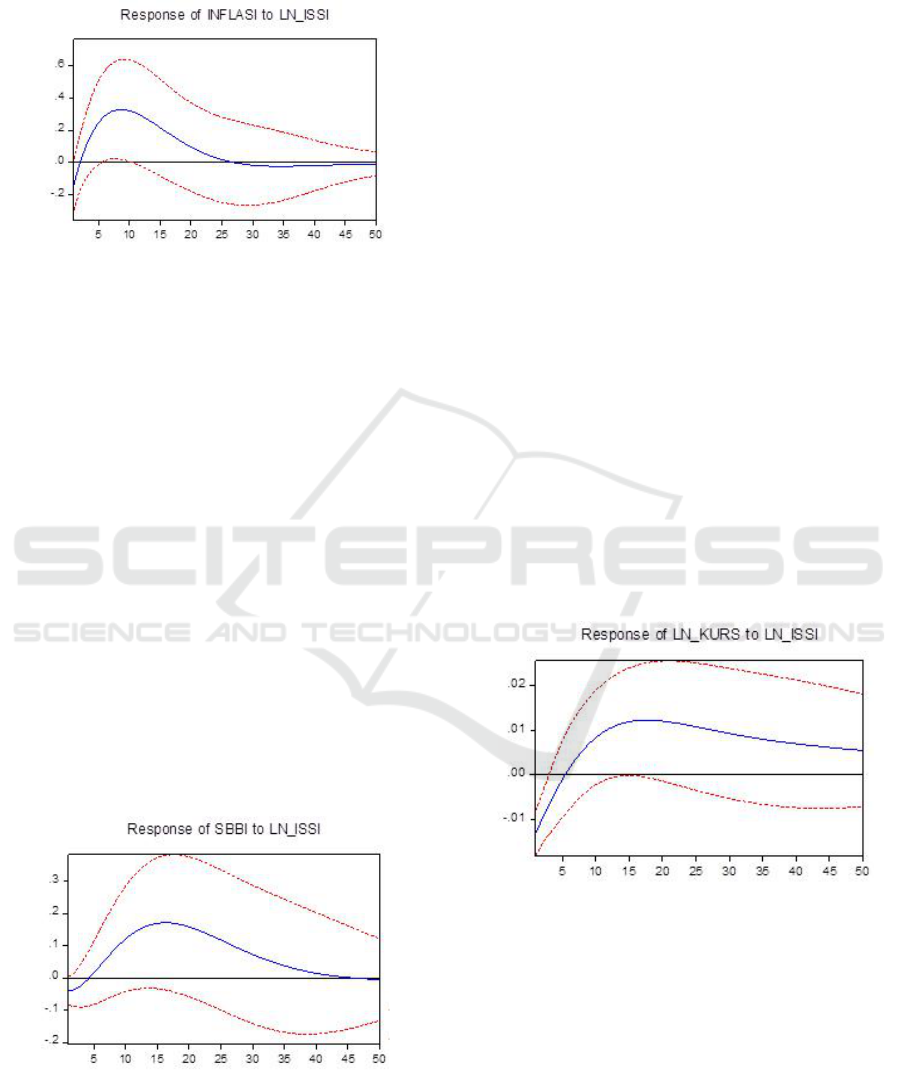
Figure 2: IRF Inflation to ISSI Result.
The insignificant negative relationship between
Inflation to ISSI by existing theory proposed by
Sukirno (2003, p. 305). It is happening because
income rises as inflation also rise, which then affects
producers who have to raise production costs and are
charged to customers to cover the cost of adding
wages to employees. Besides, high inflation also
triggers higher interest rates (Amalia, 2010, p. 110),
as the amount of money in circulation increases but
the number of goods are fixed (Prabowo, 2013, p. 21).
Meanwhile, from IRF Inflation to ISSI result in
Figure 2 shows that Inflation changes responded
negatively by ISSI in the early period, which then
increased to positive. That is due to the increase in
money velocity as inflation rises the purchasing
power of the people, including the purchasing power
of the portfolio, but then again has a negative impact
until the end of the period.
4.2.5 Impulse-Response Function Result and
BI Rate to ISSI Analysis
Figure 3. IRF BI Rate to ISSI Result.
The insignificant positive relationship between BI
Rate and ISSI was influenced by the new replacement
rate BI 7-day Repo Rate, which was applied to
improve economic growth in Indonesia
(Kompas.com, 2016).
Meanwhile, from the IRF of BI Rate to ISSI in
Figure 3 shows that the BI Rate change was
responded negatively by ISSI in the early period,
which then increased to positive. This is due in
October 2012 to May 2013 the BI Rate is decreasing
and resulted in an increase in investment according to
Keynes theory, that people will choose to speculate if
the current interest rate (felt) low and will reinvest if
the current interest rate (felt) high (Boediono, 2001,
p. 97), And the line continues to decline even still in
positive zones.
Another interesting thing from expert opinion and
stock market observers as well as the owner of PT
Avere Mitra Investama that is Teguh Hidayat. He is
stating that when BI 7-Day Repo Rate is applied,
banking stocks are falling, but not for long, investors
rebuying the Blue Chip shares besides banking stocks
(Hidayat, 2016), And when the BI 7-Day Repo Rate
officially became the new benchmark interest rate in
August 2016 (Bank Indonesia, 2016), shortly after
that in October 2016 the ISSI price peaked during
May 2011-February 2017 period.
4.2.6 Impulse-Response Function Result and
Rupiah Exchange Rate to ISSI
Analysis
Figure 4: IRF ISSI to Rupiah Exchange Rate Result.
The insignificant positive relationship between
Rupiah exchange rate and ISSI is defined when the
Rupiah exchange rate depreciates and causes the
Rupiah's nominal value to increase, resulting in the
decreasing ISSI price, also when the Rupiah
Exchange appreciates and causes the Rupiah's
nominal value to decline, impacting the ISSI price
increase.
It is happening because of the rising cost of
imported raw materials and equipment required by
ICIEBP 2017 - 1st International Conference on Islamic Economics, Business and Philanthropy
90

the company resulting in increased production costs.
In other words, the weakening of the Rupiah
exchange rate hurts the national economy which
ultimately degrades stock performance in the stock
market (Wiyani & Wijayanto, 2005).
Meanwhile, from the IRF Rupiah Exchange Rate
to ISSI in Figure 4 shows that ISSI positively
responded the change in the Rupiah Exchange Rate in
the early period which then declined even still in the
positive zone. That is due to the appreciation of the
Rupiah-Dollar Exchange Rate at the beginning of the
time but then depreciates until the end of the period.
5 CONCLUSION
Based on the result of research, previous period ISSI
has a positive influence on ISSI; Inflation rate hurts
ISSI, BI Rate has a positive impact on ISSI and
Rupiah-Dollar Exchange Rate hurts ISSI. The
implication and suggestion of this research are that
the theory used is still conventional because the
Islamic theory of investment is few and debatable
despite the existence of its MUI Fatwa. Besides, the
BI Rate that is explicitly forbidden by Islam is still
included because as a counter from the investment
according to Liquidity Preference theory by Keynes.
And the little research data because it follows the new
ISSI itself was published in May 2011. Also, the most
influencing variables are the previous period ISSI
because ISSI affected by investor predicted value to
the future price.
REFERENCES
Ahman, E., Rohmana, Y., 2012. Teori Ekonomi Mikro,
Suatu Pengantar. Bandung: Rizqi Press.
Amalia, F., 2010. Bahan Ajar (Diktat) Mata Kuliah:
Ekonomi Makro. Jakarta: s.n.
Bank Indonesia, 2016. Data BI Rate. [Online]
Available at: http://www.bi.go.id/id/moneter/bi-
rate/data/Default.aspx
Boediono, 2001. Ekonomi Moneter. 3 penyunt. Yogyakarta:
BPFE.
Bursa Efek Indonesia, 2016. Indeks Saham Syariah.
[Online] Available at: http://www.idx.co.id/id-
id/beranda/produkdanlayanan/pasarsyariah/indekssaha
msyariah.aspx
Hidayat, T., 2016. Mengenal BI 7-day Rate, dan
Dampaknya ke Perbankan. [Online]
Available at:
http://www.teguhhidayat.com/2016/04/mengenal-bi-7-
day-rate-dan-dampaknya.html
Kompas.com, 2016. "BI 7 Day Repo Rate" Diberlakukan
Hari Ini, Apa Dampaknya?. [Online]
Available at:
http://ekonomi.kompas.com/read/2016/08/19/1030006
26/.BI.7.Day.Repo.Rate.Diberlakukan.Hari.Ini.Apa.D
ampaknya.
Lutkepohl, H., 1991. Introduction To Multiple Time Series
Analysis. Berlin: Springer-Verlag.
Pasaribu, R. B. F. & M., 2013. Analisis Pengaruh Variabel
Makroekonomi Terhadap Indeks Saham Syariah
Indonesia. Jurnal Ekonomi dan Bisnis, 7(2), pp. 117-
128.
Prabowo, D., 2013. Analisis Pengaruh Inflasi, Sertifikat
Bank Indonesia Syariah (SBIS), dan Jumlah Uang
Beredar (JUB) terhadap Indeks Syariah yang Terdaftar
di Indeks Saham Syariah Indonesia (ISSI), Jakarta: s.n.
Suciningtias, S. A., Khoiroh, 2015. Analisis Dampak
Variabel Makro Ekonomi terhadap Indeks Saham
Syariah Indonesia (ISSI). s.l., s.n., pp. 398-412.
Sukirno, S., 2003. Makroekonomi: Teori Pengantar.
Jakarta: Raja Grafindo Persada.
Tanjung, H., Devi, A., 2013. Metodologi Penelitian
Ekonomi Islam. Jakarta: Gramata Publishing.
Utama, I. W. A. B., Artini, L. G. S. A., 2015. Pengaruh
Indeks Bursa Dunia pada Indeks Harga Saham
Gabungan Bursa Efek Indonesia. Jurnal Manajemen,
Strategi Bisnis dan Kewirausahaan, Februari, 9(1), pp.
65-73.
Widokartiko, B., Achsani, N. A., Beik, I. S., 2016. Dampak
Kinerja Internal dan Kondisi Makro Ekonomi terhadap
Profitabilitas pada Perbankan. Jurnal Aplikasi Bisnis
dan Manajemen, Mei, 2(2), pp. 161-171.
Wiyani, W., Wijayanto, A., 2005. Pengaruh Nilai Tukar
Rupiah, Tingkat Suku Bunga Deposito dan Volumen
Perdagangan Saham Terhadap Harga Saham. Jurnal
Keuangan dan Perbankan, 9(3), pp. 884-903.
Vector Autoregression Analysis on Inflation Rate, Interest Rate and Rupiah Exchange Rate with Indonesia Sharia Stock Index
91
