
Profile of Physical Fitness, Healthy Life Behavior, Anxiety and
Concentration Level of Elementary School
Nuryadi Nuryadi, Jajat Darajat Kusuma Nagara, Tite Juliantine and Suherman Slamet
Faculty of Sport and Health Education, Universitas Pendidikan Indonesia, Jln. Dr. Setiabudh No.299 Bandung, Indonesia
Nuryadi_71@upi.edu
Keywords: Learning Model, Basic Movement Pattern, Physical Fitness, Healthy Life Behaviour, Anxiety, Cortisol
Saliva, Concentration and Academic Achievement.
Abstract: This study aims to obtain empirical evidence, develop applying the model and basic movement patterns of
students based on physical fitness profile, healthy life behaviour that associated with concentration, anxiety
and accompanied by examination of salivary cortisol saliva response and academic achievement of
elementary school students in West Java. The results of this study are expected to be known and analysed
the benefits of physical fitness and healthy life behaviour associated with the concentration and anxiety
levels that vary from every student and academic performance of each level or class and yield products in
the form or teaching materials for the development of dominant movement patterns and the suitable learning
models for elementary school students. Based on the results of field survey and data analysis, physical
fitness of students in Bandung showed that 39.70% of the students were in the category of inadequate,
29.38% were in good category, 26.77% were in enough category, and 3.94% very good.
1 INTRODUCTION
The current teenagers’ social life is really worrying
and dangerous if they left without guidance of
parents, teachers and others. Teenagers can be
channeled with positive activities, such as
extracurricular of sports activities, art, and others
(Djaja, 2003). Extracurricular activities are activities
outside the classroom that are very useful for
students (Hackney and Viru, 1999). Extracurricular
activities that can be followed by the students are a
team sport, for example basketball, volleyball,
soccer, futsal, and so on, whereas, the individual
extracurricular are namely karate, badminton,
taekwondo, athletic and others (Blair and Church,
2004). By Brownlee et al. (2005), it is expected to
affect the increase the students’ concentration, as
described by Bailey et al. (2009). In the article
entitled Physical education, Physical activity and
academic performance. It is mentioned that physical
education and physical activity which are done
regularly will affect students’ physical fitness and
learning achievement (Gill, 2007). Another study
says that the influence of physical education and
physical activity can affect academic achievement in
children (Kalman et al.., 2004). The study was
conducted to 214 children for 2 semesters, by Strong
et al. (2005), at Tarleton State University. The
impact of physical activity on the extracurricular as
presented in Niel Egelund's research results, which
was published by Medical Daily in detik health,
states that the sports that are done when leaving for
school by walking or cycling are reflected in the
concentration level that lasted until 4 hours later.
In this study, the researcher team analyzed the
extent to which portrayals of physical fitness,
concentration, anxiety and healthy living behavior
(Daly et al., 2004). In addition, the specific purpose
of this study is to obtain empirical evidence of the
large role of learning models application that
associated with physical fitness levels,
concentration, stress levels (cortisol response) and
healthy life behaviors (Kirschbaum et al., 2000).
2 METHODS
The qualitative method research method was used in
the present study. The research site based on the
research plan was in accordance with the target
population of the study, which are all elementary
school students in Bandung. Research population are
Nuryadi, N., Nagara, J., Juliantine, T. and Slamet, S.
Profile of Physical Fitness, Healthy Life Behavior, Anxiety and Concentration Level of Elementary School.
In Proceedings of the 2nd International Conference on Sports Science, Health and Physical Education (ICSSHPE 2017) - Volume 2, pages 461-465
ISBN: 978-989-758-317-9
Copyright © 2018 by SCITEPRESS – Science and Technology Publications, Lda. All rights reserved
461
shown on Table 1 of name’s school, location, and
subject.
Table 1: Research Population.
NO
Name’s School
Lokation
Subject
1.
SDN Banjarsari
Kota Bandung
22
2.
SDN Ciparay 07
Kab Bandung
25
3.
SDN Langensari
Lembang
Kab Bandung
Barat
20
4.
SDN Ciumbuleuit
Kota Bandung
20
5.
SDN Cimandiri
Kota Cimahi
20
6.
SDN Cikalong Wetan
Kab Bandung
Barat
20
3 RESULTS AND DISCUSSION
After obtaining the data to the research sites, the
following is a description of fitness profile analysis,
healthy life behaviour, anxiety, and level of
concentration in the elementary schools in Bandung.
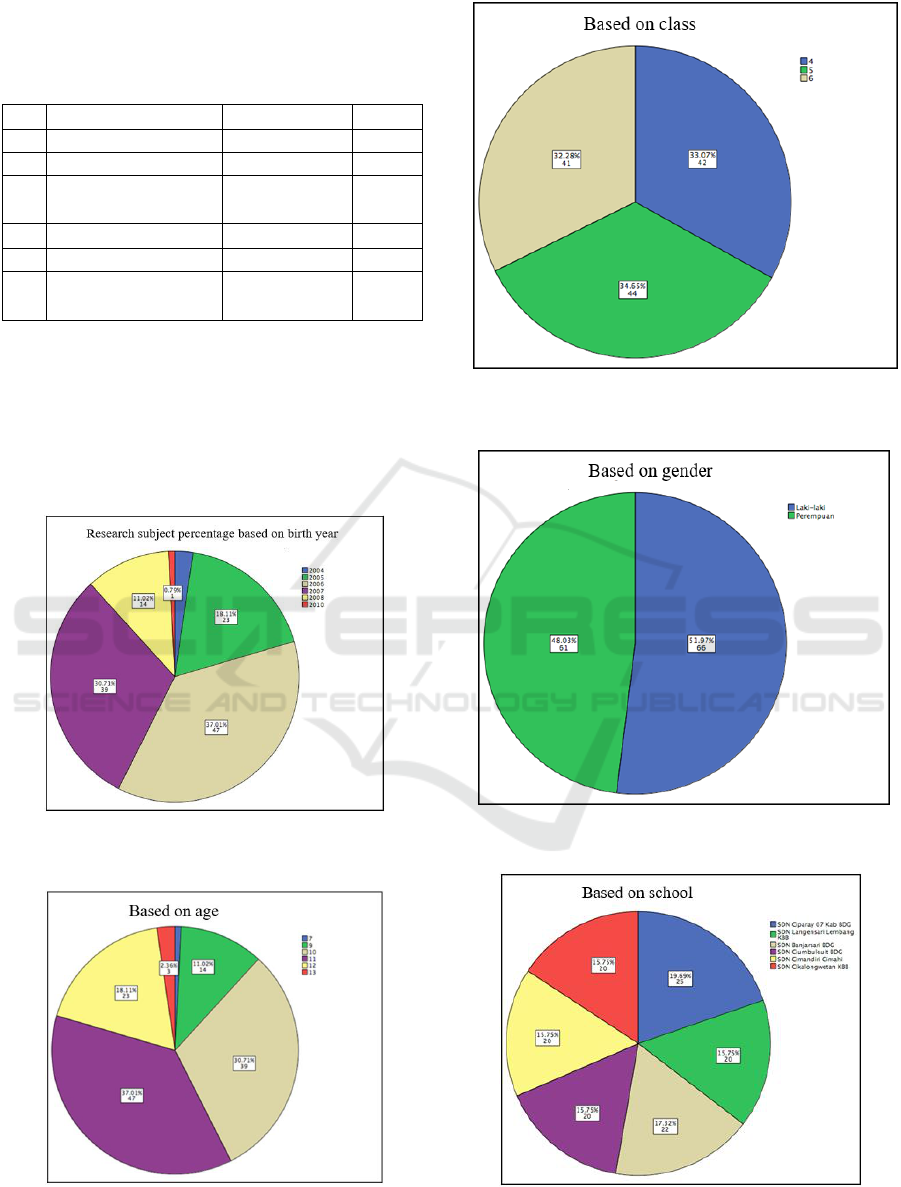
Figure 1: Percentage of Subject Number Based on Year of
Birth Graphic.
Figure 2: Percentage of Subject Number Based on Age
Graphic.
Figure 3: Percentage of Subject Number Based on Classes
Graphic.
Figure 4: Percentage of Subject Number Based on Gender
Graphic.
Figure 5: Percentage of Subject Number Based on School
Graphic.
ICSSHPE 2017 - 2nd International Conference on Sports Science, Health and Physical Education
462
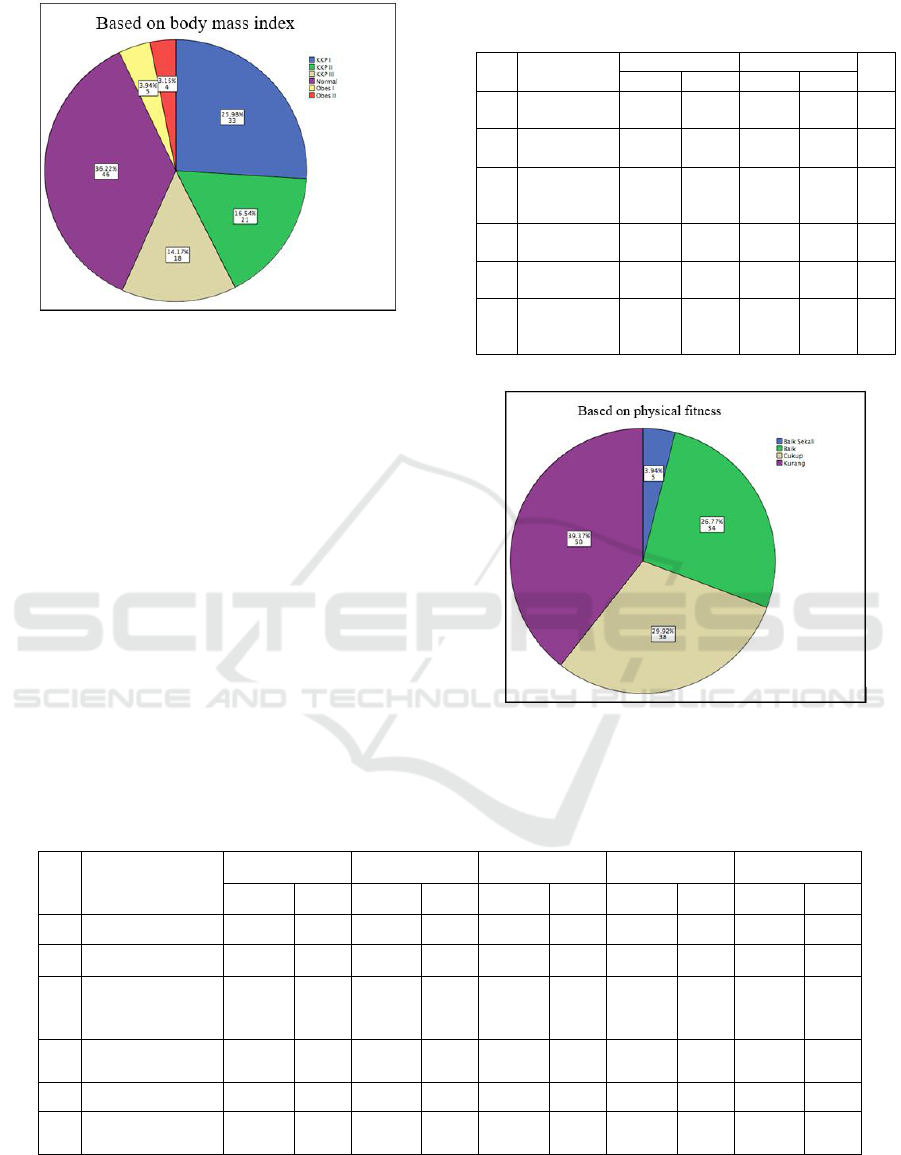
Figure 6: Percentage of Subject Number Based on Body
Mass Index Graphic.
Figure 1 describes percentage of subject number
based on year of birth graphic. Figure 2 explains
percentage of subject number based on age graphic.
Figure 3 explains percentage of subject number
based on classes graphic. Figure 4 explains
percentage of subject number based on gender
graphic. Figure 5 explains percentage of subject
number based on school graphic. Figure 6 explains
percentage of subject number based on body mass
index graphic. Figure 7 explains percentage of
subject number based on physical health graphic.
Table 2 describes recapitulation of weight and
height measurement results based on the origin of
the school. Table 3 explains recapitulation of tap 5
measurement results, grid exercise, healthy life
behavior, anxiety, and physical activities based on
the origin of the school.
Table 2: Recapitulation of Weight and Height
Measurement Results Based on the origin of the School.
No
Name’s
school
Body Weight
Body Height
n
mean
sd
mean
sd
1
SDN
Banjarsari
30.20
8.46
1.34
0.070
25
2
SDN
Ciparay 07
32.60
7.03
1.37
0.074
20
3
SDN
Langensari
Lembang
36.00
9.81
1.33
0.105
22
4
SDN
Ciumbuleuit
35.50
850
1.41
0.099
20
5
SDN
Cimandiri
38.40
5.38
1.35
0.065
20
6
SDN
Cikalong
Wetan
38.10
11.25
1.39
0.094
20
Figure 7: Percentage of Subject Number Based on
Physical Health Graphic.
Table 3: Recapitulation of Tap 5 Measurement Results, Grid Exercise, Healthy Life Behavior, Anxiety, and Physical
Activities Based on the origin of the School.
No
School
Tap 5
Grid Exert
PHS
Anxiety
AF
Mean
SD
Mean
SD
Mean
SD
Mean
SD
Mean
SD
1
SDN Banjarsari
88.92
20.22
4.00
1.53
207.92
18.50
48.32
5.92
43.64
7.38
2
SDN Ciparay 07
89.60
25.36
4.45
1.76
186.10
15.91
52.65
7.99
44.90
5.70
3
SDN
Langensari
Lembang
86.73
24.99
4.45
2.11
213.55
18.25
72.18
13.69
33.18
7.49
4
SDN
Ciumbuleuit
105.00
24.40
4.25
2.07
222.85
14.46
111.05
10.75
43.05
6.28
5
SDN Cimandiri
95.25
24.97
5.20
2.46
182.75
9.26
113.50
22.25
44.60
8.05
6
SDN Cikalong
Wetan
75.75
19.68
5.40
1.85
195.75
15.18
102.15
15.82
37.65
4.20
Profile of Physical Fitness, Healthy Life Behavior, Anxiety and Concentration Level of Elementary School
463
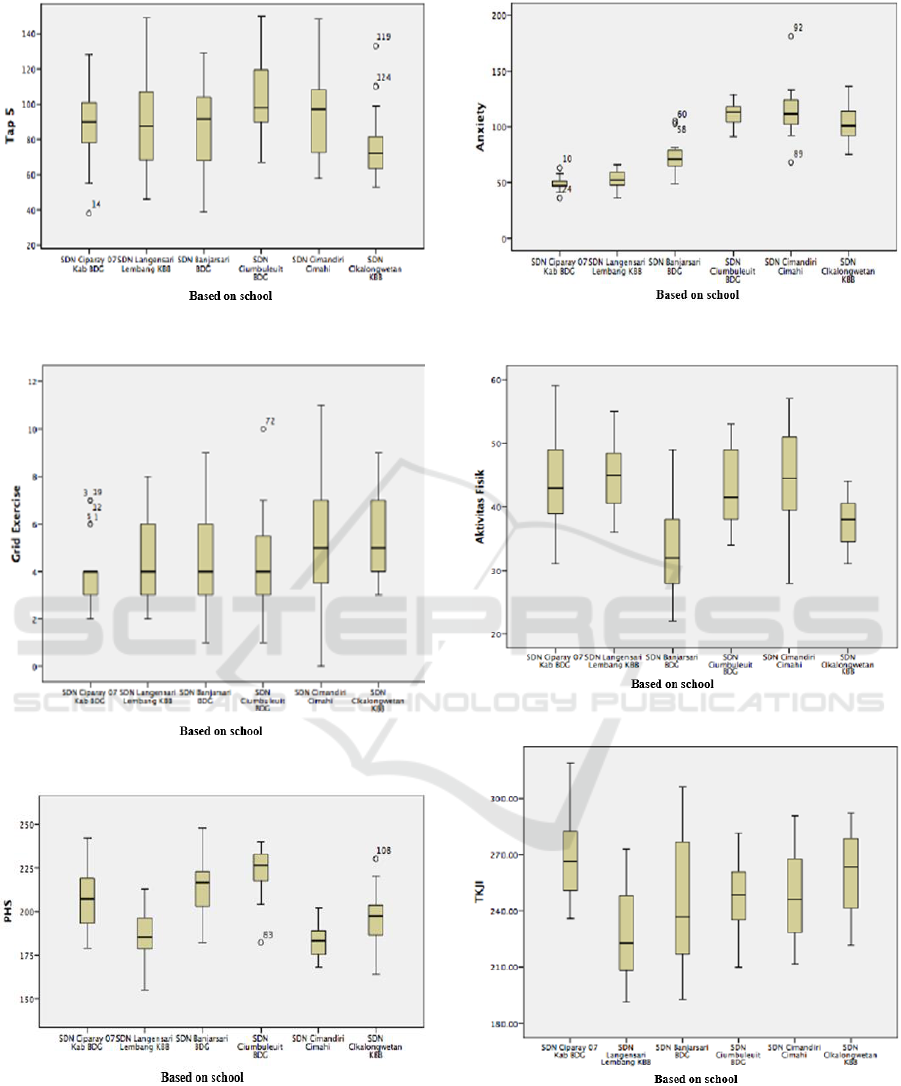
Figure 8: Boxplot Graphic Based on Tap 5.
Figure 9: Boxplot Graphic Based on Grid Exercise.
Figure 10: Bloxspot Graphic Based on Healthy Life
Behavior.
Figure 11: Boxplot Graphic Based on Anxiety.
Figure 12: Boxplot Graphic Based on Physical Activities.
Figure 13: Boxplot Graphic Based on Physical Fitness.
Figure 8 describes boxplot graphic based on tap
5. Figure 9 explains boxplot graphic based on grid
exercise. Figue 10 explains bloxspot graphic based
on healthy life behavior. Figure 11 explains Boxplot
graphic based on anxiety. Figure 12 explains boxplot
ICSSHPE 2017 - 2nd International Conference on Sports Science, Health and Physical Education
464

graphic based on physical activities. Figure 13
explains boxplot graphic based on physical fitness.
4 CONCLUSIONS
Based on the results of field surveys and data
analysis results, it can be concluded:
The physical fitness of students in Bandung
showed that 39.70% of the students were in the
category of inadequate, 29.38% were in good
category, 26.77% were in enough category, and
3.94% were very good.
Each school with high physical fitness had a
negative relationship to the decrease of anxiety. This
means that students, who had high physical fitness,
had low anxiety.
REFERENCES
Bailey, R., Armour, K., Kirk, D., Jess, M., Pickup, I.,
Sandford, R., & Education, B. P. (2009). The
educational benefits claimed for physical education
and school sport: an academic review. Research
papers in education, 24(1), 1-27.
Blair, S.N., & Church, T.S. (2004). The fitness, obesity,
and health equation: is physical activity The common
denominator? JAMA, 292(10): 1232-1234.
Brownlee, KK., Moore, AW., Hackney, AC. 2005.
Relationship Between Circulating Cortisol and
Testosterone : Influence of Physical Exercise. Journal
of Sports Science and Medicine. Vol 2005 (4) : 76-83
Daly, W., Seegers, C., Timmerman, S. and Hackney, A.C.
2004. Peak cortisol response to exhausting exercise:
effect of blood sampling schedule.Medicina Sportiva 8
: 1-4
Djaja, Sarimawar et.al., (2003). Pola penyakit kematian di
perkotaan dan pedesaan di Indonesia, Studi
Mortalitas Survei kesehatan Rumah Tangga (SKRT)
2001. Jurnal Kedokteran Trisakti. Vol 22: 2.
Gill, T. (2007). Young people with diabetes and obesity in
asia. Growing epidemic. Diabetes Voice. 52, 20-22.
Hackney, A.C. and Viru, A. 1999. Twenty-four-hour
cortisol response to multiple daily exercise sessions of
moderate and high intensity.Clinical Physiology 19 :
178-182.
Kalman, Brian A; Ruth E, Grahn. (2004). Measuring
Salivary Cortisol in the Behavior Neuroscience
Laboratory. The Journal of Undergraduate
Neuroscience Education (JUNE). Spring. 2(2): A41-
A49.
Kirschbaum, Clemens; Dirk H, Hellhammer. (2000).
Salivary Cortisol. University of Trier, Germany.
Encyclopedia of Stress. Vol 3.
Strong, W. B., Malina, R. M., Blimkie, C. J., Daniels, S.
R., Dishman, R. K., Gutin, B., ... & Rowland, T.
(2005). Evidence based physical activity for school-
age youth. The Journal of pediatrics, 146(6), 732-737.
Profile of Physical Fitness, Healthy Life Behavior, Anxiety and Concentration Level of Elementary School
465
