
Development of Bleep Test Team Software
Muhammad Zaki Waluya, Fajar Agni Fauzan and Rosadi Turjamil
Sport Education Program, Postgraduate School, Universitas Pendidikan Indonesia, Jln. Dr. Setiabudhi No. 229, Bandung,
Indonesia
Mochzaki4@gmail.com
Keywords: Bleep Test, VO2max.
Abstract: Bleep test team software development research was motivated by the implementation of bleep test which is
only guided by the audio CD recording without automatic recording, then the development of domestic
software that is easier, practical, effective, and efficient in running its process was needed. With the
domestic bleep test software, it will be easier for testees to monitor the running of test, easily and
practically. The purpose of this research is to produce bleep test team software product or in other language
that is, 20m multi stage fitness. Bleep test is one of the tests to measure the prediction of maximum aerobic
abruption or VO2max. The main function of this software is to guide the way bleep test that facilitates the
testee in monitoring the tester with automatic record value. The research method used is adapted from
research method of Research and development Sugiyono that is with stages: (1) Potential and Problem (2)
Information Collection (3) Product Design (4) Design Validation (5) Design Repairing (6) The trials
product. The result of validation test and trials performed, starting from simulated bleep test software and
field experiments, show that it generally worked well, and software programs are aligned in accordance with
the bleep test rules created by experts.
1 INTRODUCTION
In modern times today, it is undeniable that science
and technology (science and technology) have many
roles and help in improving the quality of human
life, especially in learning and achievement in
sports. The development of science and technology
is very necessary. Every innovation is created to
provide positive benefits for human life (Kurniawan,
2004). Providing many conveniences, as well as a
new way of doing human activities. Technology,
especially in data collection and analysis techniques
by computerization, will help the athletes and their
coaching staff to achieve faster and more precise
targets (Fox, 2003). For example, by adopting data
analysis techniques that have been frequently used
by office companies, to improve performance and
measure employee satisfaction, into the world of
sports with the intended target by athletes and
coaches that can be achieved.
In general, sports require a good physical
condition for an athlete to excel in each sporting
branch of each. One of the most important physical
elements of exercise is the endurance of
cardioresviration (Armstrong, 2006). Basically, there
are two kinds of cardiorespiratory resistance, aerobic
and anaerobic. During exercise in general, anaerobic
resistance is required to perform explosive
movements that require an explosion of energy
(Rodrigues, 2006). However, for the game in
general, movement patterns, as well as recovery
time, aerobic resistance is needed. Measurements of
cardiorespiratory resistance to aerobic capacity can
be performed by measuring maximal oxygen
consumption (VO2max). VO2max is the maximum
amount of oxygen that can be consumed during
intense physical activity until eventually fatigue
occurs (Astorin, 2000). Measurement of VO2max
values can be used to analyze the effects of a
physical exercise program.
One of the VO2max measurement tests is bleep
test, according to Iztok (2012) The multi-stage 20-m
shuttle run test (MSRT) is one of the most popular
field tests of the maximum speed for an indirect
estimation of maximal oxygen uptake (VO2max).
From the above statement, it can be concluded that a
multi-stage 20-m shuttle run test or also called bleep
test is one of the popular field tests used to find the
estimated value of VO2max. The VO2max value
data is used as an evaluation for athletes, both in
Waluya, M., Fauzan, F. and Turjamil, R.
Development of Bleep Test Team Software.
In Proceedings of the 2nd International Conference on Sports Science, Health and Physical Education (ICSSHPE 2017) - Volume 2, pages 257-261
ISBN: 978-989-758-317-9
Copyright © 2018 by SCITEPRESS – Science and Technology Publications, Lda. All rights reserved
257
training evaluations and as parameters of exercise
attainment (Uliyandari, 2009).
Based on the author's observations after
searching the source on the internet at the end of
July 2014 from the number of websites that write
about the bleep test, also was reinforced by the
statement of sports experts in one of the colleges of
sports in Indonesia, that there is no software bleep
test in release from Indonesia. Other problems that
occur is that most of the test bleep in Indonesia are
only done with cassettes containing beep sound
(Audio CD) to guide the bleep test and the tapes are
overseas products that recording the results are still
done manually, and it also requires a lot of testee
(people who do testing) to monitor the course of the
bleep test which is miscalculation likely to happen
due to human error and it will affect the lack of
accuracy of the estimated results of test bleep
conducted. Maybe this is happening because in
Indonesia there is no collaboration to innovate
between sports experts with IT experts to develop a
software in sports that helps to support athlete’s
performance (Mulyanto, 2008).
Then after the author observed some of its
functions, there are still weaknesses in the software
that storage recording results must be done one by
one, then the absence of indicator bleep time test
shown to be shown to the testee for the tester to test
bleep with maximum. The results of tests and
statistics that complicate the reader and then input
data tester amounted to 41 people and the absence of
a number indicator to adjust to the tester, thus will
complicate the testee in supervision bleep test team
(Brian, 2005). Therefore, the authors conclude that
the need for the manufacture of domestic software
that developed the software test bleep by looking at
some of the deficiencies of foreign software that has
been the author to describe, as well as for more
efficient software with affordable prices.
2 METHODS
2.1 Participants
The population in this research is the students of
Sport Science, and the sample in this research were
10 students of Sport Science. The sampling
technique used was purposive sampling technique
because at this time of testing, it was only conducted
to see the work of software.
2.2 Procedures
In this study, the method of R & D for the final
results of this research will produce Bleep Software
Test Team. Research methods Research and
Development (R & D) is a research method that is
used to produce a specific product and test the
effectiveness of the product. To produce a specific
product, research that needs analysis and to test the
effectiveness of these products in order to function
in the wider community is used. It is a necessary
research to test the effectiveness of these products,
Sugiyono (2013).
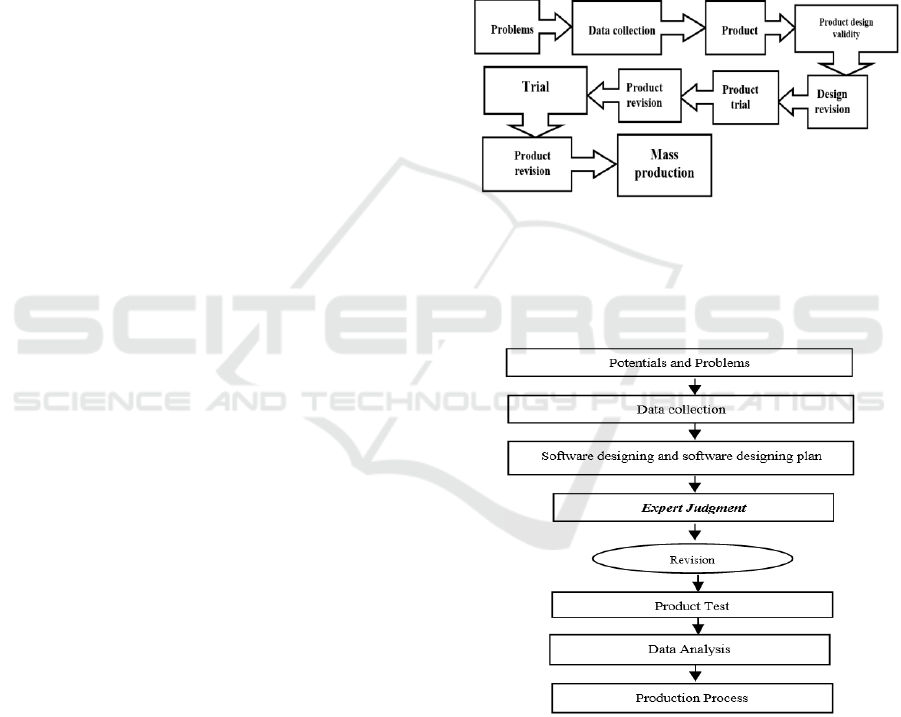
Figure 1: Diagram of R & D Research Procedure.
From 10 steps developed by Sugiyono (2013),
only 6 steps will be adapted in this research that is
step 1 to 6, here is a diagram of research flow used
in this research can see in figure 2:
Figure 2: diagram of research flow.
2.3 Second Section
Instruments used in this research in order to test the
perform of Bleep Test Team Software:
One Personal Computer or laptop;
Open field, minimum 30 m X 30 m;
Cones;
Speaker.
ICSSHPE 2017 - 2nd International Conference on Sports Science, Health and Physical Education
258
Each column must be 7,5-centimeter wide with a
column spacing of 0,8-centimeter.
The section text must be set to 10-point, justified
and line space single.
Section, subsection and sub subsection first
paragraph should not have the first line indent, other
paragraphs should have a first line indent of 0,5-
centimeter.
3 RESULTS AND DISCUSSION
3.1 Results of Bleep Test Team
Software
The test is performed by using the software for
testing the Bleep test, then testing the suitability of
commands or functions present in the software and
comparing the VO2max results in the Software with
the VO2max table created by the experts. Then do a
comparison with other Bleep test software that is Bit
Work Bleep Test with audio CD. The following
stages in this trial process include the following:
3.1.1 Software Simulation
This simulation is carried out by running the
Software and taking some Bleep test software output
performed by IT experts from Maranatha Christian
University and a sports measurement expert, which
is its own supervisor to assess the suitability of
Bleep test rules. In general, this simulation aims to
determine whether the commands in the software
works well or not, then to find out whether the
software has been programmed in accordance with
the rules of Bleep test or not, such as setting
program level, feedback and VO2max estimates.
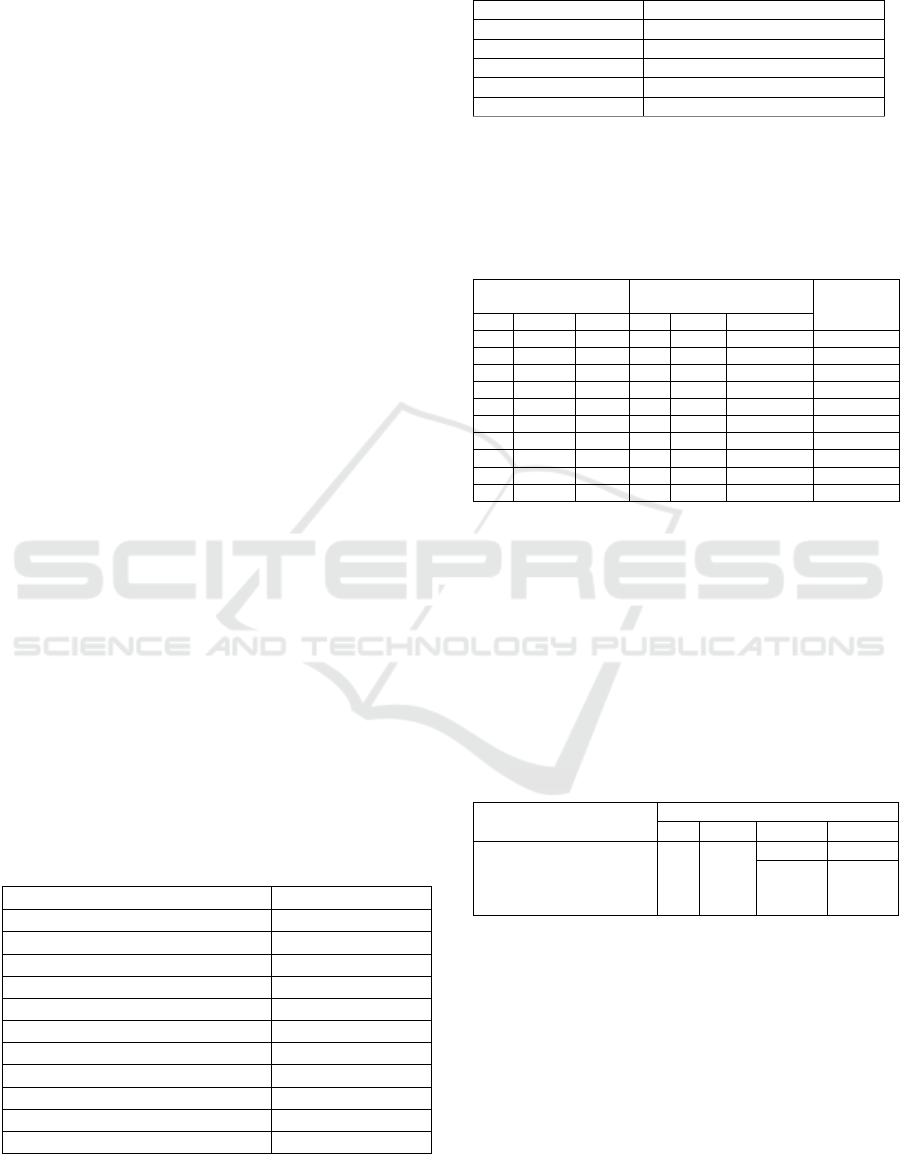
Here are the scoring table results:
Table 1: Assessment Tool and Software Menu.
SECTION / BUTTON / MENU
ASSESSMENT
Start
Works
Number Button
Works
Done
Works
Files
Works
Fill in the Data
Works
Test Results
Works
Statistics
Works
Print
Works
Export
Works
Can be installed on any computer
Works
Beep’s voice
Works
Table 2: Assessment of functions in software with bleep
test rules.
PART
ASSESSMENT
Beep’s voice
Corresponding
Level
Corresponding
Reverse
Corresponding
Time level
Corresponding
Total Time
Corresponding
The following table 3 is the result of some Bleep
test software output from the Software simulation
performed, and the comparison with the VO2max
table data According to Leger (1982).
Table 3: Comparison Table of VO2max Results.
Software Bleep Test
MSF VO2max Data Source
Table (Brian, 2005)
VO2max
Value
Differences
Level
Reverse
VO2max
Level
Reverse
VO2max
4
2
27,1
4
2
26,8
0,3
5
2
30,2
5
2
30,2
0,0
6
2
33,6
6
2
33,6
0,0
7
2
36,9
7
2
37,1
-0,2
8
2
40,4
8
2
40,5
-0,1
9
2
43,8
9
2
43,9
-0,1
10
2
47,2
10
2
47,4
-0,2
11
2
50,8
11
2
50,8
0,0
12
2
54,2
12
2
54,3
-0,1
13
2
57,9
13
2
57,6
0,3
Table 4 shows when compared to the value of
VO2max produced by Software Bleep Test with
MSF Table values (Multi Stage Fitness, error up to ±
0.3 ml / kg / min. It is because the data above needs
to be compared whether there is difference or not
between result of VO2max using software and result
of VO2max according to Leger (1982), hence T test
was done by using independent T test in SPSS
because in above data, it was said there were 2
groups and one data. Here's the result.
Table 4: Comparison Table of VO2max Results.
t-test for Equality of Means
F
Sig.
t
df
vo2max
Equal variances assumed
Equal variances not
assumed
.439
.516
-.690
18
-.702
17.950
The significance value in the table above shows
the number 0,516. If the significance <0.05 then the
data stated there is said to have a difference, if
significance> 0.05 then the data is said to not have a
difference. Since the comparison of VO2max above
has a significance value of 0.516> 0.05 then the
above comparison data shows that there is no
difference in the mean results of VO2max in the
bleep test software team in accordance with the
estimation of the calculations of experts.
Development of Bleep Test Team Software
259
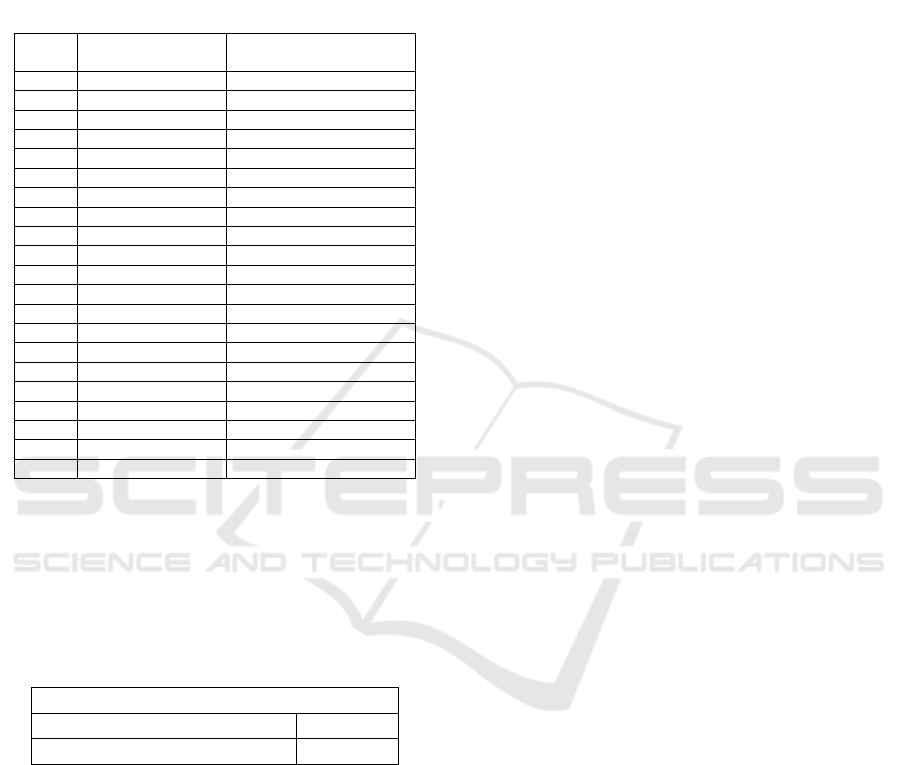
The table 5 shows the timing specified by the
author, the maranatha IT state that it is difficult to
equate the millisecond in the test bleep formula into
the software. Then there is time adaptation for
seconds.
Table 5: Comparison of time in software by the formula.
Level
Time in Software
Time in Table
Leger (1982)
1
9
9
2
8
8
3
8
7,58
4
7
7,2
5
7
6,86
6
7
6,55
7
6
6,26
8
6
6
9
6
5,76
10
6
5,54
11
5
5,33
12
5
5,14
13
5
4,97
14
5
4,8
15
5
4,65
16
5
4,5
17
4
4,36
18
4
4,24
19
4
4,11
20
4
4
21
3
3,89
Since the data above wants to compare whether
there is difference or not between time adapted into
software with time according to Leger (1982) then T
test is done using independent T test in SPSS
because above data are said 2 groups and one data.
Here's the result can see in figure 6.
Table 6: Non-parametric Test.
Test Statistics
a
TIME
Asymp. Sig. (2-tailed)
.890
Since the data is not normal, (data attached) then
the non parametrik test was conducted, the above
table is the result of non-parametric test. Visible to
the significance value of data above 0.890 > 0.05 it
means that there is no significant difference between
time in software with bleep time test according
Leger (1982).
4 CONCLUSIONS
Software bleep test team is made starting from the
stage of data collection, software design, coding or
coding stage is done to translate design into the
program language understood by the computer
according to function, data and bleep test rules that
have been made by experts. This team‘s bleep test
software serves as a computerized application that
will make it easier to guide test bleep tests on a team
basis by generating more effective records and
acting as an intermediary between the tester and the
teste to perform activities with commands to be
performed in computer software.
This software will work automatically to guide
the way bleep test when a user pressing the start
button then the time indicator in the software will
run and the beep sound will come out of the
speakers that have been installed with the computer
device, the beep sound will be in accordance with
the time level specified thus the tester performs a
test bleep or runs a distance of 20 meters back and
forth following the bleep rhythm coming out of the
loudspeaker. If the testee is unable to follow the
prescribed beep rhythm or is considered unable to
run again then the user must press the number button
to stop the test. Results will exit if all the testing has
been stopped with the finished button. If the result is
finished the user will be given the choice of whether
the result of the document will be printed directly or
the result is exported to Ms Word. Ms Excel and
Adobe Reader. It can be concluded that only need to
input data then press start button to start, number
button to stop the test per individual, and finish to
stop the process, eat result of VO2max already can
be assessed and analyzed.
REFERENCES
Uliyandari, A., 2009. Pengaruh Latihan Fisik Terprogram
Terhadap Perubahan Nilai Konsumsi. Oksigen
Maksimal (Vo2max) Pada Siswi Sekolah Bola Voli
Tugu Muda Semarang Usia 11-13 Tahun, Karya Tulis
Ilmiah, Universitas Diponegoro.
Kurniawan A., Adnan R., Aryaputra P., Sasono N.,
Heryana A. A., Rahman M. F., Saryada I. W., Wirasta
A., 2004. Pengenalan Bahasa C#, Project Otak.
Jakarta.
Astorin, T., Robergs, R., Ghiasvand, S., Marks, D., Burns,
S., 2000. Incidence of the Oxygen Plateauat VO2max
during Exercise Testing to Volitional Fatigue. Journal
of The American Society of Exercise Physiologist. 3: 2.
Armstrong, N., 2006. Aerobic fitness of children and
adolescents. Jornal de pediatria. 82(6), 406-408.
Mulyanto A. R., 2008. Rekayasa Perangkat Lunak Jilid 1,
Direktorat Pembinaan Sekolah Menengah Kejuruan.
Brian, M., 2005. 101 Ferformance Evaluation Test,
Electric Word Plc. London.
ICSSHPE 2017 - 2nd International Conference on Sports Science, Health and Physical Education
260

Fox SI. (2003). Muscle : Mechanism of Contraction and
Neural Control. In : Fox SI. Human Physiology, 8nd
ed. Kota : McGraw-Hill. p. 343.
Iztok Kavcic (2012) Comparative study of measured And
predicted vo2max during a multi-stage Fitness test
with junior soccer players. comparative study of
measured and predicted. Kinesiology 4(2012) 1:18-23
Leger, L. A., & Lambert, J. (1982). A maximal multistage
20-m shuttle run test to predict VO2 max. European
journal of applied physiology and occupational
physiology, 49(1), 1-12.
Brian, Mackenzie. (2005) Multi-Stage Fitness Test Table
[WWW] Available from:
http://www.brianmac.co.uk/msftable.htm [Accessed
13/8/2014]
Rodrigues, A. N., Perez, A. J., Carletti, L., Bissoli, N. S.,
& Abreu, G. R. (2006). Maximum oxygen uptake in
adolescents as measured by cardiopulmonary exercise
testing: a classification proposal. Jornal de Pediatria,
82(6), 426-430.
Sugiyono (2013). Metode Penelitian Kuantitatif, Kualitatif
dan R&D. Bandung: ALFABETA.
Development of Bleep Test Team Software
261
