
The Comparison of Player Movement in Global Positioning System
(GPS) Based Basketball Game
Arief Abdul Malik, Moch. Arif Romadlon and Hilda Indriani
Universitas Pendidikan Indonesia, Jln. Dr. Setiabudhi No. 229 Bandung, Indonesia.
ariefabdulmalik@student.upi.edu
Keywords: motion intensity, players’ position, polar.
Abstract: This research is about intensity motion about basketball players in every position. Intensity motion covers
distance travelled, calories used, and average speed of players to be taken during the competition. The aim of
this research is to compare intensity motion of basketball player based on its position. Method used in this
research is comparative method. Samples used in this research were 16 players of extracurricular basketball
team, selected by using the total sampling technique. A parametric statistical analysis of One-Way Anova on
calories and average speed groups. Then, the Kruskall-Wallis non-parametrical statistic on group of distance
travel. Results analysis show that the sig value on distance is 0.33 p > 0.05, on full calories is0.77, p > 0.05,
and on speed 0.71, p > 0.05. It can be concluded that there is a significant difference of distance travelled,
calories used, and average speed travelled by every player based on its position. No existence difference is
probably because of some in the field and training provided.
1 INTRODUCTION
The basketball is a game team and one of the
characteristic is dyniamic (Hoffman and Maresh,
2000). There are five positions of players in
basketball, which are: point guard (PG), shooting
guar (SG), small forward (SF), power forward (PF),
and center (C) (National Basketball Association,
2003). During the match, players always running,
stopping, and do movements, depending on the
situation in the game. So it is important to objectively
understand the intensity of players‘ movements
during the game in ordert o enhance the perfromance
of players (Oba and Okuda, 2009).
Research about intensity motion has been done
by various branch of sports. On a handball game,
there is a significant difference on volume and
intensity between motion player with its position as a
back player (backcourt player), wings player (wings),
pivot players (pivots), and guard wicket
(goalkeeppers) (Šibila, Vuleta and Pori, 2004). Beach
soccer is a sport that has high intensity because only
on the first half start, the players‘ physiological
profile shows intensity that reaches more than 90% of
heart rate (Castellano and Casamichana, 2010).
On basketball, analysis about inetensity motion is
done to know the performance of players and the
activity profile in various positions of different
players. The performance analysis of movements on
male and female basketball players on 4 categories
show that players spent 34.1 % of time to run and
jump, 56.8% to walk and 9% to stand (Narazaki,
Berg, Stergiou and Chen, 2009). The use of calories
for female basketball players for Female Regional
Sport Week (PORDA) West Java, is known that
position 4 (Power Forward) and position 5 (Center),
mainly move in the field compared to other positions,
because those positions released more calories than
other positions. However, previous researches hasn’t
yet leads in detail on analysis of intensity motion on
basketball players in the field (Arisandi, 2015). Then,
with the use of vision computer technique, it is known
that intensity movement of player and speed on all
position of basketball players spend more than 60 %
of the total time movement with low intensity and
speed less from 1.4 m / s (Erčulj, Vučković, Perš,
Perše and Kristan, 2008).
Global Positioning System (GPS) is a navigation
satellite system that uses 27 satellites that orbit the
earth (Larsson, 2003). The GPS system can be used
18
Malik, A., Romadlon, M. and Indriani, H.
The Comparison of Player Movement in Global Positioning System (GPS) Based Basketball Game.
In Proceedings of the 2nd International Conference on Sports Science, Health and Physical Education (ICSSHPE 2017) - Volume 2, pages 18-21
ISBN: 978-989-758-317-9
Copyright © 2018 by SCITEPRESS – Science and Technology Publications, Lda. All rights reserved
to analyze the training process of sport especially
outdoor sports (Leser, Baca, Ogris, Science and
Gmbh, 2011). The use of of GPS has been
implemented on various type of sports among others
are Australian Football, Criket, Hockey, Rugby and
Soccer (Aughey, 2014).
Based on description above, researchers want to
compare distance traveled, calories used and average
speed of basketball players based on its position with
the use of GPS approach.
2 METHOD
2.1 Design
A research with comparative approach to find out the
comparison of distance traveled, calories used and
average speed on players based on their position
(Junior, Misuta and Mercadante, 2017).
2.2 Participants
Samples of this research used the total sampling
method consists of 16 male students from basketball
extracurricular on high school level that followed the
Regular Basketball competition on provinces level in
Indonesia. Samples were divided according to their
position: 3 point guards, 3 small guards, 4 small
fowards, 3 point fowards, and 3 centers.
2.3 Instrument
Instruments used is polar GPS RC3 and polar V800
GPS. Data obtained through implementation of
simulation matches, and on every player installed
Polar GPS that has been synced to the web
polarpersonaltrainer.com. After obtaining the value
of distance traveled, calories used and average speed
of players then the data is analyzed using One-Way
Anova for distance travel and calories used and
Kruskall -Wallis for distance travel. Game was
conducted in 4x10 minutes and played at the outdoor
field.
3 RESULTS AND DISCUSSION
Table 1: Distance covered, calorie and velocity range based
on player positions.
Player
Position
Distance Covered
(km)
Calorie
(kcal)
Velocity range
(km h
-1
)
1
PG
2.56
640.00
2.00
2
PG
2.47
711.00
2.80
3
PG
2.80
796.00
2.30
Average
2.61
715.67
2.37
4
SG
2.64
605.00
3.00
5
SG
2.40
671.00
2.60
6
SG
3.60
780.00
2.30
Average
2.88
685.33
2.63
7
SF
2.81
699.00
3.10
8
SF
2.70
718.00
3.00
9
SF
2.96
716.00
2.80
10
SF
2.72
758.00
2.20
Average
2.80
722.75
2.78
11
PF
2.49
496.00
2.80
12
PF
2.16
672.00
2.40
13
PF
2.44
792.00
2.10
Average
2.36
653.33
2.43
14
C
2.88
740.00
2.40
15
C
2.74
723.00
3.10
16
C
2.00
726.00
2.10
Average
2.54
726.33
2.53
In table 1 shows that the average distance travel,
calories and average speeds for PG are 2.61, 715.67,
and 2.37. SG is 2.88, 685.33, and 2.63. SF is 2.80,
722.75, and 2.78. PF is 2.36, 653.33, and 2.43. C is
2.54, 726.33, and 2.53.
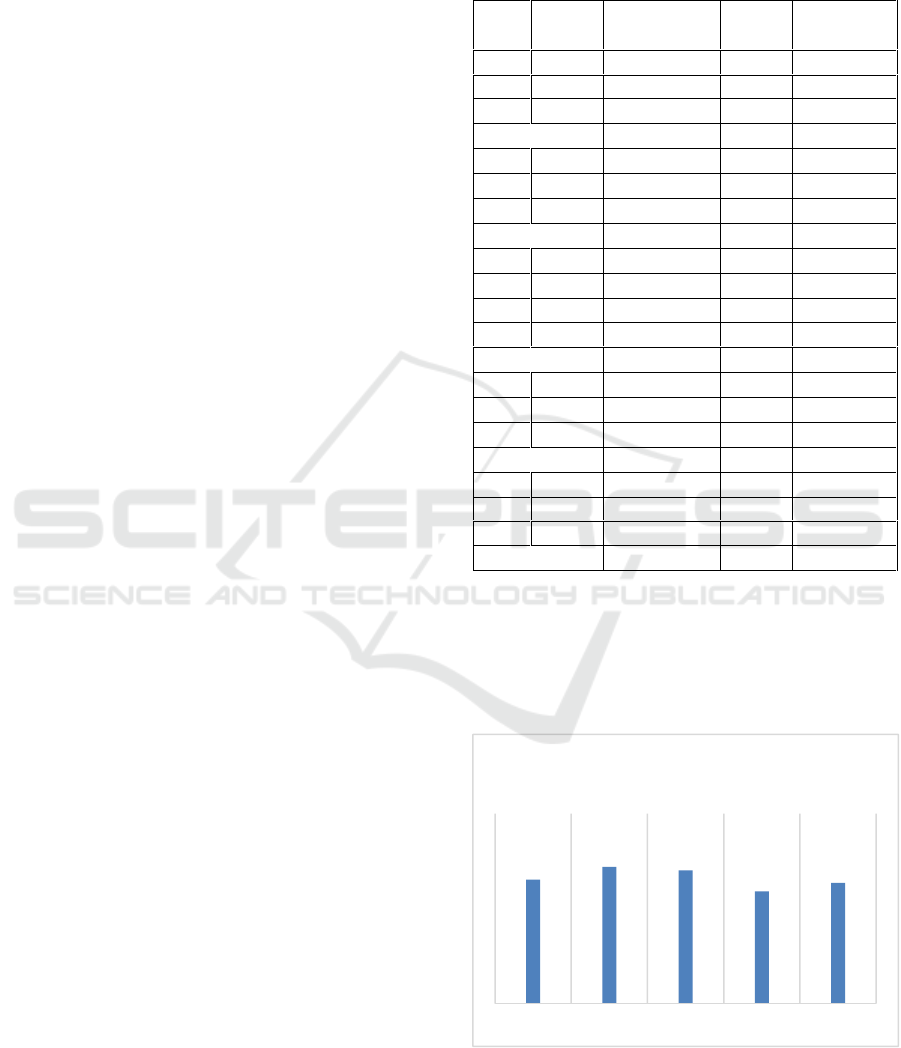
Figure 1: Average of distance covered based on player
positions.
2.61
2.88
2.8
2.36
2.54
P G S G S F P F C
DI SCTAN CE COVE R ED
The Comparison of Player Movement in Global Positioning System (GPS) Based Basketball Game
19
On Figure 1 shows the highest average distance
travel is on SG position, 2.88 km and lowest is PF
position, 2.36 km.
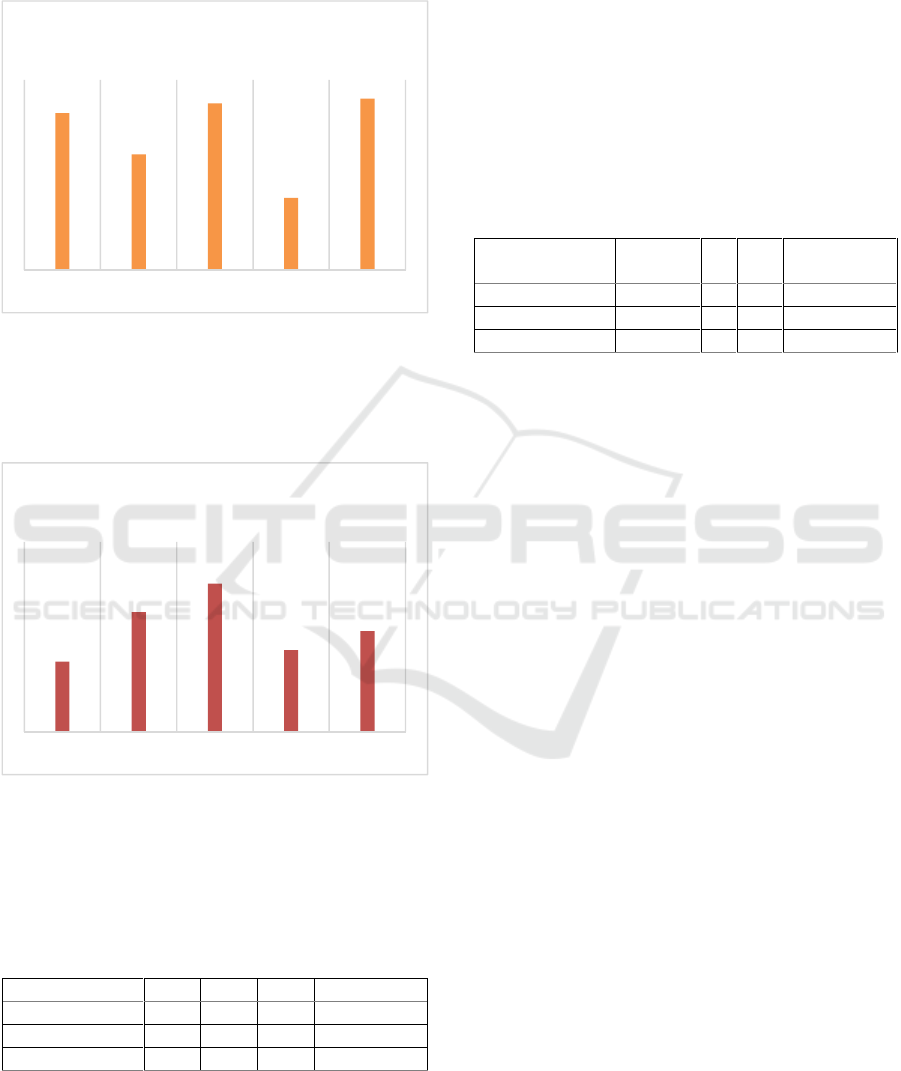
Figure 2: Average of calorie based on player positions.
On Figure 2 shows that the highest average usage
of calories is on position C, 726.33 kcal and lowest is
PF position, 653.33 kcal.
Figure 3: Average of calorie based on player positions.
On Figure 3 shows the highest average speed is on
SF position, 2.78 km h -1 and Lowest is PG position,
2.73 km h -1.
Table 2: One Way Anova test of distance covered, calorie
and velocity range based on player positons.
F
dF
Sig.
Conclusion
Distance covered
1.03
15
0.43
No difference
Calorie
0.44
15
0.77
No difference
Velocity range
0.54
15
0.71
No difference
Based on table 2, the significance values from to
three group, if compared with the alpha level is 0.05,
then all significance value is bigger from 0.05, so it
could be concluded that there is no significant
difference in heart rate, distance, calories used, and
average speed of male basketball players in various
position. However, for data on distance is not yet
concluded, because the data is not homogeneous so
statistics nonparametric kruskall-wallis was used.
However on all group a test was conducted using
Kruskall-Wallis, for the result tob e compared with
the testing of one way Anova. Following is the results
analysis of Kruskall-Wallis‘ nonparametric statistics
use.
Table 3: Kruskal Wallis test of distance covered, calorie and
velocity range based on player positions.
Chi-
Square
dF
Sig.
Conclusion
Distance covered
4.61
4
0.33
No difference
Calorie
1.41
4
0.84
No difference
Velocity range
2.47
4
0.65
No difference
On table 3 is known, the value of chi-square
distance 4.61 with sig value 12:33, chi-square value
of calories 1:41 with sig value 0.84, as well value chi-
square speed 2.47 with sig value 0.65. Based on value
significance from those three groups, if compared
with the alpha level 0.05, then all value‘s significance
is bigger than 0.05, so it could be concluded that there
is no significant difference in distance, calories used,
and average speed of men‘s basketball players in
various positions.
According to the results of data processing and
analysis, obtained results that there is no significant
difference between heart rate, players‘ travelled
distance, calories usage, and average speed traveled
for competition from every inter position basketball
players. The movement in basketball game is
categorized as dominating slow movement, however
this depends from individual perception when they
watch or see the basketball competition (Vučković,
Dežman, James and Erčulj, 2010).
The center position also has the highest average of
calorie. On previous research, the value of calories for
every position is significantly different, especially on
Center and power forward position (Garrett and
Kirkendall, 2000), however there is no significant
difference on this research, with the highest value is
on Center and followed with small forward position.
It is because of position center and small forward do
more activities, such as jumping to block the ball in
the field since the have the weight to protect the ring
from opponent, meanwhile power forward position is
yet to understand about task they should do.
Based on information obtained from the coach of
concerned basketball team, there is no significant
715.67
685.33
722.75
653.33
726.33
P G S G S F P F C
CA LORI E
2.37
2.63
2.78
2.43
2.53
P G S G S F P F C
VELOCITY RAN G E
ICSSHPE 2017 - 2nd International Conference on Sports Science, Health and Physical Education
20

difference of players‘ intensity motion because of the
same exercise factor. Volume and physical exercise
intensity given to player is not differentiated based on
the position. Specific exercises are only given during
the technical exercise to point guard position. It is
aimed to order all players on the pitch issued
maximum performance, and have a good endurance
power.
4 CONCLUSIONS
Researchers could conclude that there is no
significant difference of distance traveled, calories
used, and average speed onmen‘s basketball player in
all various positions. In order to gain maximum
performance during a competition, coach should give
patterned exercises that are in line with players in all
positions.
ACKNOWLEDGEMENTS
This study was funded by Indonesia Endowment
Fund for Education Scholarship or LPDP Indonesia.
We would like to thank Mustika Fitri, Ph.D and Al
Jupri, Ph.D for his valuable and constructive
comments and suggestions.
REFERENCES
Arisandi D. 2015. Analisa Penggunaan Kalori Atlet Bola
basket ( Studi Perbandingan Terhadap Posisi-Posisi
Pemain Bola Basket Putri Pekan Olahraga Daerah
Jawa Barat 2014 ). [Bandung]: Universitas Pendidikan
Indonesia.
Aughey R J. 2014. Applications of GPS Technologies to
Field Sports Applications of GPS Technologies to Field
Sports (May 2014).
Castellano J, Casamichana D. 2010. Heart rate and motion
analysis by GPS in beach soccer. J Sport Sci Med.
2010;9(1):98–103.
Erčulj F, Vučković G, Perš J, Perše M, Kristan M. 2008.
Establishing basketball players’ velocity and distance
covered during a basketball match with the sagit
computer tracking system. J Coimbra Netw Exerc Sci.
2008;4:50–9.
Garrett W, Kirkendall D, editors. Philadelphia; 2000. 733-
744 p.
Hoffman J, Maresh C. 2017. Physiology of Basketball.
Junior A C, Misuta M S, Mercadante L A. 2017.
Quantitative Analysis of Distances Covered by
Professional Basketball Players According to the
Movement Intensities. 2017;7(3):128–36.
Larsson P. 2003. Global Positioning System and Sport-
Specific Testing. 2003;33(15):1093–101.
Leser R, Baca A, Ogris G, Science A C, Gmbh S. 2011.
Local Positioning Systems in (Game) Sports.
2011;9778–97.
Narazaki K, Berg K, Stergiou N, Chen B. 2009.
Physiological demands of competitive basketball.
Scand J Med Sci Sport. 2009;19(3):425–32.
National Basketball Association. 2003. Players and
Positions [Internet]. 2003 [cited 2017 May 5].
Available from:
http://www.nba.com/canada/Basketball_U_Players_an
d_Posi-Canada_Generic_Article-18037.html
Oba W, Okuda T. 2009. A Cross-sectional Comparative
Study of Movement Distances and Speed of the Players
and a Ball in Basketball Game. 2009;203–12.
Šibila M, Vuleta D, Pori P. 2004. Position-Related
Differences in Volume and Intensity of Large-Scale
Cyclic Movements of Male Players in Handball.
Kinesiology, 2004;36(1):58–68.
Vučković G, Dežman B, James N, Erčulj F. 2010. Analysis
of the Movement Intensity of National Level Basketball
Guards and Centres in Defence and Offence – a Case
Study. Kinesiol Slov. 2010;16:66–76.. Garrett W,
Kirkendall D, editors. Philadelphia; 2000. 733-744 p.
The Comparison of Player Movement in Global Positioning System (GPS) Based Basketball Game
21
