
Agility Test Development Based Infrared Sensor
Ryan Budi Prakoso, Luqman Hardiansyah, M. Latif and Agus Rusdiana
Universitas Pendidikan Indonesia, Jl. Dr. Setiabudhi No. 229, Bandung 40154, Indonesia
luqman.hardiansyah@student.upi.edu
Keywords: Agility Test, Research and Development (R&D), Infrared Sensors.
Abstract: The purpose of this study was to develop agility measuring instruments such as shuttle run, 505 agility, zig-
zag, t test and Illinois based laser sensor. This tool is capable of being adjusted in several agility tests that
results in units of time. Working system is supported by laser sensors to detect motion and microcontroller as
an interpretation of sensor detection results whose output is raised through seven segments. The counter will
begin to calculate the time when the test performer passes the sensor, not by instruction. Research and
development method used in this research, because this research develops and produces a prototype product.
Validity was tested by comparing the agility test results using the sensor using the stopwatch test, while the
reliability was tested by comparing the retest results with the sensor agility. Validity test shows the value of
pearson correlation of 0.784 means there is a high correlation between the test using sensors and without
sensors. Reliability test shows sig value. (2-tailed) of 0.781 means there is no difference between the initial
test and the final test, meaning the tool can steady. The results showed the average value of the test using the
sensor faster, because it is more accurate than using a stopwatch which results depend on the testers.
1 INTRODUCTION
Agility is the ability of the body to move quickly and
change direction with a short time (Sheppard and
Young 2006). Many field sports require agility in
games such as football, rugby, basketball. When the
attacker will pass the opponent's defense, agility as a
support capability to perform high-level skills in
fooling the opponent will be very decisive (Sheppard
and Young 2006; Young and Willey 2010). Agility
can be measured in conventional test such as Shuttle
run, 505 Agility, Zig-zag, T test and Illinois
(Mackenzie 2008). Currently, there are many studies
of agility in the sport of rugby, basketball, soccer,
netball, but agility measurement using conventional
tests is rarely to be developed.
Agility tests with conventional methods are
commonly performed using stopwatch and cones.
The test is considered to be less accurate because the
timing calculation depends on the accuracy of the
testers, if repeatedly very possible human error occurs
(Y Hachana, H chaabe ` ne, M A. Nabli, A Attia, J
Moualhi, N Farhat 2013).
Usually a test using a stopwatch requires one
person to use the stopwatch. Problems in agility tests
make the development of sensor-based agility gauges
important to improve instrument quality with the aim
of improving the accuracy of time-taking. Previous
research on the development of agility measurements
that is performed research that agility is devoted to
certain sports, such as agility tests on: rugby, soccer,
basketball and netball (Farrow, Young, and Bruce
2005; Serpell, Ford, and Young 2010; Aaron Scanlan
, Brendan Humphries 2013; James et al. 2010). This
is because every sport has its own agility
characteristic. For the development of sensor-based
agility measures are still limited such as the
development of agile side step test (Kurniawan et al.
2013), but the tool can only test one type of pattern
only the side step test. The development of the tools
to be developed is to create a series of digital test kits
with sensors that can be adjusted in several agility test
patterns, such as Shuttle run, 505 Agility, Zig-zag, T
test and Illinois. Development will make it easier to
test and can be done without any additional people in
testing. Another convenience is to minimize the test
time, even if only a few seconds from each
implementation. Time efficiency can result in faster
test results than using a stopwatch and tends to be
fixed, independent of the tool holder as it holds the
stopwatch.
Prakoso, R., Hardiansyah, L., Latif, M. and Rusdiana, A.
Agility Test Development Based Infrared Sensor.
In Proceedings of the 2nd International Conference on Sports Science, Health and Physical Education (ICSSHPE 2017) - Volume 1, pages 519-523
ISBN: 978-989-758-317-9
Copyright © 2018 by SCITEPRESS – Science and Technology Publications, Lda. All rights reserved
519
If the test is executed with a large sample scale,
then the calculation of the time just a few seconds can
be a minute or even an hour. Instrument development
uses sensors that detect structured motion in the form
of agility tests. There are four sensors that can be
adapted for agility test needs. The timing starts when
the foot passes through the sensor beam and ends
when it passes through the sensor beam. These
potentials and limitations, researchers interested in
developing laser agility-based measuring tools.
2 METHOD
This research develops and validates a new product
that is a sensor-based agility test. The steps are called
the Research and Development (R&D) cycle (R&D).
The products are tested and revised to produce
products that meet their manufacturing goals with
validity and reliability tests (Pauole K, Madole K,
Garhammer J, Lacourse M 2000; Fraenkel, Jack R.,
Norman. Wallen 2012; Walter R. Borg 1989).
2.1 Participants
The sample involved in the validity and reliability test
is 50 students of program study Ilmu Keolahragaan
Fakultas Pendidikan Olahraga dan Kesehatan,
Universitas Pendidikan Indonesia with age range 19-
22 years. The reason for choosing the sample is
because they have been accustomed to the test, so
there is no need to make long explanations to carry
out the test.
2.2 Tool’s
The developed product consists of 8 Gorilla Pods for
sensor insertion, 4 signaling sensors (laser light), 4
signal receptors, 1 meter cable that can be connected
and otherwise have 4 meters and 10 meters, and box
counter (screen information time, lap, setting button,
reset button, marker light, and buzzer). The sensor has
a magnet behind it to be affixed to the metal and rests
on the Gorilla Pod. The use of Gorilla Pods makes
lasers and receptors available almost anywhere. The
cable is made by inserting it in a 5 mm silicon hose
designed to be connected in 1 meter, 4 meters, and 10
meters. The cable is connected to the connector to be
connected with other cables, so the length can be
adjusted as needed. The placement of the sensor
should be in the order adjusted to the order of running
on the agility test. sensor number 1 and number 4 are
in the star and finish line.
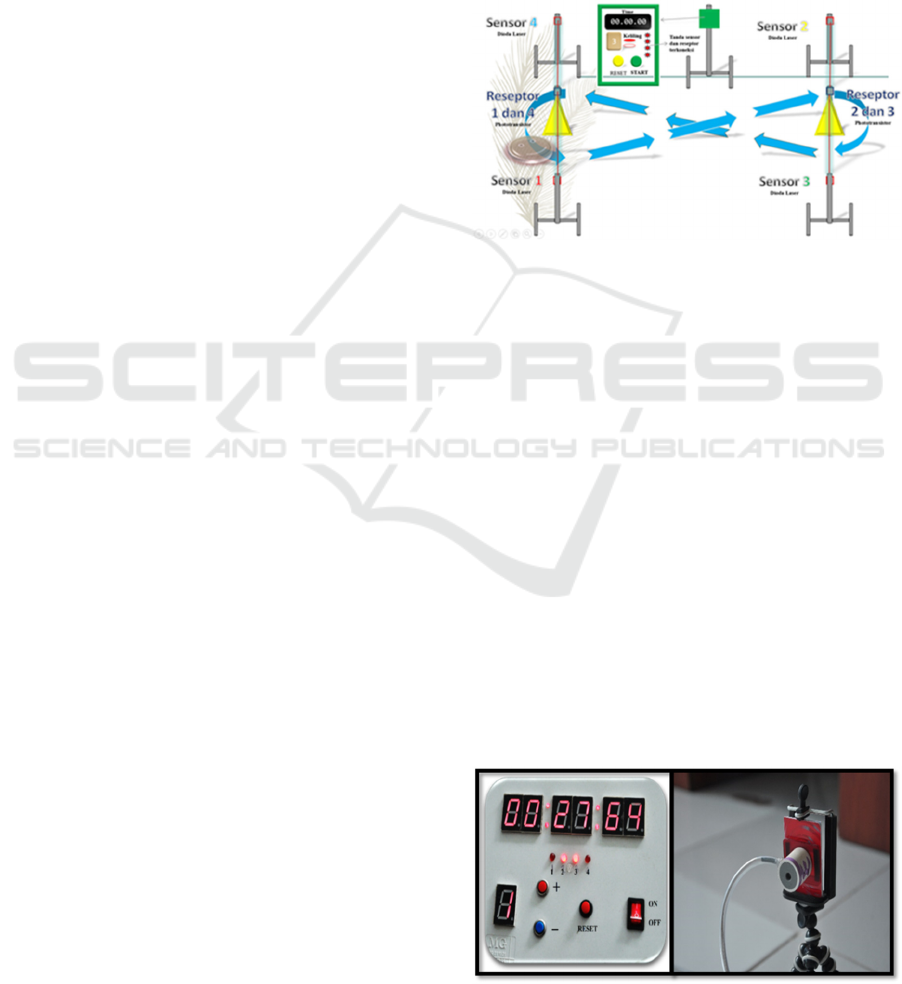
2.3 Product Design
This product is conceptualized to be used with a
variety of agility tests. The laser sensor must have its
own backrest and can be placed anywhere to adjust
the various forms of agility tests. Cables must be
converted into an adjustable cable length to adjust to
track the extent of various forms of agility test, as in
the figure. 1 use of sensor-based agility meter on the
shuttle run test pattern.
Figure 1: Shuttle run test pattern.
2.4 Operating System
System work tool with the description as follows : 1.)
Prepare what agility test will do, 2.) Use cones to
mark the track of the agility test track, 3.) Attach the
laser and receptor to the Gorilla Pod and place it in
the required position, sensor 1 for start and sensor 4
to finish, 4.) Position the box counter outside the track
at the desired place, 5.) Set the distance of the cable
and adjust the length required, try to keep the cable
does not hinder the running of the test, 6.) Connect
the box counter with the power source and turn it on,
7.) Set the laser beam to precisely lead to the receptor.
Look at the box counter of the connected sensor sign
lights, 8.) Add rounds as needed tests, 9.) The test is
ready to run, 10.) Each test that has been done will
appear the time, then simply press the reset button,
then the next test participants can directly perform the
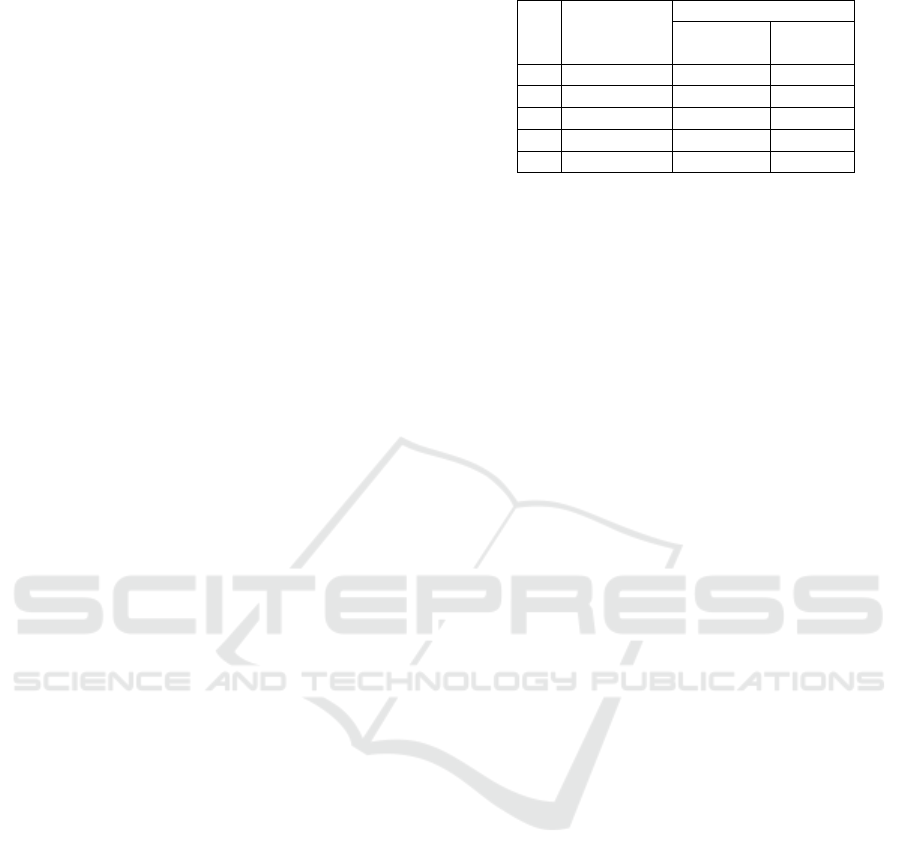
test agility. The box and sensor view attached to
Gorilla Pod is illustrated in figure 2.
Figure 2: Sensor, box, and cable.
ICSSHPE 2017 - 2nd International Conference on Sports Science, Health and Physical Education
520
2.5 Validity and Reliability
Validation is an activity process to assess whether the
product design, in this case the rational system of
work will be more effective than the old or not.
Validation of products will be done by comparing test
results using sensors with tests using stopwatch.
Testing the product by comparing the effectiveness
and efficiency of the product from the old work
system with the new one (Fraenkel, Jack R., Norman.
Wallen 2012; Walter R. Borg 1989). The indicators
of the work system assessment of this comparison are
the accuracy of the time of assessment and the
effectiveness of which test times are better. The
product is considered successful when the tool
development has more accurate timing accuracy and
more efficient testing time. To test the reliability of
the measuring instrument agility with sensors that
have been developed to do test-retest. Test-retest by
way of trying the instrument several times on the
respondent then correlated (Fraenkel, Jack R.,
Norman. Wallen 2012; Walter R. Borg 1989).
3 RESULTS AND DISCUSSION
Many processes have been done until the tool can be
tested. The first stage of the electronic circuit is
arranged on a printed circuit board (PCB). Which is
connected to a sensor attached to a portable poles.
Electronic circuit with 12 volt voltage using
accumulator. The test results on the shuttle run pattern
still has disadvantage, so further improvement needs
to be done. Inefficient initial testing because using the
start button to initiate the test, this is the same as the
uncensored test mechanism. Another disadvantage is
the use of portable poles that are too difficult for the
sensor to be arranged so that the radiated rays are
received right at the receptor. Repair done is to
remove the start button, so the test can be started no
need to wait for the signal from the tester.
Additionally the change replaces the portable pole
with an easier gorilla pod in the laser beam setting
against the receptor. After experiencing system
repairs many times, the tool was deemed to have
populated to test the validity and reliability with the
following results;
Table 1: Agility test result.
No Test Name
Avera
g
e
Stopwatch
(s)
Sensor’s
(s)
1 Shuttle Run 15.15 15.51
2 505 A
g
ilit
y
5.19 4.33
3Zi
g
-za
g
5.75 5.54
4 T-Test 11.14 10.85
5 Illinois 19.87 19.77
Looking at the averages in the table. 1 each agility
test compared to the test delivery using the stopwatch
with the sensor, it is known that the average test using
the sensor produces a faster time record. This shows
that the test using the sensor is more accurate than the
test using a stopwatch.
3.1 Statistical Validity Result
Test validity by comparing agility test results with
sensors and without sensors. Figure 3 show average
test 1 sensor more quickly than test 1 stopwatch.
Statistical analysis was performed using with
bivariate correlations with significance 0.05 and
Kolmogorov Simonov to test data normality. The
results of statistical calculations show the data of
normal distribution and the value of pearson
correlation 0.784 means there is a high relationship
between the test using sensors and without sensors.
Then it can be concluded the developed tool can
measure what to be measured (Serpell, Ford, and
Young 2010; James et al. 2010; Y Hachana, H chaabe
` ne, M A. Nabli, A Attia, J Moualhi, N Farhat 2013;
Pauole K, Madole K, Garhammer J, Lacourse M
2000).
3.2 Statistical Reliability Result
Test reliability by comparing agility results by using
sensors with test re-test. Figure 3 shows the average
test of 1 sensor between test 2 sensors only differing
0.1. Statistical analysis was performed using paired
sample t-test with significance 0.05 and Kolmogorov
Simonov to test data normality. The result of
statistical calculation shows normal distribution data
and sig value. (2-2tailed) of 0.781 means there is no
difference between the initial test and the final test,
means to indicate the level to the tool ajegan that can
perform its function well repeatedly (Serpell, Ford,
and Young 2010; James et al. 2010; Y Hachana, H
chaabe ` ne, M A. Nabli, A Attia, J Moualhi, N Farhat
2013; Pauole K, Madole K, Garhammer J, Lacourse
M 2000).
Agility Test Development Based Infrared Sensor
521

Figure 3: Average time record.
3.3 Discussion
The purpose of this research is to produce agility test
based sensor with high accuracy. The results of this
research tool mechanism can work in accordance with
what will be measured. However, looking at the
average shown on the test run test results of sensor-
based devices can not outperform conventional tests
using stopwatch. It shows the test using the sensor has
an average value of 15.51 seconds while the test using
the sensor 15.15 seconds. Referring to Velocity =
Spatium / time velocity formula, then sensor-based
tools should be able to record faster time because
speed is inversely proportional to time (Hidayat
2003). Deficiency occurs because when the test run
with the shuttle run pattern is the first test that has
problems on the use of the start button and portable
pole. The repair process by removing the start button
so that the test can be done without a signal from the
tester and replace the portable pole with a gorilla pod.
After improving the results of time records obtained
sensor-based tests are able to record time faster than
the stopwatch-based.
Although this sensor-based measuring instrument
is highly populated which is seen from the results of
validity and reliability. This tool still has technical
flaws that can disrupt the course of the test. Using
cables makes test preparation takes a lot of time to
adjust to the agility test pattern. In addition, problems
in the sensor system are affected in the hot sun. The
solution is in further research to replace the cable
system into wireless and replace the infrared sensor
with motion sensor with higher sensitivity level.
4 CONCLUSIONS
From the whole range of tests, this test resulted in that
time records with the use of sensors, tend to be more
accurate than those using the stopwatch. The use of
sensors certainly brings precise timing accuracy on
the starting line and finish line. Accuracy calculations
also tend to be stable or consistent. In contrast to
using a stopwatch that relies on accuracy in using the
stopwatch.
Validity test shows that this tool is valid with the
result of comparison of conventional performance
with developed. Reliability test also shows that this
tool has a reliability of the results of the correlation of
test 1 and test 2 that shows no difference. Test
reliability can also be interpreted that the test results
using this sensor will produce stable test results.
The development of this gauge can be used in any
light conditions, unless the light is as hot as the sun.
Sunlight may interfere with the performance of the
receptor, in addition to the use of cables making the
measurement preparation time-consuming.
Therefore, this prototype can then be improved on the
sensor system and wired with using a more efficient
and effective wireless system.
REFERENCES
Aaron Scanlan , Brendan Humphries, Patrick S. Tucker,
Vincent Dalbo. 2013. “The Influence of Physical and
Cognitive Factirs One Reactive Agility Performance in
Men Basketball Players.” Journal of Sports Sciences.
Farrow, D., W. Young, L. Bruce. 2005. “The Development
of a Test of Reactive Agillity for Netball: A New
Methodology.” Journal of Science and Medicine in
Sport, 40–48.
Fraenkel, Jack R., Norman. Wallen, Helen. Hyun. 2012.
“How to Design and Evaluate Research in Education,
8th Edition.” ( www.mhhe.com).
Hidayat, I. 2003. Biomekanika Pendekatan Sistem
Pembelajaran Gerak. Bandung: PPS Universitas
Pendidikan Indonesia.
James, P, J Alan, S John, James P Veale, Alan J Pearce,
John S Carlson. 2010. “Agility Test for Australian
Football” 5 (2): 239–48.
Kurniawan, Faidillah, S Pd Kor, M Or Nidn, M Kes Nidn,
and Universitas Negeri Yogyakarta. 2013.
Pengembangan Alat Side Step Test Modification
Berbasis Digital Tech.
Mackenzie, B. 2008. 101 Tests D’Évaluations.
Pauole K, Madole K, Garhammer J, Lacourse M, Rozenek
R. 2000. “Reliability and Validity of the T-Test as a
Measure of Agility, Leg Power, and Leg Speed in
College-Aged Men and Women.” Journal of Strength
and Conditioning Research 14 (4): 443–50.
Serpell, Benjamin G, Matthew Ford, Warren B. Young.
2010. “The Development of a New Test of Agility for
Rugby League.” Journal of Strength and Conditioning
Research 24 (12): 3270–77.
Sheppard, J. M., W. B. Young. 2006. “Agility Literature
Review: Classifications, Training and Testing.”
ICSSHPE 2017 - 2nd International Conference on Sports Science, Health and Physical Education
522

Journal of Sports Sciences 24 (9): 919–32.
Walter R. Borg, Meredith D. Gall. 1989. Educational
Research, An Introduction.
Y Hachana, H chaabe ` ne, M A. Nabli, A Attia, J Moualhi,
N Farhat, M Elloumi. 2013. “Test-Retest
Reliability,Criterion-Related Validity, and Minimal
Detectable Change Of The Illinois Agility Test In Male
Team Sport Athletes.” Journal of Strength and
Conditioning Research 27: 2752–59.
Young, Warren B., Ben Willey. 2010. “Analysis of a
Reactive Agility Field Test.” Journal of Science and
Medicine in Sport 13 (3). Sports Medicine Australia:
376–78.
Agility Test Development Based Infrared Sensor
523
