
Senior High School Bahasa Indonesia National Examinantion Score
Inappropriateness
A Case Study in West Java
Imas Mulyati and Mohammad Ali
Universitas Pendidikan Indonesia, Bandung, Indonesia
imasmulyati@gmail.com
Keywords: Score Inappropriateness Index, Jacob Method, Item Bias.
Abstract: Score inappropriateness denotes to examinees’ performance in giving wrong answers to the easy items
while the right answers are given to the difficult ones. This phenomenon indicates to the presence of item
bias. This study addresses the extent to which the West Java senior high school national examination results
demonstrate score inappropriateness. The study employs a descriptive method conducted to the West Java
2011-2012 UN participants in the subject of Bahasa Indonesia. The data was collected from the Center for
Educational Evaluation and was analyzed in two phases, i.e., analysis of item difficulty index and
calculation of score inappropriateness index by using Jacob method. Results of the study indicate; 1) 64% of
the item difficulty index is categorized as easy. 2) The index of score inappropriateness is 0.6%. This
indicates the index is low meaning that there is no significant indication of item bias in the national
examination items.
1 INTRODUCTION
Assessment is one of the functions of national
education management. One of the periodic
assessment activities is the National Examination
(UN) which among its functions is to map the
quality of national education and become the basis
for diagnosing the various factors that cause learners
not to achieve the desired level of learning outcomes
(Syamsi, 2012).
There are several factors that affect the high
quality of UN. These factors are related to students’
internal condition, including readiness to face the
UN and the ability to answer each item. In addition,
there are also other external factors in the form of
scoring. The results of the UN in the form of a score
gives an idea whether or not the UN has functioned
as a precise measuring tool (Ghoeskoka, 2010).
In addition, the characteristics question items;
the level of difficult and discrepancy power, also
affect the quality of UN questions. If these two
characteristics are good, then the UN will clearly
illustrate the quality of education nationally (Azwar
2011). As for the difficulty level of the item, it can
directly provide information about the fairness and
inequality of the score (Zickar and Drasgow, 1996).
In this context, the problem is that the scales do not
accurately describe the ability of the test
participants. High achievers can earn a low score; on
the contrary, the low achievers can earn a high score
(Rahma, 2013).
The existence of various efforts to achieve a high
value graduation is assumed to have an impact on
the frequency distribution of UN participant
responses. As a result, difficult questions can be
answered by many test participants, while the easy
questions are only answered by the test participants
in relatively small numbers (Budescu and Bar-Hillel,
2011). This can trigger the occurrence of inequality
score, including the score of participants of the
Indonesian UN High School subjects test 2011 and
2012 in West Java Province. On this basis, the
problems that are examined through this research
are:
1. To what extent is the inequality of high
school students in West Java Province in the
Indonesian language UN 2011-2012
academic year?
2. What is the percentage of high school
students in West Java Province who have
insufficient scores on the Indonesian
language UN 2011-2012 academic year?
194
Mulyati, I. and Ali, M.
Senior High School Bahasa Indonesia National Examinantion Score Inappropriateness - A Case Study in West Java.
In Proceedings of the 1st International Conference on Educational Sciences (ICES 2017) - Volume 2, pages 194-199
ISBN: 978-989-758-314-8
Copyright © 2018 by SCITEPRESS – Science and Technology Publications, Lda. All rights reserved

The purpose of this study is to track the
inequality of the UN High School participants in the
Indonesian language test in 2011 and 2012 in West
Java Province.
2 LITERATURE REVIEW
Educational assessment is a formal effort undertaken
to determine the state or data about the students by
considering the variables of education. According to
Popham (2011): Educational assessment is a formal
attempt to determine student’s status with respect to
educational variables of interest (page 7). It is in line
with Mardapi and Kartowagiran (2012):
Assessment includes all the means used to
collect data about individuals. Assessment focuses
on the individual, so that his decision is also directed
to the individual. To assess the learners’
achievement, students do the tasks, take the midterm
exam, and the final exam of the semester. This
evidence is not always obtained by the test alone,
but can also be collected through self-observation or
report.
Thus, assessment is an activity done in an effort
to collect data about an object with attention to the
important components in it. While the assessment of
education is an activity undertaken in an effort to
determine the state of students as learners, either
through tests or non-tests.
Assessment can be done through measurement.
Measurement is a way to determine symbols in the
form of numbers to describe the quantity of an
attribute by following certain rules Thus, assessment
is an effort in assessing the achievement of
educational objectives that quantitatively the data
are obtained through measurement results.
Measurement is basically the activity of
determining the numbers to describe the
characteristics of an object systematically. Through
measurement, a person's ability in a particular field
is expressed by numbers. According to Ali (2011)
and Ali and Furqon (2016), there are three important
elements in the measurement process: 1) the
measured object, 2) the valid, reliable, and
appropriate tools for measuring, and 3) the unit of
measure used. In education, measurement can be
defined as the activity of determining the numbers to
describe the characteristics representing the ability
of learners who also describes the achievement of
learning outcomes.
The National Examination is one of the
measurements in Education conducted nationally.
According to Mardapi and Kartowagiran (2009), UN
is one form of formative assessment in which the
purpose is to identify the achievement of national
education standard. The curriculum used is a
reference in compiling the UN questions and the
results can be used as input to improving the
learning process in educational unit or school. The
expectation over the UN is to encourage educators to
always refine the learning strategies used in the
classroom.
Article 1 Permendikbud Number 66 Year 2013
on Education Assessment Standards described the
definition of the UN as follows.
The National Examination, hereinafter referred
to as UN, is the activity of measuring and evaluating
the achievement of national graduate competency
standard on certain subjects. Table of Specification
of UN questions re the reference in developing and
constructing test questions compiled based on the
Competency Standards and Basic Competencies in
the Standard Content of Primary and Secondary
Education Units (Ministry of Education and Culture,
2013).
On this basis, it can be concluded that the UN is
an activity of measuring national standards of
education on certain subjects that refer to the
Competency Standards and Basic Competencies
applicable to each educational unit.
The attainment of that goal will be known by
carrying out an assessment. The results of this UN
can contribute towards improving the process and
learning outcomes nationally. Therefore, UN should
be better prepared in terms of educational
measurements, such as measuring objectives,
assessment guidelines as measured scales, and
measurement tools, namely the validity and
reliability of the question itself.
As a measuring instrument, the question in UN
should be drawn up by taking into account certain
criteria. According to Ali (2011), there are four
criteria of measurement instruments: objective,
feasible, reliable, and valid. The objectivity of a
measurement instrument shows that the data
collected using the instrument can describe the
actual state, or free from the judgement and
subjective interpretation. The feasibility of an
instrument indicates that the instrument can be used
to collect the appropriate data. Instrument reliability
is the basis for assessing the feasibility of the
instrument. The level of the reliability can be
identified based on an empirical test. The test is
carried out in a trial test, and the data obtained from
the results of these trials are used to conduct
reliability test. Validity indicates the conformity
between the questions or test items and the purpose
Senior High School Bahasa Indonesia National Examinantion Score Inappropriateness - A Case Study in West Java
195

of measurement. Validity can be seen from its
compatibility with prediction, alignment, constraint,
and content.
Measurement errors can occur due to the
differences in monitoring systems that result in the
acquisition of learners' scores as a measurement
target. Some monitoring system is strictly done and
some is not. Consequently, on the measurement
results there are inequality of the score obtained by
the learner as a measuring goal. High achievers get
low score while the low achievers get high score.
There are some terms used to refer to score
inappropriateness. Naga (2013) used score
inequality in addition to score morbidity.
Inappropriateness and appropriateness were
familiarized by Drasgow (1982) for the same
purpose. Cheating and answer copying were also
introduced by Bay (1995) and Linden and
Sotaridona (2004). Answer copying was also
adopted by Khalid (2011) to describe the score
inequality.
Score inappropriateness occurs when the test
takers fail to display the exact measurements of what
the test means (Drasgow, 1982). There are several
inequality criteria used in different methods, among
the methods of determining municipal inequality is
the Jacob method (Naga, 2013) This study used the
Jacob method of dividing the items of the
measurements into five groups of difficulty levels.
This criterion was obtained from the respondent
responses. Jacob classified the criteria as follows:
The easiest items was scored 1, and the next is 2 and
so on up to the most difficult item was scored 5. In
the determination of the fairness index, Jacob gives
weight to the respective group. As presented in
table 2.8. Items 1 group was scored 0, item 2 was
scored 1 and so on up to the item 5 was score 4. The
frequency of the correct answer was labelled f1 to
f5.
The Jacob Procedures in determining score
inappropriateness is:
1) Sorting items into five different difficulty
levels. This criterion was obtained from the
respondent responses.
2) Assigning score to every difficult level group.
The easiest item was score 1 and the next is 2
and so on.
3) Determining the fairness index by weighing
every group items. Items 1 group was scored
0, item 2 was scored 1 and so on up to the
item 5 was score 4. The frequency of the
correct answer was labelled f1 to f5.
4) The fairness index was analyzed by the
following formula.
5) Comparing the calculation result with Jacob
fairness index, with J = 2, fair J ≤ 2 and not
fair J > 2.
3 METHODOLOGY
This research used descriptive exploratory method
toward the answers and the score of Senior high
school UN in Bahasa Indonesia Subject in 2011 and
2012 in West Java. The research was conducted
under the following procedures: Sampling and data
collection, data analysis and interpretation.
In the sampling and data collection steps, this
study population is defined as the answer and score
of UN participants in the Indonesian Language
examination in 2011 and 2012 in West Java
Province (secondary data). From this entire
population, it was selected sample with stratified
sampling technique, that is choosing 10 districts or
cities based on geographical location, from each
district or city, three sample schools are selected,
and from each school 50 respondents are selected so
that the total sample is 1500. From the sample, the
students’ answer and score were collected. The data
were taken from Puspendik and the ministry of
Education and Culture (Kemendikbud).
The data was then analyzed based on its
difficulty level as one of the indicators in
inappropriateness by using excel.
Pi is the first difficulty level; fi is the
respondents’ proportion of their correct answers; N
is the total respondents. The difficulty level is
interpreted by using Witherington; 0.00 ≤ P ≤ 0.24 is
difficult, 0.25 ≤ P ≤ 0.74 is moderate, and 0.75 ≤ P ≤
1.00 is easy. Furthermore, the calculated inequality
index of the scales refers to a model developed by
Jacob (Jacob method) with the steps of: a) The
calculated item difficulty level is grouped into five,
from the easiest items to the most difficult one. b)
Calculate the correct answer frequency for each of
the grain difficulty clusters. c) Give value to each
group of difficult levels, i.e. the group with the most
easily graded item 1, the next level is given a value
of 2, and so on until the most difficult item is scored
5. d) Determine the index of inequality by first
giving weight to each group of items, i.e. group 1 is
given weight 0, group 2 is given weight 1, and so on,
until group 5 is given weight of 4. The exact answer
frequency is expressed by f1 to f5; and the index of
inequality is calculated using the following formula.
ICES 2017 - 1st International Conference on Educational Sciences
196
With J is the inequality index; 0-4 is the weight
for each of the item difficulty clusters; f 1 to f 5 is
the correct answer frequency for the 1st difficulty
group to the fifth difficulty group.
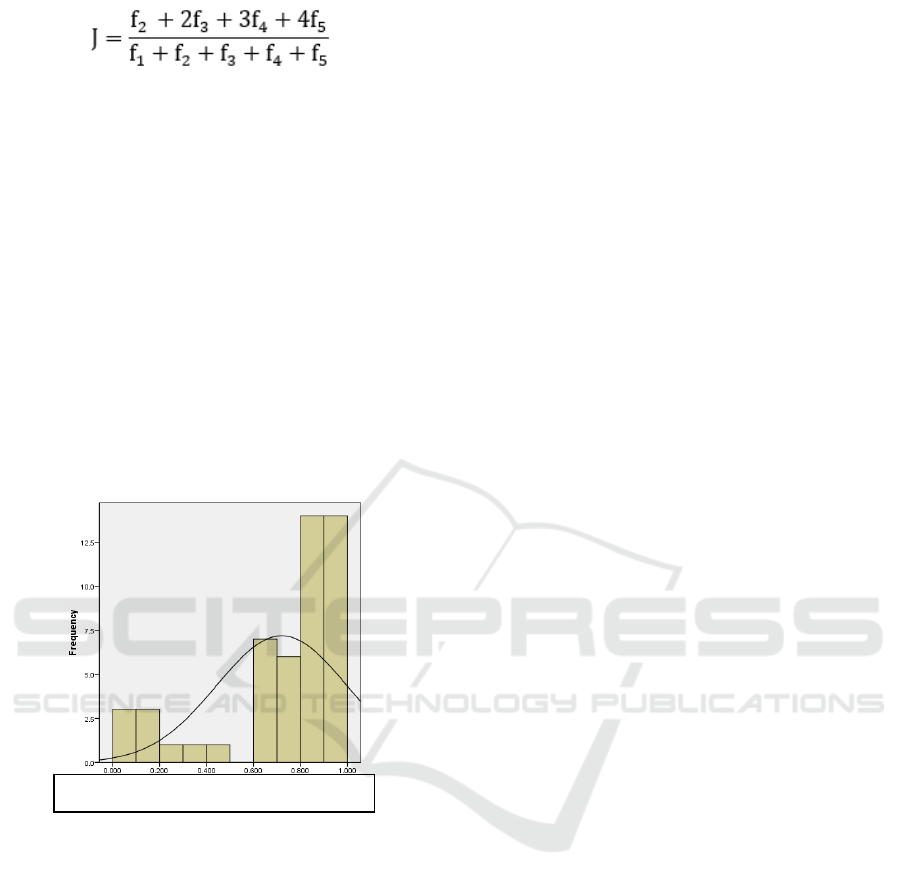
4 RESULTS AND DISCUSSION
The distribution of the item difficulty level Bahasa
Indonesia in 2011-2012 national examination is:
64% easy, 22% moderate, and 14% difficult. This
distribution is deemed in appropriate for the nation
level item questions. The distribution of the
difficulty level must be normally distributed. To
provide clearer information, the following graph
shows the distribution of difficult level items in
Bahasa Indonesia Subject UN in West Java.
Figure 1: The distribution of item difficulty level in
Bahasa Indonesia subject in SMA, West Java.
It can be seen that the difficulty level of Bahasa
Indonesia in 2011-2012 is not normally distributed.
The problems of 'easy' categories are very dominant,
with a very large number of comparisons. The data
was not in the normal distribution curve. This shows
that the difficulty level of Bahasa Indonesia
Academic Year 2011-2012 is not normally
distributed.
Harahap and Wardhani (2010) showed that the
distribution of the difficulty level is not normally
distributed. This verifies that the item questions are
too easy for the students. This also occurred in
Bahasa Indonesia question in West Java. The
difficulty was not normally distributed.
The ideal proportion is: 27% high, 27% easy and
46% moderate. This implies that the question
distribution should comply that arrangement.
The inappropriate distribution was caused by some
factors such as students as the objective, the scale
and the question s as the measurement. What
happened in Indonesia, it is predicted that the
problem of the concentrated difficulty level on easy
is the student as the measurement objective.
The students as the measurement objective play a
significant role in determining the difficulty level of
the questions. It is because the difficulty level
determination is based on the respondent’s answer.
However, if the difficulty level was done through
expert judgement, the difficulty level will be more
reliable.
The objective measurement in the national
examination is the students as the respondents. The
question difficulty level can be affected by the
respondents’ condition. The term condition may
refer to either the internal factor of the student itself
or the external environmental factor wherein the
students live.
The difficult question may be deemed easy for
high achiever students. Conversely, the easy
question may be deemed difficult for low achiever
students. Therefore, the difficulty level is not
absolute, it is highly affected by the object of the
measurements.
The concentrated difficulty level in easy category
has made the UN questions lost its quality. What
cause this question to be “damaged”? Based on the
previous studies as in Harahap and Wardhani
(2010), the damage is likely to be caused by the
objective measurement, for example cheating.
Cheating has made the data analysis deviated to be
in easy category in this study, there is the possibility
of the emergence of the number 64% on the number
of easy questions due to fraudulent target
measurement.
In this study, the individual score inequality
occurs only in 0.6% of the respondents. This is
insignificant amount compared to the overall scores.
The other scores cover all the 99.4% respondents.
Some studies on the cheating during UN have
been frequently undertaken. The score inequality has
also been confirmed by other previous studies.
Harahap and Wardhani (2010) has pointed out the
score inequality in UN Medan. This score inequality
occurred in 6.67% respondents.
Based on that finding, relevant to Naga (2013),
score inequality occurs only in individual
respondent. Respondents who usually gets high
score in equally get low score. Conversely,
Item Difficult
y
Level
Senior High School Bahasa Indonesia National Examinantion Score Inappropriateness - A Case Study in West Java
197

Respondents who usually gets low score in equally
get high score. Naga also explained that the
inappropriate test score may occur if the tester
answer inappropriately. It means that they took the
wrong answer for the easy question but took the
correct answer for the difficult question.
Based on the responses from the respondents, it
was obvious that the students comply to the
distribution of the difficulty level. It rarely occurred
that the students took the correct answer in the
difficult question. Conversely, students may not take
wrong answer in easy question. The students almost
always answer the questions relevant to their
competence.
As a result, it is obvious that 99,4% of the
students in Bahasa Indonesia subject are labelled as
high achiever students as they can answer the
questions relevant to their competence. However,
one interesting fact arise: is it possible that all the
UN participants answer the questions based on their
competence? This may indicate group academic
cheating occurrence. However, it needs further
confirmation.
Some findings, based on Jacob Method, have
been drawn:
a. In the process of analysis, Jacob method does
not include the initial data of the respondent.
The students’ competence cannot be
compared in the analysis.
b. The classification of the difficulty level
allows the questions with different
classification be placed in the same category.
There might be some overlap between easy
and difficult question.
From this point, it can be concluded that the
objectives of the assessment may not be fulfilled by
UN. UN result fails to represent the students’ actual
competence. UN is not valid and reliable in
identifying the national education goal
accomplishment.
The implications from this research are: UN can
be done as long as it complies the standard
procedure and causes no problems. The key is the
accurate measurement and environment accuracy or
appropriateness. Therefore, there is nothing wrong
with UN.
Assessment is one of important elements in
education (Ali, 2014) The education refinement can
be done through learning quality and assessment
improvement. Both are closely related, good
learning system will result in good learning quality.
Learning assessment represents learning quality.
Good assessment system will encourage educators to
decide and choose better strategies and motivation
for the teaching process. In the search for education
quality improvement, there needs to be assessment
system betterment.
5 CONCLUSIONS
1. In West Java Province there are inequalities
of the national exam of high school students.
The inequality of this score occurred at the
National Examination (UN) of Indonesian
language subjects 2011-2012 academic year.
2. UN inequality in the West Java Province is
relatively insignificant. The inequality of the
scales only occurred in a few respondents.
The percentage for the students who acquire
inequality is 0,6 % However, this gives an
indication of an imbalance at the group level.
The distribution of the difficulty level was
concentrated in “easy” category. It is odd
when the UN questions as the national
objective measurements are constructed in
‘not good’ distribution.
3. To date, UN is still problematic. But the
problems that arise from year to year are
different. In fact, the UN has experienced
various improvements that are expected to
reduce the problems it creates.
REFERENCES
Ali, M., 2011. Memahami Riset Perilaku dan Sosial,
Pustaka Cendekia Utama. Bandung.
Ali, M., 2014., Education for National Development: A
Case Study of Indonesia, Imperial Bhakti Utama.
Bandung.
Ali, M., Furqon, F., 2016. Madrasah Students'
Achievement Study in Indonesia. Global and
Stochastic Analysis 3 (No. 3), 181 – 190.
Azwar, S., 2011. Tes Prestasi. Fungsi dan Pengembangan
Pengukuran Prestasi Belajar, Pustaka Pelajar.
Yogyakarta.
Bay, L., 1995. Detection of Cheating on Multiple-Choice
Examinations. American College Testing. Tersedia:
http://files.eric.ed.gov/fulltext/ED421533.pdf [21
April 1995]
Budescu, D., Bar-Hillel, M., 2011. To Guess or Not to
Guess: A Decision-Theoretic View of Formula
Scoring Author(s). Journal of Educational
Measurement, Vol. 30, No. 4 (Winter, 1993), pp. 277-
291.
Ministry of Education and Culture, 2013. Peraturan
Menteri Pendidikan dan Kebudayaan Nomor 66
Tahun 2013 tentang Standar Penilaian Pendidikan,
Depdikbud. Jakarta.
ICES 2017 - 1st International Conference on Educational Sciences
198

Drasgrow, F., 1982. Choice of Test Model for
Appropriateness Measurement. Applied Psychological
Measurement, Vol. 6, No. 3 Summer, pp. 297-308.
Ghoeskoka, G., 2010. Problematika Ujian Nasional,
antara Masalah dan Harapan. Jurnal.
Harahap, M., Wardhani, N. Y., 2010. Pendeteksian
Ketidakwajaran (Inappropriateness) Skor Hasil Ujian
Nasional Mata Pelajaran Matematika SLTA Se-kota
Medan Tahun Pelajaran 2006/2007. Artikel Hasil
Penelitian. Disertasi, Universitas Indonesia. Jakarta.
Khalid, M. N., 2011. Statistical Methods for Answer
Copying – A Brief Overview. Journal of University of
Cambridge ESOL Examinations.
Mardapi, D., Kartowagiran, B., 2009. Dampak Ujian
Nasional. Jurnal pada Program Pascasarjana,
Universitas Negeri Jogjakarta.
Mardapi, D., Kartowagiran, B., 2012. Penyelenggaraan
Ujian Nasional Tahun 2011: UN Tidak Memveto
Kelulusan Siswa. Vol. VI/No. 1/Maret 2011 Buletin
BSNP. Jakarta: BSNP.
Naga, D. S., 2013. Teori Sekor pada Pengukuran Mental,
PT Nagarani Citrayasa. Jakarta.
Popham, W. J., 2011. Classroom Assessment: What
Teacher Need to Know, University of California. Los
Angeles.
Purwanto, Ng., 2009. Prinsip-Prinsip dan Teknik Evaluasi
Pengajaran, Remaja Rosda Karya. Bandung.
Purwanto, D., 2013. Mandiri Belajar Analisis Data
dengan SPSS, Mediakom. Yogyakarta.
Rahma, F., 2013. Kecurangan dalam Ujian Nasional di
Sekolah Menengah Atas (Cheating on Nasional Exam
in Senior High School). Skripsi. Universitas Jember:
Program Studi Sosiologi, Fakultas Ilmu Sosial dan
Ilmu Politik.
Syamsi, K., 2012. Dampak dan Harapan
Penyelenggaraan Ujian Nasional dalam Bunga
Rampai: Isu Pendidikan Aktual. Kementerian
Pendidikan dan Kebudayaan Sekretariat Jenderal Pusat
Data dan Statistik Pendidikan.
Linden, W. J. V., Sotaridona, L., 2004. A Statistical Test
for Detecting Answer Copying on Multiple-Choice
Tests. University of Twente.
Zickar, M. J., Drasgow, F., 1996. Detecting Faking on a
Personality Instrument Using Appropriateness
Measurement. Journal of University of Illinois,
Urbana-Champaign, Vol. 20, No. 1, March 1996, pp.
71-87
Senior High School Bahasa Indonesia National Examinantion Score Inappropriateness - A Case Study in West Java
199
