
Evaluating Health Insurance Inequality in Indonesia using
Concentration Curve and Index
Muryani Muryani, R. Dimas Bagas Herlambang, Nurul Aini
Faculty of Economics and Business, Universitas Airlangga, Airlangga St, Surabaya, Indonesia
muryani2008@yahoo.co.id
Keywords: Health insurance, Concentration index, Kakwani index, National health insurance.
Abstract: Equality in access to health services is one of main concerns in improving the public’s well-being. In
Indonesia, the public administration has tried to achieve this equality by establishing National Health
Insurance (NHI) in early 2014, replacing the older system of public health insurance. The data used in this
study is the Indonesian Family Life Survey, which took place 1 year after NHI implementation. This study
has assessed the inequality in public and private health insurance for public and private health using a
Concentration and Kakwani Index. Furthermore, the sample used was decomposed in to a sub-sample to get
more detailed information. This study found that there is some degree of inequality in public health
insurance, but it is more pro-poor than private health insurance. However, there is evidence from the
decomposed results that shows that there is some room for improving the inequality.
1 INTRODUCTION
In 2005, 58
th
World Health Assembly underlines the
need of Universal Health Coverage, to ensure health
financing for every people. Indonesian government
already reach out this issue a year before, by
enacting Law No. 40/2004 about National Social
Security System. This law is the very foundation to
achieve NHI (National Health Insurance) in
Indonesia. The Indonesian government choose
insurance approach rather than market one, prior to
the experiences in cross-country that successfully
implemented in United States of America and China
(World Health Organization, 2010)
In 2014, the Indonesian government’s effort
towards achieving universal coverage in health
insurance has entered a new stage in the
implementation of NHI. It is now in the first stage of
managing the participants, giving priority to
important elements of the public worker sector
including people who already have Health Insurance
and Workers Social Insurance, and the poor. The
next stage is to give access to all people in
Indonesia, which is targeted to be achieved in 2019
(Indonesian Ministry of Health, 2013).
Earlier evaluations of Indonesian health
insurance have already been conducted by Hidayat,
Thabrany (2004) and Pradhan, Saadah (2007) for the
period of crisis from 1997-1998. Another evaluation
was conducted by Vidyattama, Miranti (2014) post-
NHI implementation. These works used the same
factor to assess inequality, which is the access and
utilization for health insurance. The results from
these works show that the access for health
insurance is already pro-poor, but there is some
degree of leakage for public health insurance
utilisation.
This implementation of NHI surely helps the
poor in Indonesia. However, it still needs further
evaluation. One way to do this evaluation is using a
concentration curve and index. Kakwani (1977) used
this method to assess the progressivity of tax. Later
on, these methods were implemented in the health
economics context by Wagstaff, Paci (1991) and
Kakwani, Wagstaff (1997), which together with the
Kakwani index is handy for evaluating progressivity.
Why do the evaluation? Does it help to make a
change to inequality? These questions have been
answered by Wagstaff van Doorslaer (2003) using
the decomposition method. In their works, they
noted that the decomposing method could answer
the three problems that arise in health inequality.
First, the inequality of some of the variables might
stem from inequality in the other variables. Second,
there is evidence that inequality is changing over
time (Victoria, et al., 2000; Schalick, et al., 2000),
and one should answer to the factors driving this.
Muryani, ., Herlambang, R. and Aini, N.
Evaluating Health Insurance Inequality in Indonesia using Concentration Curve and Index.
In Proceedings of the 4th Annual Meeting of the Indonesian Health Economics Association (INAHEA 2017), pages 213-217
ISBN: 978-989-758-335-3
Copyright © 2018 by SCITEPRESS – Science and Technology Publications, Lda. All rights reserved
213

The third the most obvious problem in relation to the
evaluation is that we need more information to make
a better-designed policy.
Two decomposing factors that are relevant to
inequality are the health care type and health care
provider type. Between public and private health
care providers, Gertler (2007) noted that there is
evidence of inequality that stems from different
access to high-quality outpatient care caused by
different treatments from the public and private
health care providers. An important factor that needs
to be taken note of in relation to this problem is the
preference of the poor. It was noted by Gertler
(2007) that they prefer public-provided health care.
As for health care type, we began with a price
comparison between inpatient and outpatient care.
Adam and Evans (2006) worked out that when
comparing between the two, the results show that the
ratio between inpatient cost compared to outpatient
cost could range from 2 to 12 times higher. This
suggests that the inequality might be more severe in
inpatient care than outpatient care. But in the same
study, Adam and Evans (2006) also showed that this
factor might be related to the facilities in the
hospital. If the hospital could afford more
technology that would make for better outpatient
care, this would generate a higher outpatient cost.
From that point of view, this article will evaluate
inequality using a concentration curve, concentration
index, and Kakwani index. Using data from the fifth
wave of IFLS (Indonesian Family Life Survey), this
article evaluates the inequality approximately 1 year
after entering the first stage of NHI. Later, this
article decomposed the obtained concentration index
to get more detailed information. The decomposing
factor used has also been provided in this data set.
Different from the previous works, the factors
evaluated in this article relate to the claimed benefit
of insurance. It is used for the claimed benefit to get
a better insight in to the benefit value of insurance. It
is also extending the utilisation findings in the
previous works that still use the number of insurance
claims, and not the value of them.
2 METHODS
Different to the Lorenz curve, the concentration
curve could explain the inequality by connecting
economic inequality with other living standard
variables (O' Donnell, 2008). In this article, the
living standard variable is the claimed benefits of
health insurance. The claimed benefit will be plotted
against the cumulative population proportion in
they-axis and cumulative wealth proportion in the x-
axis sorted from poor to rich. In the Lorenz curve, it
plots the shares of the claimed benefit against
quantiles of the living standards variable.
From the obtained concentration curve, the
concentration index was calculated. The
concentration index formally could be defined as
being twice the area of the concentration curve and
line of equality. A convenient regression to calculate
concentration index was demonstrated by Kakwani,
Wagstaff (1997) obtained by the following formula:
2
ℎ
=+
+
(1)
where
is variance of the rank used,ℎ is claimed
benefit, and is the rank obtained from the wealth
ranking which could be easily obtained through the
computation of the concentration curve.
To obtain the standard error of the concentration
index, Kakwani (1997) derived the standard error for
the individual level data. Their formula resulted
from applying the delta method used by Rao (1965).
Specifically, the formula used was:
=
1
1
−(1−)
(2)
for
=
(
2
−1−
)
+2−
−
, and
=
∑
ℎ
, where is the sample size, and is
the concentration curve ordinate.
After the concentration index was obtained, we
calculated the Kakwani index. This index is useful to
see whether or not the variable is progressive or
regressive in respect to its ATP (Ability to Pay)
measurement. In this case, we will use the Lorenz
curve (O'Donnell, 2008). As used by Kakwani
(1977), the Kakwani index in this article has been
formulated as:
=
−
(3)
where shows the Gini index which representing
ATP.
To obtain a more detailed result, the samples
were decomposed using a method demonstrated by
Wagstaff, van Doorslaer (2003). The decomposing
factor used in this article is the type of health care
(outpatient or inpatient) and the type of healthcare
centre provider (public or private healthcare centre).
Technically, the formula used for decomposing is to
INAHEA 2017 - 4th Annual Meeting of the Indonesian Health Economics Association
214

treat the concentration index for claimed benefit as
having a linear relationship to the concentration
index of the regressor. Specifically:
ℎ=+
+
(4)
where ℎ is the claimed benefit, and represents the
number of regressors used. From this linear relation,
the concentration index can be written as:
=(
̅
/
)
+
/
(5)
where residual component captured by .
The data used in this article is the fifth wave of
IFLS. This survey was conducted in 16,204
households in Indonesia, representing 83% of the
Indonesian population (Strauss, 2016). This dataset
is useful when explaining the claimed benefit of
health insurance, complemented with other
information about health insurance, which is not
provided by other datasets for Indonesia.
3 RESULTS
Figure 1 and Table 1 (see Appendix) show the
results for the total and sub-sample of the claimed
benefit. The results of the total sample show that
there is a moderate value of inequality. However, the
results from the sub-sample show the inequality
difference between public and private insurance. It
shows that the inequality between public insurance
is lower than that of the private insurance. These
results are also consistent with the Kakwani index,
which shows that public insurance is more
regressive than private insurance.
Results from the decomposition show that the
type of healthcare is more elastic in public
insurance. In public insurance, the type of health
care contributes a positive concentration to the total
value. This means that outpatient care creates more
inequality than inpatient care. This result also
happens in private insurance, but with a higher
contribution to inequality.
The results also show that the type of healthcare
provider is more elastic in private insurance than in
public insurance. In public insurance, the type of
healthcare provider contributes a negative
concentration to the total value. This means that
publicly-provided health care creates more equality
than privately provided care. The magnitude of this
“pro-poor” result is very low. Different results
happen in private insurance, which shows that public
health care centres treat private insurance in a “pro-
rich” way.
4 DISCUSSION
Public insurance shows lower inequality than private
insurance. This result immediately suggests that
public insurance is not implemented as intended, but
if we compare it to the results in private insurance,
then it is more pro-poor. The Kakwani index for
either of the sub-samples also supports this finding.
Public insurance is more regressive than private
insurance, which means that it is more pro-poor in
the perspective of ATP.
Evaluating Health Insurance Inequality in Indonesia using Concentration Curve and Index
215
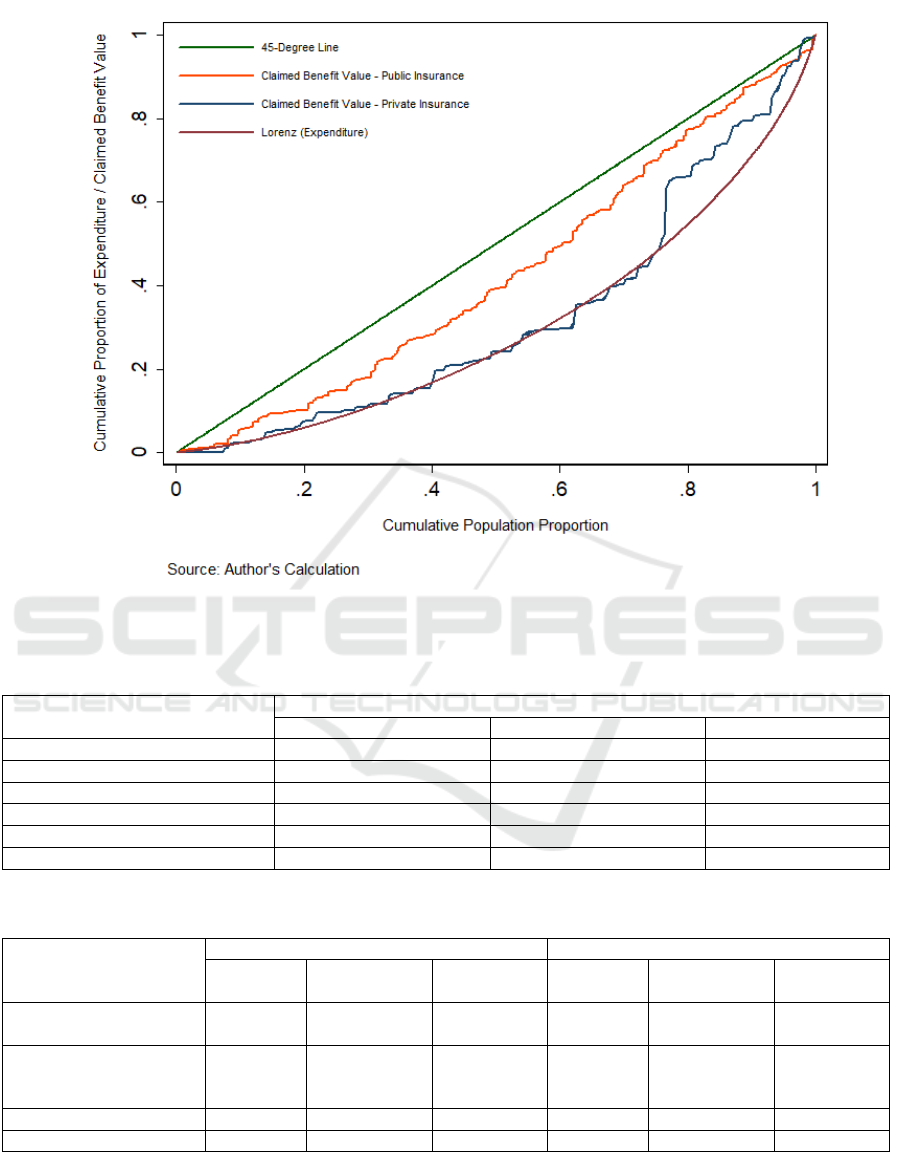
Figure 1: Concentration Curve of Claimed Insurance Benefit and Lorenz Curve in Indonesia
Table 1: Concentration and Kakwani Index
Insurance Provide
r
Total Public Private
Gini Index 0.3893 0.3799 0.3817
(
0.0078
)
(
.0094
)
(
0.0142
)
Concentration Index 0.2314 0.1439 0.3449
(0.0398) (0.0437) (0.0523)
Kakwani Index -0.1579 -0.2360 -0.0368
N 1203 954 249
Table 2: Decomposition of The Concentration Index
Public Insurance Private Insurance
Elasticities
Concentration
Index
Contribution Elasticities
Concentration
Index
Contribution
Type of Health Care
(Outpatient = 1)
-1.9199 -0.0161 0.0309 -1.4340 -0.0590 0.0846
Type of Health Care
Center (Public Health
Care Center = 1
)
0.0900 -0.0649 -0.0058 -0.1217 -0.1696 0.0206
Residual - - 0.1188 - - 0.2397
Total - - 0.1439 - - 0.3449
Findings from the decomposition method show
that outpatient care is one of the sources of
inequality that happens in public insurance
implementation in Indonesia. This inequality could
be caused by the growing service of healthcare as
noted by Adam and Evans (2006), which expands
INAHEA 2017 - 4th Annual Meeting of the Indonesian Health Economics Association
216

the choice to use inpatient service in-house.
Experience from Vietnam in 1998 also shows that
outpatient care subsidies tend to be more inequal
than the inpatient one (O'Donnell, 2008). Diseases
that are included in this category also usually happen
to charge at very high price, which normally can
only be accessed by the rich.
Results from the decomposition also show that
public healthcare centres could reduce inequality in
their insurance benefits. The low magnitude suggests
that public healthcare centres are still not significant
in relation to reducing inequality. This needs to be
evaluated since the poor prefer to use public
healthcare centres, rather than private healthcare
centres (Barber, 2007). Still, results from the private
insurance sample show that public healthcare centres
are more pro-poor while treating public insurance
holders more than the private ones.
5 CONCLUSIONS
The overall results show that 1 year after NHI
implementation, the public insurance shows a lower
degree of inequality compared to the private one.
This has made public insurance a pro-poor
instrument for health equality, but contribution of
outpatient care as a possible source of inequality in
public insurance should be regulated by the
government.
The decomposition result from the healthcare
provider shows that public healthcare centres are
more pro-poor when treating via public insurance.
This result supports the preference of the poor that
they would rather choose public healthcare centres
over a private one. Since the magnitude of “pro-
poor” is still low, there is still some room for public
healthcare centres to improve the service to public
insurance holders.
Although there is still some room for
improvement, if these results already show that
public insurance are implemented as intended, and
showing a good promise. These results need to be
monitored after full universal coverage takes place
to prepare for any changes in future condition.
REFERENCES
Adam, T., Evans, DB., 2006. Determinants of variation in
the cost of inpatient stays versus outpatient visits in
hospitals: A multi-country analysis. Social Science &
Medicine. 63(7):1700-10.
Barber, SL, Gertler, PJ., Harimurti, P., 2007. Differences
In Access To High-Quality Outpatient Care In
Indonesia. Health Affairs. 26(3):w352-w66.
Hidayat, B., Thabrany, H., Dong, H., Sauerborn, R., 2004.
The effects of mandatory health insurance on equity in
access to outpatient care in Indonesia. Health Policy
and Planning. 19(5):322-35.
Indonesia Ministry of Health 2013. Socialization of
National Health Insurance (NHI) in Social Insurance
National System Handbook. Jakarta: Indonesia
Ministry of Health.
Kakwani, N., Wagstaff, A., van Doorslaer, E., 1997.
Socioeconomic inequalities in health: Measurement,
computation, and statistical inference. Journal of
Econometrics. 77(1):87-103.
Kakwani, NC., 1977. Measurement of Tax Progressivity:
An International Comparison. The Economic Journal.
87(345):71-80.
O'Donnell, O., Van Doorslaer, E., Wagstaff, A., Lindelow,
M., 2008. Analyzing health equity using household
survey data: a guide to techniques and their
implementation. World Bank. Washington DC.
Pradhan, M., Saadah, F., Sparrow, R., 2007. Did the health
card program ensure access to medical care for the
poor during Indonesia's economic crisis? The World
Bank Economic Review. 21(1):125-50.
Rao, CR., 1965. Linear Statistical Inference and its
Applications. Wiley. New York.
Schalick, LM., Hadden, WC., Pamuk, E., Navarro, V.,
Pappas, G., 2000. The widening gap in death rates
among income groups in the United States from 1967
to 1986. International journal of health services :
planning, administration, evaluation. 30(1):13-26.
Strauss, J., Witoelar, F., Sikoki, B., 2016. The Fifth Wave
of the Indonesia Family Life Survey: Overview and
Field Report.
Victora, C.G., Vaughan, JP., Barros, FC., Silva, AC.,
Tomasi, E., 2000. Explaining trends in inequities:
evidence from Brazilian child health studies. Lancet.
356(9235):1093-8.
Vidyattama, Y., Miranti, R., Resosudarmo, BP.. 2014. The
Role of Health Insurance Membership in Health
Service Utilisation in Indonesia. Bulletin of Indonesian
Economic Studies. 50(3):393-413.
Wagstaff, A., Paci, P., van Doorslaer, E., 1991. On the
measurement of inequalities in health. Social Science
& Medicine. 33(5):545-57.
Wagstaff, A., van Doorslaer, E., Watanabe. N,. 2003. On
decomposing the causes of health sector inequalities
with an application to malnutrition inequalities in
Vietnam. Journal of Econometrics. 112(1):207-23.
World Health Organization, 2010. World Health Report,
2010: health systems financing the path to universal
coverage. World Health Organization. Geneva.
Evaluating Health Insurance Inequality in Indonesia using Concentration Curve and Index
217
