
Excessive Cigarette Consumption by Indonesian People and
Economic Status in Indonesia
Alifa Jaihan Meifira
Faculty of Public Health, Universitas Airlangga, Mulyorejo, Surabaya, Indonesia
jaihanmeifira@gmail.com
Keywords: Cigarette, Cigarette consumption, Poverty, Cigarette consumption a day, Smoker.
Abstract: Cigarette consumption in Indonesia has increased sevenfold, from 33 billion to 217 billion cigarettes.
Indonesia has producing cigarettes exceeding the maximum given by the tobacco industry roadmap in 2013.
Some 332 billion stems have been produced by Indonesia, an excessive figure amounting to about 260
billion cigarettes (Tobacco Control Support Center, 2014). This study attempts to find a link between
cigarette consumption in society by province and the economic status of Indonesians. Data in this study are
taken from Riskesdas and Susenas. It is concluded that there is a downward trend in the country’s poverty
against the percentage of Indonesia based on province. In addition, it finds that the three provinces that had
the highest have the average daily cigarette consumption in 2013 were Bangka Belitung Islands, with as
many as 18.3 cigarettes each day, followed by South Kalimantan with as many as 16.7 cigarettes and,
finally, Riau with as many as 16.5 cigarettes each day.
1 INTRODUCTION
Indonesia is the largest tobacco producer country in
the world. The first tobacco plantation in Indonesia
was in the 1800s when the Javanese were introduced
by the Netherlands. After that, in the 1930s, they
started producing cigarettes as rolled up with paper
(Aliansi Tembakau Indonesia, 2013). From the
1970s to 2000s, the level of cigarette consumption in
Indonesia has increased sevenfold from 33 billion
stems producing 217 billion cigarettes. In 2008,
consumption rose to 240 billion of cigarettes per
year. With smokers in Indonesia numbering more
than 60 million and cigarette consumption at 240
billion cigarettes each year, it can be calculated that
the average daily cigarette consumption is 10.95
cigarettes (WHO, 2008).
Indonesia’s cigarette production exceeds the
maximum given by the tobacco industry in 2013. As
many as 332 billion cigarettes have been produced
by Indonesia, surpassing the limit set of 260 billion
stems (Tobacco Control Support Center, 2014). A
pack of cigarettes contains 16 cigarettes that, in
bandrol at Rp 9.999, is considered too cheap
(Tobacco Control Support Center, 2014) and is
considered to be the cause of continued increased
occurrence of cigarette consumption in Indonesia
every year. In 2001, it was noted that cigarette
consumption in Indonesia was 182 billion cigarettes,
but the figures for consumption the cigarette
increased significantly by 2009s to 260.8 billion
cigarettes (Tobacco Control Support Center, 2014).
The Tobacco Control Support Center stated that
cigarette consumption in Indonesia increased
significantly from 182 billion cigarettes in 2001 to
260.8 billion cigarettes in 2009. The increase in
consumption was due to factors such as low s
cigarette price, increased household income and
population growth in Indonesia, which is ranked
fourth largest in the world after China, the United
States and Russia (Tobacco Control Support Center,
2014).
The purpose of this article is to know the pattern
of cigarette consumption by the people of Indonesia
in 2007, 2010 and 2013 and to know the economic
status in Indonesia in that year. At the end of this
article will be seen, whether the pattern of cigarette
consumption by the community in every province in
Indonesia will affect the economic status of the
province.
Meifira, A.
Excessive Cigarette Consumption by Indonesian People and Economic Status in Indonesia.
In Proceedings of the 4th Annual Meeting of the Indonesian Health Economics Association (INAHEA 2017), pages 33-37
ISBN: 978-989-758-335-3
Copyright © 2018 by SCITEPRESS – Science and Technology Publications, Lda. All rights reserved
33
2 METHOD
This research is descriptive research and aimed to
know the numbers for cigarette consumption in
Indonesia by province and economic status.
Variables in this study include cigarette
consumption by Indonesian society and economic
status in Indonesia. The data used for this research
are sourced from Riset Kesehatan Dasar
(RISKESDAS) data for 2007, 2010, 2013 and
Survey Sosial Ekonomi Nasional (SUSENAS) data
for 2007, 2010, 2013.
3 RESULTS
Data showed in this study obtained from some
secondary data related to smoking and poverty in
Indonesia. Result about smokers in which smoking
more than 10 years Indonesia grouped by provinces
in Indonesia in year 2007, 2010 and 2013.
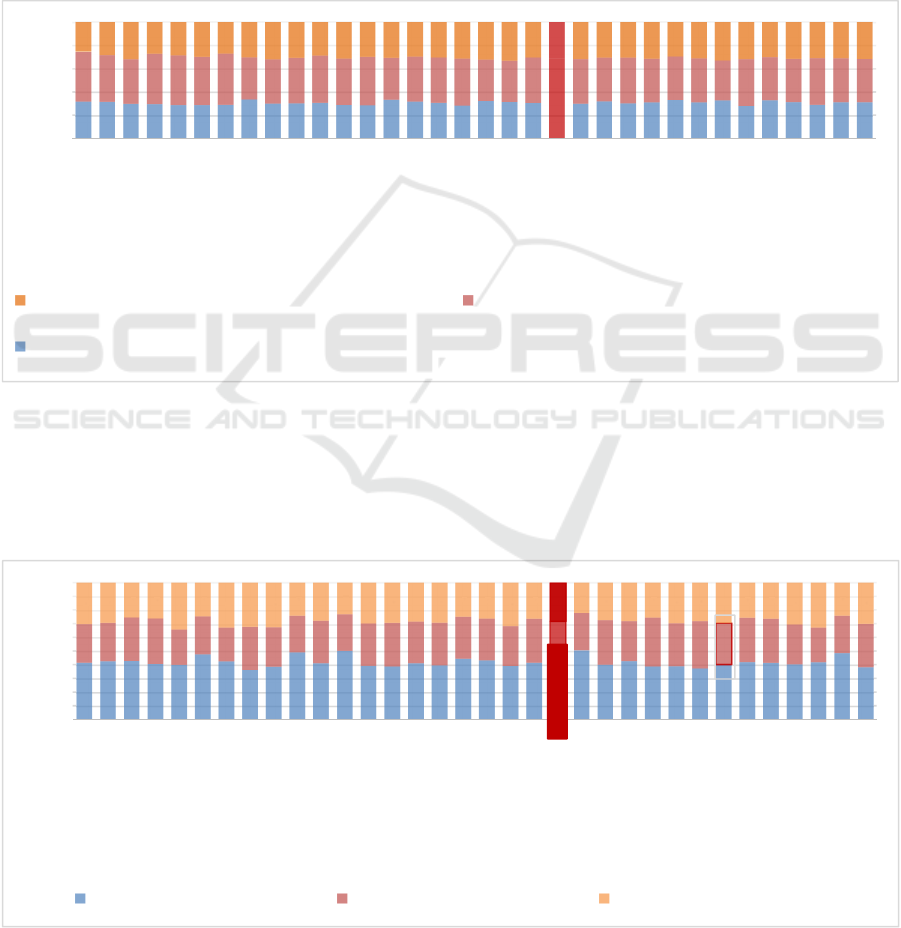
Figure 1: Distribution of Early Age Smokers in Indonesia year 2007, 2010, 2013.
Figure 1 showed that in 2007 the percentage of smokers in Indonesia by province is 29.2%, and then in
2010 the percentage increased becomes 34.7%. However in 2013 the percentage is decreased become 29.3%.
Beside data related to smoking, distribution about poverty in Indonesian population also grouped by
provinces in 2007, 2010, and 2013.
Figure 2: Poverty Distribution of Indonesian Population in 2007, 2010, 2013.
27,8
24,9
24,2
28,7
26,3
25,4
28,9
29,8
25,5
27,2
29,5
25,8
26,9
30,7
30,4
28,8
25,8
29,1
27,8
29,7
29,2
28,2
31,7
30,2
30,1
34,1
30,5
30,7
27
34,4
31,3
30,2
32,6
32,4
37,2
31
30,5
41,2
38,2
35,6
43,2
31,6
31,6
34,3
38,1
34,8
38,5
32,6
36,3
35,7
36,6
31,4
30,8
37,1
34,7
35,2
36,5
38,4
35,5
37,8
36,2
31,6
38,8
38
36,3
40,8
38,7
37,7
21,9
22,4
25,7
25,9
26
26,2
26,5
26,9
27
27,4
27,6
27,8
28,1
28,2
28,3
28,4
28,6
28,9
29,2
29,3
29,3
29,7
30,1
30,3
30,3
30,4
30,4
30,7
30,8
31,3
31,3
31,9
32,3
32,7
0%
20%
40%
60%
80%
100%
Papua
Bali
Kalimantan…
NTT
Sulawest…
Sulawesi Barat
Kalimantan…
DI Yogyakarta
Sulawesi…
Kalimantan…
Jambi
Kalimantan…
Papua Barat
Jawa Tengah
Riau
Sumatra Utara
Maluku
Jawa Timur
DKI Jakarta
Aceh
Indonesia
Kep. Bangka…
Sumatera…
Sumatra Barat
NTB
Bengkulu
Sulawesi Utara
Sulawesi…
Kepulauan…
Lampung
Banten
Maluku Utara
Gorontalo
Jawa Barat
Percentage of Smokers Aged More than 10 Years in 2013 Percentage of Smokers Aged More than 10 Years in 2010
Percentage of Smokers Aged More than 10 Years in 2007
7,97
6,01
6,01
16,41
6,24
16,53
6,72
15,63
6,18
11,45
15,42
7,44
7,14
17,23
9,53
14,21
14,49
14,71
4,61
18,68
12,52
8,09
20,3
9,78
30,44
23
8,31
12,86
10,08
18,11
6,79
4,29
11,08
11.21
5,55
4,04
4,54
13,57
4,1
9,7
4,03
13,98
4,7
6,31
11,8
4,02
5,73
14,33
7,17
11,34
10,2
10,58
3,48
14,65
4,39
16,73
6,84
28,16
18,75
7,75
9,82
7,87
14,3
4,99
2,66
6,29
5,66
4,03
3,5
10,32
5,22
8,33
5,05
13,58
5,06
5,49
10,15
3,35
5,27
12,7
6,41
10,21
7,94
8,73
3,63
11,57
8,45
3,47
13,53
6,27
19,48
16,96
6,08
9,17
6,01
11,24
5,01
3,27
5,38
8,56
0%
10%
20%
30%
40%
50%
60%
70%
80%
90%
100%
Papua
Bali
Kalimantan…
NTT
Sulawest Tenggara
Sulawesi Barat
Kalimantan…
DI Yogyakarta
Sulawesi Selatan
Kalimantan Barat
Jambi
Kalimantan Timur
Papua Barat
Jawa Tengah
Riau
Sumatra Utara
Maluku
Jawa Timur
DKI Jakarta
Aceh
Indonesia
Kep. Bangka…
Sumatera Selatan
Sumatra Barat
NTB
Bengkulu
Sulawesi Utara
Sulawesi Tengah
Kepulauan Riau
Lampung
Banten
Maluku Utara
Gorontalo
Jawa Barat
Percentage of Poverty in 2007 Percentage of Poverty in 2010 Percentage of Poverty in 2013
12.57 9.87
9.43
INAHEA 2017 - 4th Annual Meeting of the Indonesian Health Economics Association
34
From Figure 2, it is known that the average
distribution of poverty of Indonesia Population in
2007 was 12.57%, then in 2010 decreased become
9.87% and in 2013 decreased become 8.45%.
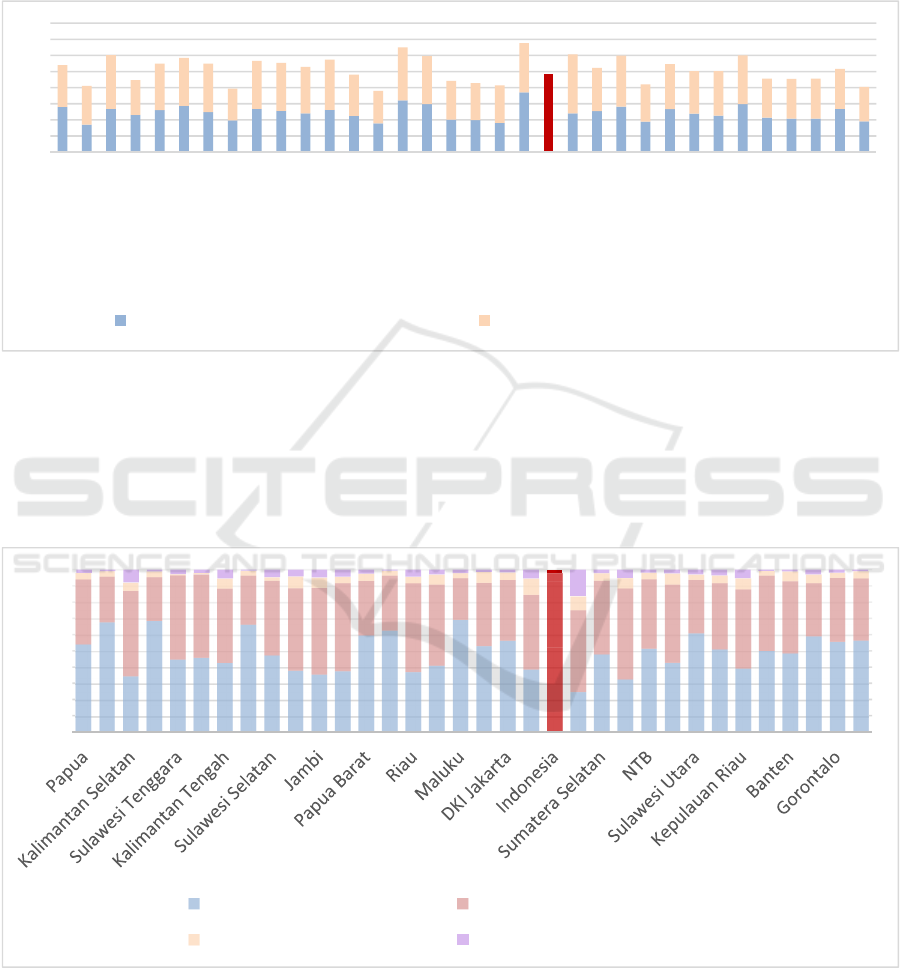
Figure 3 showed the average distribution of the
number of cigarettes smoked daily in 2007 and 2013
by Province in Indonesia.
Figure 3: The average distribution of the number of cigarettes smoked daily in 2007 and 2013.
From the figure 3 it can be seen the distribution
of cigarettes smoked each year in 2007 and 2013, in
the average known in Indonesia in 2007 was 12
cigarettes a day, and in the year 2013 average of
cigarettes consumption a day increased a little bit
become 12.3 cigarettes a day.
Figure 4 showed the percentage of people in
Indonesia based on the number of their average
cigarettes consumption in a day.
Figure 4: Distribution The average number of cigarettes smoked daily in 2010.
Figure 4 showed that the average number of
cigarettes smoked every day in 2010 by province in
Indonesia, it can be seen that as many as 52.3% of
Indonesian people consume cigarettes as much as 1-
10 cigarettes a day.
54,2
67,8
34,7
68,7
44,9
46
43
66,3
47,3
38,8
35,7
37,8
59,9
62,7
37,2
41,1
69,4
53,2
56,4
38,8
52,3
25,1
48
32,6
51,7
43
61
51,2
39,3
50,3
48,6
59,3
55,7
56,5
40
27,9
52,4
26,8
51,5
51,3
45,5
30,2
46
51,6
53,1
54,2
33,5
33,7
54,5
49,7
25,6
38,9
37,4
46
41
50,1
45,4
55,9
42,6
47,8
32,8
40,7
48,7
46
44,5
32,6
39,3
38,3
3,8
3,3
5
3,4
0,7
0,7
6,2
3
2
7,4
6,3
3,8
4,3
3
3,9
6,2
3
6,5
4,5
9,9
4,7
8,5
4,4
6,4
3,9
6,9
3,1
4,6
6,8
2,8
5,8
5,2
3
4,2
2
0,9
7,9
1,1
2,8
2
5,4
0,6
4,6
4,2
4,8
4,3
2,4
0,6
4,3
3
2,1
1,4
1,7
5,4
2…
16,2
2,2
5,1
1,8
2,3
3
3,5
5,2
0,8
1,1
2,9
1,9
1
0%
10%
20%
30%
40%
50%
60%
70%
80%
90%
100%
1-10 Cigarettes a Day 11-20 Cigarettes a Day
21-30 Cigarettes a Day More than 31 Cigarettes a Day
14
8,5
13,4
11,5
13
14,3
12,4
9,8
13,4
12,8
12
13,1
11,2
8,9
16
14,9
10,1
9,9
9,1
18,5
12
12
12,7
14,1
9,4
13,3
11,9
11,3
14,9
10,7
10,4
10,4
13,4
9,5
13
12
16,7
10,8
14,4
14,9
15
9,9
14,9
14,9
14,4
15,6
12,8
10,1
16,5
14,9
12
11,5
11,6
15,3
12,3
18,3
13,4
15,8
11,6
14
13,2
13,8
15,1
12,1
12,3
12,4
12,4
10,7
0
5
10
15
20
25
30
35
40
Papua
Bali
Kalimantan…
NTT
Sulawesi…
Sulawesi Barat
Kalimantan…
DI Yogyakarta
Sulawesi Selatan
Kalimantan Barat
Jambi
Kalimantan…
Papua Barat
Jawa Tengah
Riau
Sumatera Utara
Maluku
Jawa Timur
DKI Jakarta
Aceh
Indonesia
Kep. Bangka…
Sumatera…
Sumatera Barat
NTB
Bengkulu
Sulawesi Utara
Sulawesi Tengah
Kepulauan Riau
Lampung
Banten
Maluku Utara
Gorontalo
Jawa Barat
Cigarettes Consumtion a Day in 2007 Cigarettes Consumtion a Day in 2013
Excessive Cigarette Consumption by Indonesian People and Economic Status in Indonesia
35

4 DISCUSSION
From Figure 1.1, it can be seen that, in 2007, the
percentage of the national population aged 10
years and over who smoked every day was as
much as 29.2%. The highest percentage of smokers
was found in Bengkulu Province (34.1%),
followed by Lampung (34.4%) and Gorontalo
(32.6%). National prevalence of smokers in 2010
was as much as 34.7%. The hig
hest prevalence of smokers in 2010 was found in
Central Kalimantan Province (43.2%), followed by
East Nusa Tenggara (41.2%) and North Maluku
(40.8%). In 2013, it is found that the average
percentage of smokers in Indonesia is 29.3%) The
three provinces having the highest percentage rate in
2013 are West Java (32,%), Gorontalo (32.3%) and
North Maluku (31.9%).
Based on Figure 1.2, the incidence rate in 2007,
the percentage of the national poverty rate was.5%.
NTB province is the poorest province with 30.44%,
followed by South Sumatera Province (20.3%) and
Lampung Province (18.11%). In 2010, the poorest
province in Indonesia is NTB with 28.16% followed
by Bengkulu Province (18.75%) and South Sumatra
(16.73%). In 2013, it can be seen that the national
percentage was (8.45%, with the poorest provinces
in Indonesia being NTB with as much as 19.48%,
followed by Yogyakarta Province (13.58%) and
South Sumatera Province (13, 53%).
From Figure 1.3, it can be seen that, in 2007, the
average daily national consumption of cigarettes was
as much as 12 cigarettes. The three provinces with
the highest average daily cigarette consumption are
Aceh Province with 18.5 cigarettes a day, followed
by Riau Province with 16 cigarettes a day and South
Sumatera Province and Province of Kepulauan Riau
with an average daily consumption of 14.9
cigarettes. The national average cigarette
consumption a day in 2013 was 12.3 cigarettes a day
with the three provinces having the highest average
daily cigarette consumption being Bangka Belitung
Islands Province with as many as 18.3 stems,
followed by South Kalimantan Province with as
many as 16.7 stems and Riau Province with as many
as 16.5 cigarettes a day.
From Figure 1.4 above is can be seen that, in
2010, the majority of Indonesia's population
consumed cigarettes by as many as 1-10 stems with
an average national percentage of 52.3%. The three
provinces with the highest percentage for
consumption of 1-10 cigarettes a day were Maluku
Province (69.4%), East Nusa Tenggara (68.7%) and
Bali Province (67.8%). In 2010, the national average
percentage for cigarette consumption was 11-20
cigarettes per day (41%), where the three provinces
with the largest percentage were West Sumatra
(55.9%), East Kalimantan (54.2%) and Province
South Kalimantan (52.4%). The national average
percentage for cigarette consumption is 21-30
cigarettes a day (4.7%). The three provinces with the
highest percentage of cigarette consumption of 21-
30 cigarettes a day are Aceh Province (9.9%),
Bangka Belitung Islands (8.5%) and West
Kalimantan (7.4%). The national average percentage
for cigarette consumption is more than 31 cigarettes
a day (2.1%). Where there are three provinces with
the highest percentage for cigarette consumption of
more than 31 cigarettes a day, Bangka Belitung
Islands (16.2%), South Kalimantan (7.9%) and Aceh
(5.4%).
It can be seen that, in 2007, the highest
percentage of smokers in Indonesia is found in
Bengkulu Province (34.1%), Lampung (34.4%) and
Gorontalo (32.6%). In the same year, NTB province
is the poorest province with the highest percentage
of poverty (30.44%), followed by South Sumatera
Province (20.3%) and Lampung Province (18.11%).
Then the three provinces with the highest average
cigarette consumption are Aceh Province with as
many as 18.5 cigarettes a day, followed by Riau
Province with as many as 16 cigarettes a day, and
the Province of South Sumatra and Riau Islands
Province with average daily consumption of as many
as 14.9 cigarettes.
In 2010, it can be seen that the highest
prevalence of smokers in Indonesia was found in
Central Kalimantan Province (43.2%), followed by
East Nusa Tenggara (41.2%) and North Maluku
(40.8%). Regarding the value of national poverty
(9.87%), it is seen that the three provinces with the
highest percentage of poverty are NTB (28.16%),
followed by Bengkulu (18.75%) and South Sumatera
Province (16.73%). For the national average
percentage for cigarette consumption of 1-10 stems
(52.3%), the province with the highest percentage of
consumption is Maluku Province (69.4%). For the
national average percentage for cigarette
consumption of 11-20 cigarettes per day (41%), the
province with the highest consumption percentage is
West Sumatera Province (55.9%). Next is the
national average percentage for cigarette
consumption of 21-30 cigarettes per day (4.7%) and
the province with the highest consumption is Aceh
(9.9%). The last is the national average percentage
for cigarette consumption of more than 31 cigarettes
INAHEA 2017 - 4th Annual Meeting of the Indonesian Health Economics Association
36

as day (2.1%), and the province with the highest
percentage is the Province of Bangka Belitung
Islands (16.2%).
5 CONCLUSIONS
The national average cigarette consumption inhaled
in 2007 and 2013 was as many as 12 cigarettes a
day. Then it can be seen that, in 2010, the majority
of Indonesia's population consumed as many as 1-10
cigarettes with an average national percentage of
52.3%. In 2010, the national average percentage for
cigarette consumption of 11-20 cigarettes per day
was 41% and the national percentage for cigarette
consumption of 21-30 cigarettes per day was 4.7%.
The national percentage for cigarette consumption of
more than 31 cigarettes per day was2.1%. The
national average percentage for cigarette
consumption of 11-20 cigarettes a day (41%), is still
very high. In 2010, the highest prevalence of
smokers was in Central Kalimantan Province with a
figure of 43.2%.
It can be seen that the pattern of the distribution
of smokers by age ≥ 10 years for 2007 and 2013
tends to decrease, as there are 20 provinces that
experience a decline rate from 2007 to 2013.
Indonesia is a country with high cigarette
consumption as can be seen from the results
presented. The majority of provinces in Indonesia
have a daily cigarette consumption that exceeds the
national average. In 2007, there were 18 provinces
with numbers exceeding the national average. From
the above results, it can be concluded that the trend
of daily cigarette consumption by province from
2007 to 2013 is one of increase, because there are 28
provinces found to that have increased daily
cigarette consumption from 2007 to 2013, while, in
2010, it is found that the average daily cigarette
nationwide is as many as 52.3%, with as many as 1-
10 cigarettes a day.
For further research, data on household
expenditure for cigarette consumption can be added
in order to see the correlation between Indonesian
cigarette consumption and its economic status.
REFERENCES
Aliansi Tembakau Indonesia. 2013. Peta Jalan
Pengendalian Produk Tembakau Indonesia. Jakarta:
Muhammadiyah University Press.
Badan Penelitian dan Pengembangan Kesehatan 2007.
Departemen Kesehatan Republik Indonesia. Laporan
hasil riset kesehatan data nasional (RISKESDAS).
Jakarta: Departemen Kesehatan Republik Indonesia
Badan Penelitian dan Pengembangan Kesehatan 2010.
Departemen Kesehatan Republik Indonesia. Laporan
hasil riset kesehatan data nasional (RISKESDAS).
Jakarta: Departemen Kesehatan Republik Indonesia
Badan Penelitian dan Pengembangan Kesehatan
Departemen Kesehatan Republik Indonesia. 2013.
Laporan hasil riset kesehatan data nasional
(RISKESDAS). Jakarta: Departemen Kesehatan
Republik Indonesia.
Tobacco Control Support Center. 2012. Fakta Tembakau
dan Permsalahan nya di Indonesia Tahun 2012.
Jakarta : TCSC IAKMI.
World Health Organization (WHO). 2008. Indonesia’s
tobacco profile. WHO report on the global tobacco
epidemic. The MPOWER package. Geneva: World
Health Organization.
Excessive Cigarette Consumption by Indonesian People and Economic Status in Indonesia
37
