
The Effect of Education and Productivity to Poverty
Putri Ulfa Kamalia
Postgraduate Student of Universitas Negeri Surabaya
Keywords: Effect, Education, Productivity, Poverty.
Abstract: The purpose this research is to analyze the effect of education and productivity to poverty in Madura Island
partially and simultaneously. In this research, there are two independent variables are education (X1) and
productivity (X2). Then, poverty (Y) is a dependent variable. The population in this research are four districts
in Madura Island namely Bangkalan, Sampang, Pamekasan and Sumenep. The data used is secondary data
from 2011-2015. The data collection technique used is purposive sampling. The method of analysis using
pan-el data regression with SPSS application. The results of this research showed that education and
productivity have a significant effect to poverty in Madura Island. As for suggestions, the population should
be given the widest opportunity to take education to a higher level and to increase productivity should be
increased the development of industrial infrastructure because most residents in Madura Island is still
livelihood as farmers and fishermen.
1 INTRODUCTION
Suramadu bridge connecting Madura Island
(Bangkalan) with Java Island (Surabaya) along 5.438
meters was inaugurated by the President of the Re-
public of Indonesia, Susilo Bambang Yudhoyono on
Tuesday, June 10, 2009. With the construction of the
longest bridge in Indonesia is expected to improve the
economy of Madura facilitate the flow of
transportation. Suramadu bridge is also expected to
in-crease industrial expansion in Madura.
However, based on The Central Bank of
Indonesia, the potential for poverty in Indonesia is
largely located in Eastern Indonesia. East Java is
ranked 15th with the largest percentage of poor
people. High economic growth in fact leads to
decrease in poverty. In East Java, the highest poverty
is predominantly in the northern regions of East Java
and the island of Madura with a subsistence economy.
Central Bureau of Statistics (BPS) in analyzing
poverty using the concept of basic needs approach.
The poor are residents who spend per capita per
month for food and non-food less than the poverty
line. Poverty line in the city is higher than in the
village be-cause the prices of goods in the city tend to
be higher than in the village.
Indeed, economic growth is key in the
development of a region. Increased economic growth
will increase people's income and purchasing power
so that per capita expenditure per month increases and
the poorest categorized population is reduced.
Madura Island became part of East Java Province
experiencing unfavorable conditions. The pace of
economic growth is slow and per capita income lags
be-hind. This is evidenced by the data from The
Central Bank of Indonesia in 2014 on East Java about
welfare rate shows the highest poverty mostly located
in the northern region of East Java and the island of
Madura namely Sampang, Bangkalan, Probolinggo,
Sumenep and Pamekasan are the five poorest areas in
East Java. This data is also supported by research
conducted by Soejoto (2016) shows the classification
of Madura regional development pattern as follows:
Table 1: Classification of regional development patterns.
No
Classification
District
1
Forward but Depressed
Sumenep
2
Relatively
Disadvantaged
Pamekasan,
Sampang
3
Very Disadvantaged
Bangkalan
Source: Soejoto (2016)
Poverty alleviation commitments must be
accompanied by government social expenditure
support, especially for productivity activities and
community empowerment. In addition to
productivity, high quality of education and health are
534
Kamalia, P.
The Effect of Education and Productivity to Poverty.
In Proceedings of the 2nd International Conference on Economic Education and Entrepreneurship (ICEEE 2017), pages 534-539
ISBN: 978-989-758-308-7
Copyright © 2017 by SCITEPRESS – Science and Technology Publications, Lda. All rights reser ved
formed on composite index of HDI, then the capital
to access the economy becomes easier, so that poverty
can be sup-pressed. Based on The Central Bank of
Indonesia, the Red Zone (quadrant 4) is low HDI,
high% of poor people are in Sampang, Bangkalan,
Probolinggo, Sumenep, Pamekasan, Situbondo,
Bondowoso. The low quality of Human Resource
society and the high poverty are mostly located in
Madura Island and horseshoe area.
Based on the above description, the authors are
interested to researching the effect of education and
productivity to poverty in Madura Island. Thus, the
research formulation in this research are: 1) Does
education affect poverty in Madura Island? ; 2) Does
productivity affect poverty in Madura Island? ; 3) Are
education and productivity simultaneously affecting
poverty in Madura Island?. The purpose of this study
was to analyze the effect of education and
productivity to poverty in Madura Island either
partially and simultaneously.
2 LITERATURE REVIEW
2.1 The Theory of the Vicious Poverty
Circle
According to Samuelson (2006: 440) the vicious
circle in developing countries is low average income;
low savings and investment; slow capital
accumulation and low productivity. Barriers to
development often get heavy. Low levels of income
make it difficult to create savings, so capital is
difficult to collect. As a result, productivity cannot
increase so that in-come is unlikely to increase.
Successful development must break the chain in some
places. If the country succeeds simultaneously to
invest more, develop skills and reduce population
growth, it can break the vicious cycle of poverty and
an angel circle will lead to rapid economic
development.
Very low community revenues and an
underdeveloped banking system in the early stages of
the economic growth process do not allow a
developing country to address the underlying capital
shortage. Vicious circle theory illustrates the
difficulties facing a poor country to realize
development (Sukirno, 2006: 439).
2.2 Productivity: Roles and
Determining Factors
The term productivity refers to the amount of goods
or services that a worker can produce every hour of
work. The key role of productivity in determining the
standard of living prevailing in a country is the same
as that of a sailor. Look again that the Gross Domestic
Product of a country's economy measures two things
at once the total income that each resident gains in
economic activity and the total cost incurred to
produce goods and services (Mankiw, 2014: 42).
According Mankiw (2014: 43-44) factors that
determine the productivity of physical capital, human
capital, natural resources and technological insights.
The completeness of the equipment and structures
used in producing goods and services is called
physical capital. Then, knowledge and skills acquired
by workers through education, training and
experience. Like physical capital, human capital also
enhances a country's ability to produce goods and
services. Hu-man capital also produces factors of
production. Furthermore, natural resources are inputs
in production activities provided by nature such as
land, rivers and mineral deposits. Then, that can affect
productivity is the mastery of science and technology
is an under-standing of the best ways to produce
goods and services.
It is necessary to understand the difference be-
tween the mastery of science and technology with
human capital although both are closely related, but
there are important differences. Mastery of science
and technology refers to people's understanding of
how things work. Human capital refers to resources
that are expected to transform that understanding to
the workforce. In other words, if likened to a book
then science is the quality of the content of a book,
while human capital is the amount of time used by
someone to read the book (Mankiw, 2014: 45).
The special characteristic possessed by human
capital is that it cannot be lost or diminished if the
factors of production are used, utilized or sold. Of-ten
more used human capital is not the measure de-
creases but its value becomes higher (Irawan, 2002:
120).
Thus, Human Capital Theory and in a different
sense Correspondence Theory both provide a set of
implications for policies to alleviate poverty. Broadly
speaking, the former implies that an effective anti-
poverty strategy should incorporate the enhancement
of education and skills amongst poor households.
This will enhance their productivity in the informal
urban and rural economy, and it will also increase
their eligibility for paid employment in the formal
The Effect of Education and Productivity to Poverty
535
sector and for advancement once they are employed.
Correspondence Theory similarly implies that in-
creasing levels of schooling in the labour force are
likely to be functional to the process of employment
growth. However it does not necessarily imply a
benign impact for those school leavers who fail to
secure access to the formal sector (Oxaal, 1997).
2.3 Amartya Sen's Capability
Approach
Amartya Sen, the winner of the Nobel Prize in eco-
nomics in 1998, stated that the capability to function
is the most important thing to determine the status of
poor or not. Sen further argues that poverty cannot be
measured properly on the basis of income or even
with utility as it is understood so far; the most dizzy
is not what a person has or can be what he is and what
he does and can do. This is referred to as
functionality. Sen defines capability as one's own
freedom, according to their personal characteristics
and control over commodities. This view helps to
explain why development economists strongly
emphasize the importance of education and health.
They conclude that countries with high income levels
but low health and education standards are a growing
but undeveloped country (Todaro, 2014: 19).
2.4 Education and Poverty
There are many, various and interconnected causes of
poverty, and we can't use a magic formula to eradicate
it. But, we can consider education as a reducing risk
element of high poverty, which may pre-vent the
occurrence of another generation, much poorer. In the
underdeveloped countries and developing countries,
people instinctively know that education is a good
thing for their children, and in developed countries,
we have a lot to learn and to re-learn about the
importance of education. People who live in poverty
are aware of the fact that sending their children to
school will give them opportunities that they didn't
have. Even if education is not sufficient, due to the
multidimensional nature of poverty. Educational
systems, both at the micro and macro-level, have an
important role in supporting social upward mobility.
Education in all its forms, in my opinion, is one of the
most important factors in breaking the vicious circle
of intergenerational transmission of poverty.
Investments in this area are profitable over the long
term and bring the most reliable profits. At the same
time, investment in education of children, especially
those who are at the be-ginning of the road, represents
a safe start in life. Heading to this, nations are creating
for themselves both or education and training systems
more inclusive at all levels and for all ages, whether
we speak of primary and secondary school levels,
higher education or vocational training and education
for adult person (Mihai, 2015).
Based on Diaz's (2008) research analyzes both the
monetary and non-monetary effects of the education
level of the head of the household on poverty. He
propose that schooling returns should not be thought
as a single number - usually the schooling coefficient
in an income equation - but as a set of elements whose
length depends on the number of identified poverty
dimensions. He also found interesting dis-similarities
by gender and urban-rural location. Exploring the
non-pecuniary returns, he found that the education of
the head positively influences family health and
housing conditions.
Lelkels research (2010) showed that for a
majority of countries, labour market-related factors
(employment status and work intensity) and
education are more important in explaining
inequalities than are age or household structure.
Income differences be-tween education group’s
account for the largest share of total inequality in
Southern European countries.
3 METHODS
This study used a quantitative approach with the type
of associative research. This research is an associative
research because it is a research that aims to know the
relationship between two variables or more and know
its affect (Sujarweni, 2014: 11).
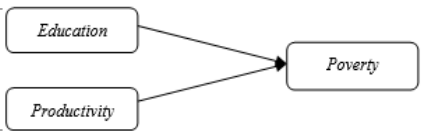
In this research, there are two independent
variables are education (X1) and productivity (X2).
Then, poverty (Y) is a dependent variable. Here is a
re-search design:
Figure 1: Research design.
Population of this research is Madura Island
namely Bangkalan, Sampang, Pamekasan Sumenep.
The data collection technique by purposive sampling
are data of education, productivity and poverty from
2011-2015 in the four districts. The type of data is
secondary data obtained from the Central Bureau of
Statistics (BPS).
Data analysis technique used in this research is
panel data regression by using SPSS application. To
ICEEE 2017 - 2nd International Conference on Economic Education and Entrepreneurship
536

measure education (X1) that is with percentage of
educational level of high school graduates*(Source:
BPS). To measure productivity (X2) that is with
percentage data of Gross Regional Domestic Product
according to business field ** (Source: BPS). Then,
to measure poverty by percentage of poverty level***
(Source: BPS).
4 RESULTS AND DISCUSSION
Based on the balance of data, in this study is a panel
of balanced data (balanced panel). The data panel is
balanced if each cross section unit has the same
amount of time series observation (Suliyanto, 2011:
229). In this study there are four units of cross section,
each district has observation time series for five years.
In this study, the researchers wanted to study the
effect of education (X1) and productivity (X2)
variables to poverty (Y) in Madura Island namely
Bangkalan, Sampang, Pamekasan and Sumenep for
the period of 2011-2015.
The assumptions used in the analysis of this re-
search data are intercept and constant slope
coefficient over time. According to Ghozali (2014:
294) we assume intercept and slope coefficients are
constant over time and space, while error term reflects
differences over time and individuals. Assuming this
means ignoring the time and space dimension, so
direct the Ordinary Least Square regression. In this
study there are four districts that have five series da-
ta so that researchers have observations of 20.
Regression equation in this research is as follows:
𝑌
𝑖𝑡
= 𝛽
0
+ 𝛽
1
𝑋
1𝑖𝑡
+ 𝛽
2
𝑋
2𝑖𝑡
+ 𝜇
𝑖𝑡
(1)
Where i = unit cross section; t = time period.
Based on data processing using SPSS application
obtained the following results:
Table 2: Autocorrelation test.
Source: Data processed by researchers, 2017
Based on the output the value of R is 0.878 means
the correlation between productivity and education
variables against poverty of 0.878. This means a tight
correlation because the value of 0.878 approaching to
1. Then, the value of R Square (R2) of 0.772 means
the percentage of the contribution of productivity and
education variables to poverty is 77.2%, while the rest
influenced by other variables that are not included in
this model. Standard error of the estimate of 1.78656.
Durbin Watson's value is used to see whether or not
an autocorrelation is in the regression model. The DW
value of that output is 2.057. Then for the dL and dU
values in the DW table at 0.05 significance with n=20
and k=2 the dL value is 1.100 and the dU value is
1.537. Thus, the value 4- dL is 2.9 and the value 4-dU
is 2.463. Thus dU<DW<4-dU is 1.537<2.057<2.463
then there is no positive or negative autocorrelation.
Table 3: Multicolinearity test.
From the above output, obtained the tolerance value of
both independent variables greater than 0.1 is 0.980 and
VIF value less than 10 that is 1.020 so there is no
multicollinearity.
Table 4: Partial test.
Coefficients
a
Model
Standardized
Coefficients
Beta
t
Sig.
1
(Constant)
16.35
4
.000
Education
.878
7.502
.000
Productivity
.056
2.997
.003
a. Dependent Variable: Poverty
Source: Data processed by researchers, 2017
From these outputs, the education variables have
a t-value of 7.502 with a significance level of 0.000.
The productivity variable has a t value of 2.997 with
a significance level of 0.003. T table can be seen in
the statistical table on the significance of
0.05/2=0.025 with df=n-k-1 or 20-2-1=17, the results
obtained for table t of 2.110. Thus, t arithmetic
Model Summary
b
Mod
el
R
R
Square
Adjust
ed R
Square
Std. Error of
the Estimate
Durbin-
Watson
1
.878
a
.772
.745
1.78656
2.057
a. Predictors: (Constant), Productivity, Education
b. Dependent Variable: Poverty
Model
Collinearity Statistics
Toleran
ce
VIF
1
(Constant)
Education
.980
1.020
Productivity
.980
1.020
a. Dependent Variable: Poverty
Source: Data processed by researchers, 2017
The Effect of Education and Productivity to Poverty
537

education variables greater than t table (7.502>2.110)
and level of significance 0.000< 0.05. This means that
education has a partial effect on poverty. Then, t
calculate the productivity variable is greater than t
table (2.997>2.110) and significance level
0.003<.0.05. This means that productivity partially
affects poverty.
Table 5: Simultaneous test.
ANOVA
b
Model
F
Sig.
1
Regression
28.709
.000
a
Residual
Total
a. Predictors: (Constant), Productivity, Education
b. Dependent Variable: Poverty
Source: Data processed by researchers, 2017
From the output, obtained F count equal to 28.709
and significance value equal to 0.000. F table can be
seen in table F at the 0.05 significance level with
df1=2 and df2= (n-k-1) is (20-2-1=17) to obtain F
table of 3.592. Thus, F arithmetic> F table
(28.709>3,592) and a significance level of
0.000<0.05. Thus, education and productivity have a
significant effect simultaneously to poverty.
The results obtained in accordance with the grand
theory. According to Samuelson (2006: 440) the
vicious circle in developing countries is low aver-age
income; low savings and investment; slow capital
accumulation and low productivity.
There is a correlation between educations to
poverty. In general, if a person's education is low, he
will work as a hSired laborer or work for a low wage.
When the wages received are low, then the income is
low. When income is low, then productivity is low
and will create poverty. It will go on like a cycle
called the vicious cycle of poverty.
And then, Lelkels research (2010) showed that for
a majority of countries, labour market-related factors
(employment status and work intensity) and
education are more important in explaining
inequalities than are age or household structure.
Based on the result of the analysis, education
factor can reduce poverty level. When a person has a
high education, he / she will get a decent job in
accordance with the competence of his field; As well
as the wages received. This will increase income and
increase consumption. As consumption increases,
productivity will increase so that economic growth
will also increase and will reduce poverty slowly but
surely. In accordance with the theory, education is a
capital investment of human capital which if always
used will not be exhausted, but will improve the
ability and usefulness that will increase productivity.
5 CONCLUSIONS
Based on the results of research, the education
partially affect to poverty in Madura Island.
Productivity partially affect to poverty in Madura
Island. Then, education and productivity
simultaneously affecting poverty in Madura Island.
As for suggestions for the results of this study is due
to the education effect on poverty in Madura Island
then the population should be in Madura given the
widest opportunity to take education to a higher level
because education is the investment of human cap-
ital. Likewise to increase productivity in Madura Is-
land should be increased the development of
industrial infrastructure because most residents in
Madura Island is still livelihood as farmers and
fishermen. The implications of this study are for
further research that is to improve certain things that
have not been reached by this research. For example,
by adding other variables that affect poverty that has
not been studied in this study, that are capital, income
and health. Furthermore, research can also be
expanded within the scope of a province or country.
REFERENCES
***BPS. Number and Percentage of Poor People by
Regency/City.
https://jatim.bps.go.id/4dm!n/tabelExcelIndo/Indo_23
_12065936.xls. Accessed on May 25, 2017.
*BPS. 2012. East Java Provincial Education Executive
Report 2011. BPS of East Java Province.
*BPS. 2013. East Java Provincial Education Executive
Report 2012. BPS of East Java Province.
*BPS. 2014. East Java Provincial Education Executive
Report 2013. BPS of East Java Province.
*BPS. 2015. East Java Provincial Education Executive
Report 2014. BPS of East Java Province.
*BPS. 2016. Executive Statistics of Education Statistics of
East Java Province. 2015. BPS of East Java Province.
**BPS. 2016. Gross Regional Domestic Product of
Regency / City by Business Field 2011-2015. BPS of
East Java Province.
Diaz, B. Z., 2010. Different Impact Channels of Education
on Poverty. e-Estudios Gerenciales Journal. Vol 26
(114).
http://bi.go.id/en
ICEEE 2017 - 2nd International Conference on Economic Education and Entrepreneurship
538
Lelkes, Orsolya, Marton Medgyesi & Istvan Gyorgy Toth.
2010. The Factors Affecting the Risk of Poverty and
Inequalities in Income Distribution. European
Observatory on the Social Situation and Demography.
Available online at http://www.sciencedirect.com.
Retrieved March 16, 2017.
Mankiw, N. Gregory, Euston Quah, Peter Wilson. 2014.
Introduction to Macro Economy Asian Edition. Jakarta:
Salemba Empat.
Mihai, Mihaela, E. T., Daniela Manea. 2015. Education and
Poverty. Procedia Economics and Finance. Vol 32
(855-860). Available online at
http://www.sciencedirect.com. Retrieved March 16,
2017.
Oxaal, Z., 1997. Education and Poverty: A Gender
Analysis. UK: Institute of Development Studies
University of Sussex. Available online at
http://www.ids.ac.uk/bridge. Retrieved March 16,
2017.
Samuelson, P. A., William D. N., 2016. Macro Economy.
Jakarta: Erlangga.
Soejoto, A., 2016. Typology of Regional Economic
Development Pattern. Surabaya: Seminar International
ICEEE 1
st
UNESA.
Sujarweni, V. W., 2014. Research methodology.
Yogyakarta: Pustaka Baru Press.
Sukirno, S., 2006. Macro-Economic Theory of
Introduction. Jakarta: Rajawali Pers.
Suliyanto. 2011. Applied Econometrics: Theory &
Applications with SPSS. Yogyakarta: ANDI Offset.
Todaro, M., Stephen C. S., 2014. Economic Development.
Jakarta: Erlangga.
The Effect of Education and Productivity to Poverty
539
