
The Implementation of Curriculum: A Case Study
Ananda Setiawan, Trisno Martono and Gunarhadi Gunarhadi
Sebelas Maret University, Surakarta, Indonesia
Anandasetiawan.blogku@gmail.com
Keywords: Curriculum, Education, National Education Standards.
Abstract: The aim of this research is to examine the implementation of eight national education standards at SMA
Negeri 2 Surakarta. This research is a qualitative method by using primer and secondary data. The analyzing
of data is using triangulation technique. Based on the assessment of indicators, the implementation of eight
national education standards resulted the percentage of the success in implementation which is 82.26%
including standard content is 91.67%, standard process is 85%, standard of graduate competence is 87.5%,
standard of educators and educational personnel is 79.17%, standard of facilities and infrastructure is 91.67%,
management standard is 78.47%, financing standard is 79.86%, the standard of assessment in education is
77.08%. The summary of the research is implementation standard as the best standard which has many
contents as follows: graduate competence, process and facilities, and infrastructure. Meanwhile, the
implementation of the lowest standards is financing, educators and educational personnel, Management and
assessment of education.
1 INTRODUCTION
The success of education development in education
instance that influenced of the component
establishment as the supporter of education. One of
the education development components is the
curriculum. Purwadi (2003:25) describes of the
curriculum definition into six parts, as follows: (1)
Curriculum as an idea; (2) the formal curriculum in
the form of documents that serve as guidelines and
guidance in implementing the curriculum itself; (3)
Curriculum that according to the perceptions of
teachers; (4) Operational curriculum are implemented
or operated by the teacher in the classroom; (5)
Curriculum is the curriculum experience that must be
experienced by learners; and (6) Curriculum is
obtained from the application of the curriculum itself.
The curriculum is used and developed in the
educational unit according to the needs and
challenges that exist in the current. Teachers’ beliefs
about learners, curriculum, and numerous other
factors directly influence and/or mediate classroom
practice (
Arredondo & Rucinski, 1998: 288). The
curriculum which is the basis of every educational
experience (Ingley, 2016: 270). A curriculum should
be developed along with the development of science,
art, technology, and demand of competence to be
achieved as the educational objectives so that the
construction of the civilization of human resources in
Indonesia can be completed in accordance with the
educational ideals of Indonesia in the future.
Indonesian curriculum as one of the important
component in education has experienced several
different curriculums. They are 1947, 1964, 1968,
1973, 1975, 1984, 1994, 1997, 2004 (competency-
based curriculum), curriculum 2006 and curriculum
2013.
At this time, the curriculum 2013 has been applied
to the unit education level. The implementation of
curriculum 2013 is inseparable from the eight
national education standards that must be achieved.
The standard becomes the reference in conducting
management of education in the education unit level.
The reference used in the education management
is Government Regulation of Indonesian republic No.
19 of 2005 about national education standards (The
Ministry of National Education, 2003). In article 4 of
the regulation states that national education standard
is the tool to guarantee the quality of educational
services. Standard contents include educational
standards, processes, workforce, facilities and
infrastructure, management, evaluation, financing,
and the competence of graduates.
SMA Negeri 2 Surakarta is one of the schools
implementing Curriculum 2013 since academic year
2013/2014. Based on the observations conducted by
the researchers, SMAN 2 Surakarta conducted
management of education in accordance with the
92
Setiawan, A., Martono, T. and Gunarhadi, G.
The Implementation of Curriculum: A Case Study.
In Proceedings of the 2nd International Conference on Economic Education and Entrepreneurship (ICEEE 2017), pages 92-100
ISBN: 978-989-758-308-7
Copyright © 2017 by SCITEPRESS – Science and Technology Publications, Lda. All rights reserved

directives of the Central Government based on the
curriculum 2013. At the beginning of the
implementation of Curriculum 2013, there was an
issue related to fulfillment in eight national education
standards. It was because of a lack of understanding
about the rules of the conduct of school education in
the standards. Based on the problem faced, the
stakeholders continue to make the improvement at
SMA Negeri 2 Surakarta. Through this process, the
researchers are interested in conducting research to
find out the extent to which the implementation of
eight national education standards at SMAN 2
Surakarta.
2 LITERATURE REVIEW
2.1 Curriculum 2013
Moss & Harvie (2015: 260) that point out in classical
definitions of curriculum that are the only meanings
used by school leaders itself, teachers and policy
makers. Meanwhile, Bussmaker, Trokanas dan
Franjo (2017: 3) said that the knowledge required on
the curriculum is vast and it is not practical for
teachers to retain as the curricula which are also
evolving. Curriculum 2013 is a competency-based
curriculum to design or to anticipate the needs of the
21st-century competencies. The curriculum 2013 aim
is to produce people in Indonesia who are productive,
creative, and effective through a strengthening of the
attitudes, skills, and knowledge that integrated
(Mulyasa, 2014: 65).
According to Permendikbud No. 70 of 2013,
curriculum 2013 includes basic of the framework in a
cornerstone of philosophical, theoretical foundation,
and juridical foundation. The philosophical
foundation of curriculum development in
determining the quality of learners, sources and
curriculum content of the curriculum, the learning
process, learners, assessment of learning outcomes,
relationships and community learners with the
surrounding natural environment.
Juridical Foundation curriculum 2013 is the
constitution of the Republic of Indonesia in 1945, Act
No. 20 of 2003, Act No. 17, Government Regulation
number 19 in 2005 about National Education
Standards as amended by government regulation
Number 32 2013 about changes to the Government
Regulation number 19 in 2005 about national
education standards and the presidential instruction
No. 1 of 2010.
2.2 National Education Standards
Implementation of curriculum 2013 is based on SNP
which stands for Standar Nasional Pendidikan. It is
designed to achieve learning objectives effectively
and efficiently. Drucker (2011:44) suggests that
effectiveness is the foundation of success, is
concerned with doing and then Robbins & Coulter
(2009) assert that effectively is often described as
doing the right things, that is, doing those work
activities that will help the organization reach its goal,
meanwhile efficiency refers to getting the most output
from the least amount of inputs, it's doing often doing
things right.
Linked with the implementation of eight national
education standards, schools should use the resources
properly to achieve the goal of education in the
national education standards. SNP includes eight
standards. The standards are the competence of
graduates, content, process, educators and
educational personnel, infrastructure, management,
financing and assessment of education
2.2.1 Standard competence of graduates
The guidelines of standard competence of graduates
in Regulation of Government with number 19 of 2005
Paragraph 1 is used as the assessment in the
determination of the graduation of students from the
educational unit. Paragraph 2 of the standard
competence of graduates who referred to in paragraph
1 include the competence for all subjects. Standard of
graduates competence based on the Government
Regulation number 19 of 2005 is the criteria
concerning the qualification of graduates that
includes attitudes, knowledge, and skills.
2.2.2 Standard Contents
The guidelines of standard contents in article 5 the
Government Regulation number 19 of 2005
paragraph 1 covers the scope of material and level of
competence to achieve competence of graduates on
the level and type of education. Content standards as
referred to in paragraph 1 contain the basic
framework and the structure of the learning
curriculum, curriculum unit level of education and the
education calendar (Poerwati & Amri, 2013:279).
The Implementation of Curriculum: A Case Study
93

2.2.3 Standard Process
Standard process guidelines in article 5 the
Government Regulation number 19 of 2005
paragraph 1 clarifies that learning process is
conducted in interactive, inspiring, fun, challenging,
and motivating. It provides enough room for
initiative, creativity, and independence depending on
interest, talent, and development of learners (Sanjaya,
2006). The curriculum is a process of education.
Laxman (2013:53) describes as the hallmark of a
progressive curriculum: the learner is the starting
point, the center and the end
2.2.4 Standard of educators and
Educational Personnel
Guidelines for standard of educators and educational
Personnel in Government Regulation number 19 of
2005 article 28 paragraph 1 states that the educator
must have an academic qualification and competence
as an agent of learning, healthy in physical and
spiritual as well as have the ability to realize the goal
of national education (Poerwati & Amri, 2013:279).
2.2.5 Standard facilities and infrastructure
Standard facilities and infrastructure are the criteria
of learning space, libraries, places of worship,
laboratory, play and learning resources which support
the learning process (Mulyasa, 2014:28). Guidelines
for standard facilities and infrastructure on
Government Regulation number 19 of 2005 article 42
paragraph 1 Includes each unit of compulsory
education has meaning and function. It includes
furniture, equipment, education, media education,
textbooks, and other learning resources.
Then, paragraph 2 says that the infrastructure such
as area, classrooms, education, space unit leadership
educators, administrative spaces, a library, a
laboratory, a workshop, a production unit, canteen,
power installations and services, sport venues, and
other places are required to support the learning
process that is sustainable.
2.2.6 Standard Management
Standard guidelines for management in the
Government Regulation number 19 of 2005 article 49
paragraph 1 includes that the implementation of
school-based management demonstrated by
independence, partnership, participation, openness,
and accountability. Standard management is divided
into three parts by the standard education monitoring,
standard of management by local government and
government management standard (Poerwati & Amri,
2013:280).
2.2.7 Standard Financing
The standard of education is financing criteria
regarding the components and the magnitude of the
operational costs of education in a year (Mulyasa,
2014:31). Standard guidelines for financing in the
Government Regulation number 19 of 2005 Article
62 paragraph 1 consist of the investment, operating
costs and the cost of the personal. Standard financing
is used to meet the needs of budgeting and consuming
in the activities of learning.
2.2.8 Standard of Educational Assessment
Appraiser education primary and secondary
education level consist of the assessment of learning
result by educators, assessment of learning results by
education and assessment of learning outcomes by the
Government (Poerwati & Amri, 2013:280). The
guidelines of the educational assessment standardized
level of primary and secondary education in
Government Regulation number 19 of 2005 article 63
paragraph 1 that consists of: a) learning outcomes
assessment of learners, b) study assessment by a unit
of education and c) study assessment by Government.
3 METHODS
This research method is a qualitative by using case-
studies. Case Study is the qualitative strategy in
which the researchers
explores a program in depth,
event, activity, process, or one or more individuals.
Case studies focus on collecting information
about a specific object, event or activity, then the
behind a case study is that in order to obtain the clear
picture of a problem one must examine the real-life
situation from various angles and perspective using
multiple methods of data collection (Sekaran &
Bougie, 2013: 103). Qualitative data analysis stage
includes data reduction, data display, and drawing
conclusions (Miles and Huberman, 1994).
The research of using primary data is obtained by
having interviews with vice principal, students, and
teachers and by collecting secondary data from
documents. The analyzing data is using triangulation
techniques of the sources. The location of this
research is SMA Negeri 2 Surakarta. This research
was carried out in February 2016. Analysis of data is
nonstatic because the shape of the descriptive data is
ICEEE 2017 - 2nd International Conference on Economic Education and Entrepreneurship
94
obtained. Researchers describe the data obtained from
the informants and the documents of the school itself.
4 RESULTS AND DISCUSSION
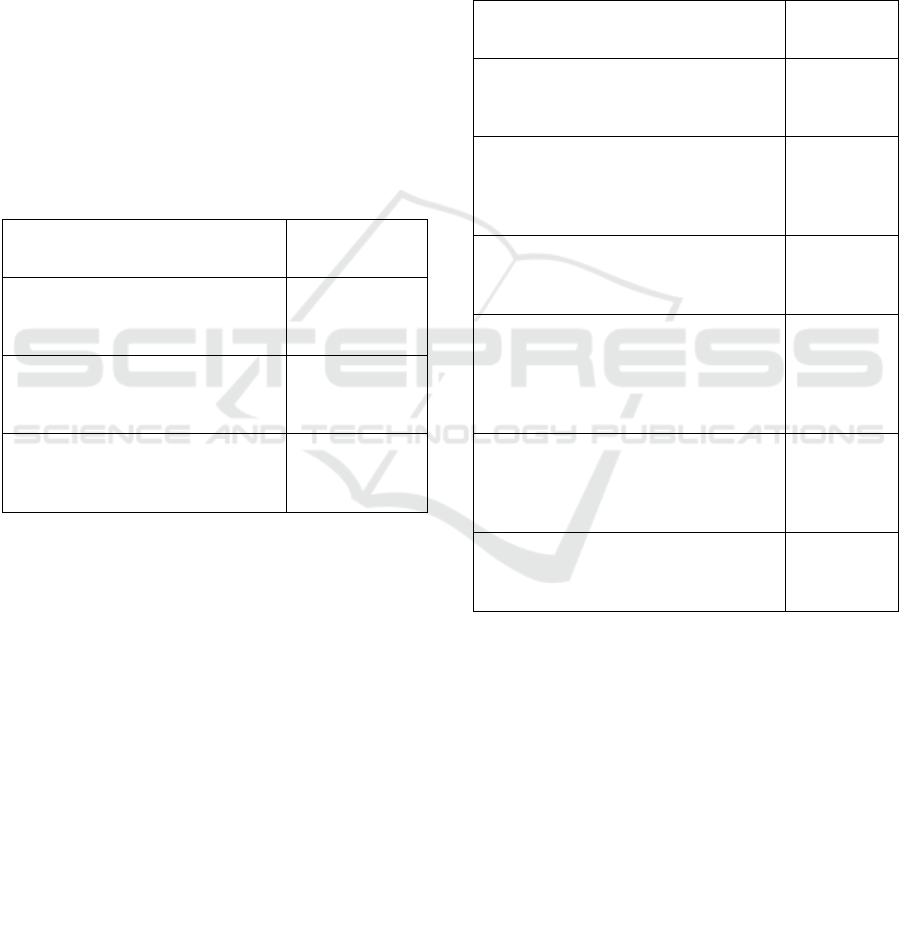
4.1 Standard Contents
The implementation of standard contents that view of
some indicators of the result of the implementation
itself. Table 1 shows the average of the result of
standard contents is 91.67%. The average obtained
from the standard implementation result percentage
content through a standard indicator of the content
that is appropriate and relevant curriculum which
already amounting is 83.33% and the school provides
the learner in personal development needs is 100%.
Table 1: The result of the success in implementation of
standard content
Components Percentage
T
he curriculum is in compliance and
r
elevant
83.33
Schools on providing the personal
d
evelopment of learners' needs
100.00
T
he average of the success in standard
i
mplementation content
91.67
Based on the percentage of the success can be
noted that the implementation of the standard content
is already good, it just needs to be improved so that
the result can continue to rise up. One of the needs to
be improved is curriculum development. According
to Madus & Kellaghan (2012) assert that the
curriculum is a total business school to achieve the
desired the success of the school and the community.
4.2 Standard Process
The implementation result of the process in the
standard by viewing some of the indicators. Table 2
shows the result's average of the standard process is
85%. The average obtained from the standard
implementation process percentage of the result
through the standard process of indicators including
the syllabus is already applicable to the standard up to
100%, the design of the lesson plan (RPP) is designed
to achieve the effective learning and tailored to the
needs of learners is 87.50%, learning resources can be
obtained easily and used appropriately is 87.50%, the
study was carried out by using methods that are
interactive, inspiring, fun, creative, challenging, and
motivating the learners is 75%, supervision and
evaluation of the learning process is carried out
periodically and sustainable is 75%.
Table 2: The result of the success in implementation of
standard process
Components Percentage
The syllabus is already applicable to the
standar
d
100
L
esson plan (RPP) was designed to
achieve effective learning and tailored to
t
he needs of learners
87.50
L
earning resources can be obtained easily
and used appropriately
87.50
L
earning is implemented by using a
m
ethod that is interactive, inspiring, fun,
creative, challenging and motivating
learners
75.00
Supervision and evaluation of the learning
p
rocess is carried out periodically and
sustainable
75.00
The average of the success in
implementation standard process
85.00
It needs to be improved in lesson plan design of
the implementation which is in accordance with
characteristics of learners. The standard process is
very influenced by seven standards (Sanjaya, 2006)
which are reinforced the results of the research,
meanwhile, Dominggus & Papilaya (2014) assert that
the process of learning with regarding learners that
connected to mentors and facilitators that associated
with improved quality of education efforts.
4.3 Standard Competence of Graduates
The result of the implementation in graduates’
standard competence is seen from several success
indicators. Table 3 shows that the average standard of
The Implementation of Curriculum: A Case Study
95
competence and show the standard competency’s
average in graduates is 87.50%. The average is
obtained from the standard implementation
percentage of result the competence of graduates
through a standard indicator in competency
graduates. These indicators the learners can achieve
academic targets expected is 91.67% and learners can
develop their full potential as members of society is
83.33%.
Table 3: The result of the success in implementation of
graduate competency standard
Components Percentage
Students can achieve the academic
targets are expected
91.67
Learners can develop their full potential
as members of society
83.33
The average of the success in
implementation standard competence of
graduates
87.50
Needing for a sustainable development of the
school to obtain a quality graduate and as expected.
Qualified graduates who will produce a good
environment. The purpose of the environment has
become an integral part of the procurement in
sustainable development (Preuss, 2007; Walker and
Brammer, 2009). SMAN 2 Surakarta students also
showed increased knowledge through learning in
school.
4.4 Standard of educators and
Educational Personnel
The result of the implementation of a standard of
educators and educational personnel are viewed from
several success indicators. Table 4 shows the average
of the result of educators and educational personnel
standard is 79.17%. The average is obtained from the
standard implementation success percentage of
educators and educational personnel through an
indicator that is the fulfillment of a number of
produce educators and educators already adequately
is 87.5%, the qualifications of educators and
educational personnel are already adequately is 75%
and the competence of educators and educational
personnel already adequately is 75%.
Table 4: The result of the success in implementation of
standard educators and educational personnel
Components Percentage
A
number of produce educators and
educational personnel are already adequate
87.50
The qualifications of educators and
educational personnel are already adequate
75.00
The competence of educators and
educational personnel are already adequate
75.00
The average of the success in
implementation standard of educators and
educational personnel
79.17
The number of public and private teachers in the
whole of Indonesia who has a diploma degree as
much as 1,710,299 or 62.32%, the number of teachers
who are certified nationwide by as much as 1,168,405
or 45.27% whereas 1,575,974 or 57.43% has not been
certified (Indardjo,2014). While the result of UKG in
Central Java in 2015 of 59.10 above an average of 55
Government-defined (Kemdikbud.go.id).
These have been indicated that the educators in
Central Java are already quite good, including in the
city of Surakarta. Then, the research is described on
which is mentioned by Rosdiana (2013) that the
competence of teachers and teaching commitments
take effect simultaneously against of the learning
effectiveness is 4.87%. The most important points is
the professional teacher. The challenges that come
with any collaboration among professionals of
disparate fields (Miller, 2010; Hardesty, 1995).
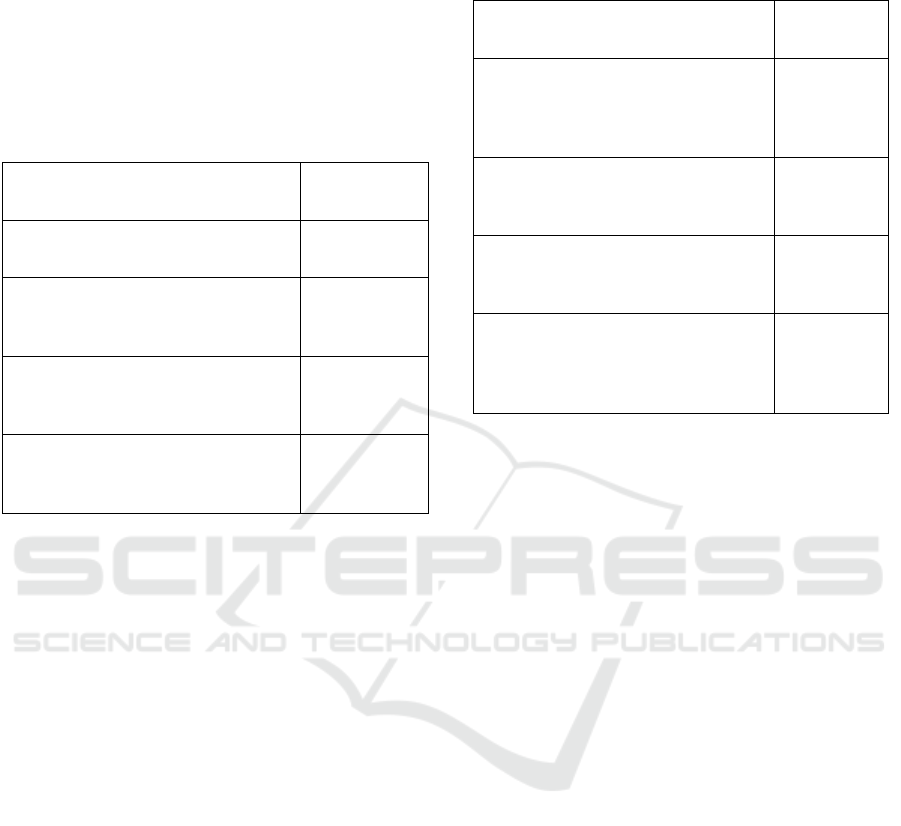
4.5 Standard facilities and infrastructure
The result of standard facilities on implementation
and infrastructure are viewed some of the indicators
of the success itself. Table 5 shows the average
success of standard facilities and infrastructure is
83.33%. The average percentage of success is
obtained from implementation standard facilities and
infrastructure through an indicator that is already
sufficient by schools means is 91.67% and the school
in good condition that well maintained is 75%.
ICEEE 2017 - 2nd International Conference on Economic Education and Entrepreneurship
96
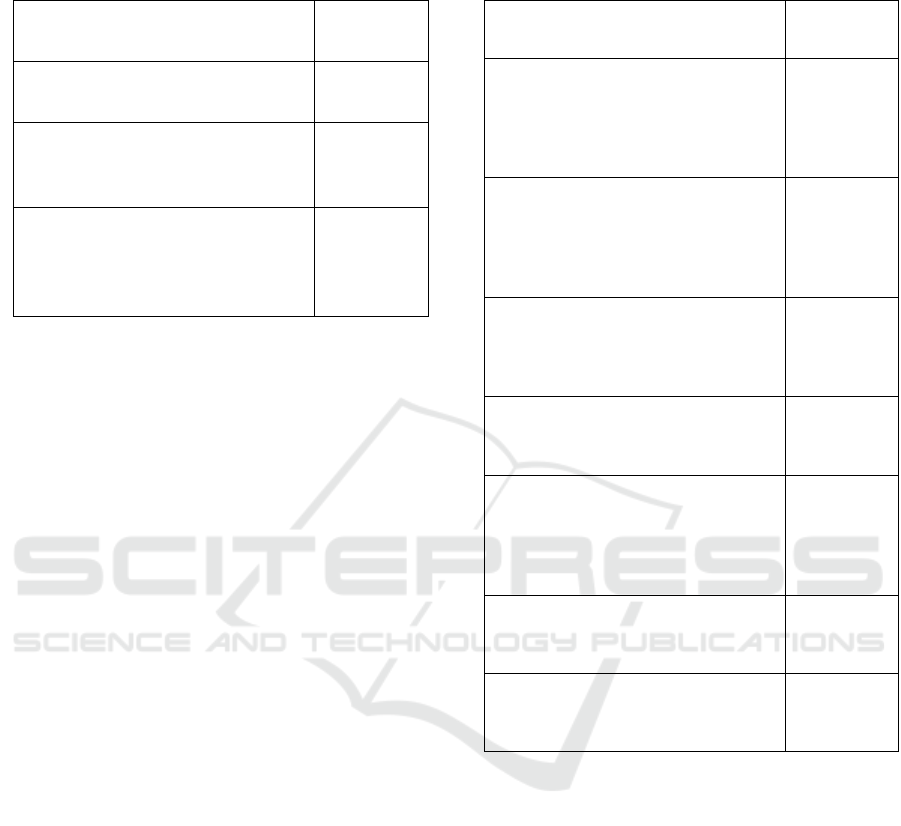
Table 5: The result of the success in implementation of
standard facilities and infrastructure
Components Percentage
school facilities are already adequate 91.67
Schools in good condition and well
maintained
75.00
The average of the success in
implementation standards facilities and
infrastructure
83.33
The facilities and infrastructure at SMA Negeri 2
Surakarta belong to either. SMA Negeri 2 Surakarta
has 33 classrooms, 6 space laboratories and also as a
library with good condition. Educational facilities and
infrastructure development are improved by the
students' learning outcomes, for which the school is
obligated to maintain and developed quality and
quantity of facilities and infrastructure of the school
itself.
4.6 Standard Management
The result of the implementation of standard
management that views some success indicators.
Table 6 shows the average standard of managing
success is 78.47%. The average is obtained from the
standard management of implementation percentage
of success through the indicators' success, namely
school performance management based on teamwork
and a strong partnership with a clear vision and
mission are known by all parties is 87%, the school's
work plan outlines are clear goals for the program
increased and sustainable improvements to the
socialized well is 75%, the school's development
plan/work plan schools affect the improvement of the
learning results that up to 83.33%, the collection and
use of reliable and valid data is gotten is 75%, the
grant of support and professional development
opportunities for educators and educational power is
75%, and the community took part in school’s
activities is 75%.
Table 6: The result of the success in implementation of
standard management
Components Percentage
Performance management school
based on teamwork and a strong
partnership with a clear vision and
mission and are known by all parties
87.50
School’s work plan outlines clear goals
for continuous improvement and
enhancement program that socialized
well
75.00
School’s development on plan/work or
Schools affect the improvement of the
learning results
83.30
Collection and use of reliable and valid
data
75.00
The granting of support and
professional development
opportunities for educators and
educational personnel
75.00
The community took part in school
activities
75.00
The average of success in standard
implementation management
78.47
The headmaster of SMAN 2 Surakarta as a major
policy makers in the school that should be able to
improve the school management, based on the
research of Diana (2009) explains that leadership of
the principal effect directly against the working in
environment is 35%, leadership of the headmaster
that conditioned directly by influence the motivation
of teachers’ working is 17.5%. Thus, the leadership
of the headmaster is very instrumental in achieving
effective and efficient management.
4.7 Standard Financing
The result of implementation in standard financing is
seen from some success indicators. Table 7 shows the
average standard of success financing is 79.86%. The
average percentage of success is obtained from the
The Implementation of Curriculum: A Case Study
97
implementation of financing through standard
indicators of success. These indicators of the school
financial planning standard are 81.25%, the efforts of
schools to get additional support from other financing
is 83.33%, the school guarantees equality of access is
75%.
Table 7: The result of the success in implementation of
standard financing
Components Percentage
School financial planning standard 81.25%
The school's efforts to get additional
support from another financing
83.33%
The school guarantees equality of
access
75.00%
The average of the success in
implementation standard Financing
79.86%
School financing is should be managed well, it is
the same with the results of the research of Fuller &
Clarke (Triwiyanto, 2013) that says that the cost of
education per student, a comparison of the number of
students and teachers, textbooks and other
educational facilities effects to student achievement
in developing countries. Then corroborated by the
research of Fattah (2002) is concluded the influential
education costs significantly to the quality of the
processes and outcomes of learning.
4.8 Standard of Educational Assessment
Educational assessment of the success in standards
implementation is seen from some success indicators.
Table 8 shows the average standard of education
assessment of success is 77.08%. The average
percentage of success is obtained from the
implementation of the standard of education through
assessment indicators. These indicators are the
scoring system was devised to assess the learners well
in academics and non-academics is 81.25%,
assessment of the impact on the learning process is
75% and the parents of the learners involved in the
learning process of their children is 75%.
Table 8: The result of the success in implementation of
standard educational assessment
Components Percentage
The scoring system was devised to
assess the learners well in academics
and non-academics
81.25
Assessment of the impact on the
learning process
75.00
Parents of students involved in their
children's learning process
75.00
The average of the success in
implementation standard educational
assessment
77.08
Cameron & Gronlund (Macmath, Wallace & Chi,
2009:454) Recognizing that assessment is an
important means for affecting instruction, not simply
reporting student progress, is pivotal to advancing
student success and understand. The educational
assessment must be done well to gain qualified of the
graduates.
4.9 The Implementation of Eight National
Education Standards
Successful implementation of eight national
education standards can be seen from the evaluation
of the implementation in education. Figure 1
illustrates the percentage of the result of
implementation in eight national education standards
at SMA Negeri 2 Surakarta. The result of standard
contents is 91.67%, process standards is 85%, the
standards of graduates competence is 87.5%, standard
educator and educational personnel is 79.17%,
standards facilities and infrastructure is 83.33%,
standard management is 78.47%, standard financing
is 79.86%, and standard educational assessment is
77.08%.
ICEEE 2017 - 2nd International Conference on Economic Education and Entrepreneurship
98
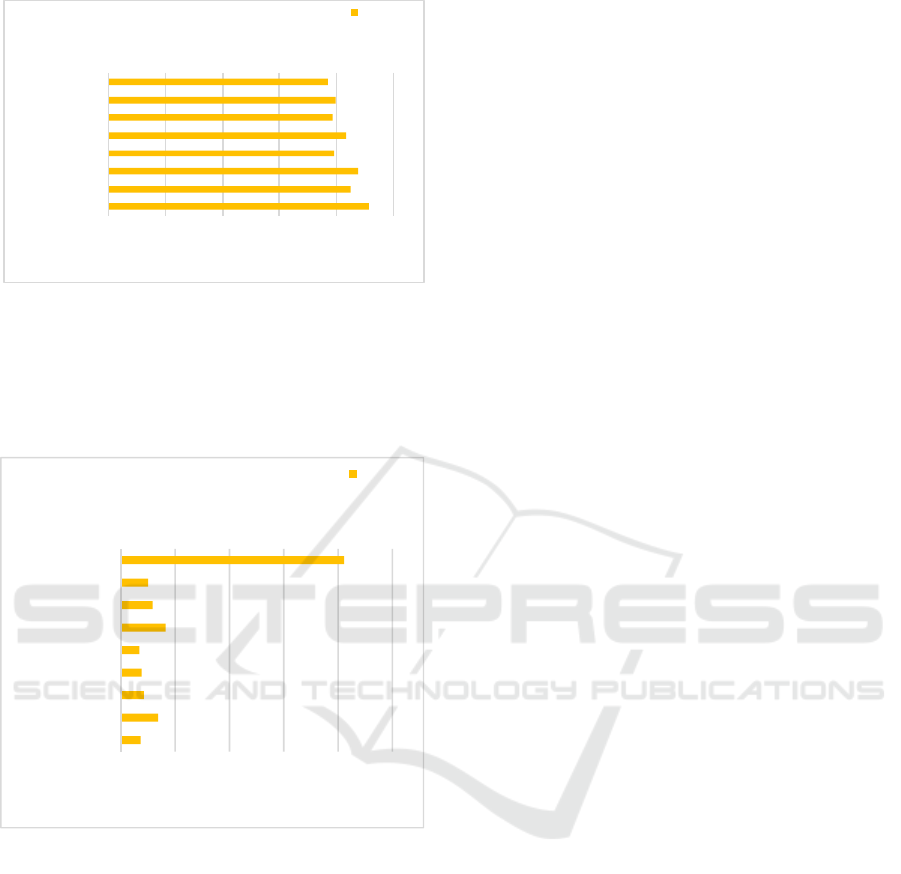
Figure 1: The Implementation of Eight National
Education Standards
Then Figure 2 depicts the success percentage
score school self-evaluation.
Figure 2: Percentage of achieved score in self-
evaluation
Based on the results of school's evaluation,
obtained the percentage of the result by giving the
score that school self-evaluation is 82.26%, the
percentage of other standard contents is 7.26%,
process standards is 13.71%, standards of graduates
the competence is 8.47%, educators and educational
personnel standards is 7.66%, standards facilities and
infrastructure is 6.85%, standard management is
16.53%, standard financing is 11.69% and standards
educational assessment is 10.08%.
5 CONCLUSIONS
The success of national education standards at SMA
Negeri 2 Surakarta can be pointed out that the
implementation of standards is best shown in the
contents of the implementation standard is 91.67%,
standards of graduates competence is 87.5%, standard
process is 85%, standard facilities and infrastructure
is 83.33%, standard implementation that still low are
financing standards is 79%, educators and
educational personnel standards is 79.17%, standard
management is 78.47% and standards educational
assessment is 77.08%. The success of the score
obtained standard contents is 7.26%, standard
graduates competence is 8.47%, standard process is
13.71%, standard facilities and infrastructure is
6.85%, standard financing is 11.69%, standard of
educators and educational personnel is 7.66%,
standard management is 16.53% and standard of
educational assessment is 10.08%. From these data
can be shown that the implementation of the National
education standard has not been fullest and needs to
be improved. This can improve school performance
in implementing the SNP by producing good
graduates.
Increased implementation of curriculum
2013 there should be a strong integration between
principals, teachers, students and the community as
well as increase the motivation to develop an identity
that is good for school (Cassidy, 2000). A perception
exists, however, that a larger percentage of middle
schools have implemented integrated curricula than
have other types of schools Arredondo & Rucinski
(1998:287). Build technological literacy, which
technologies best support student learning. (Mackey
and Jacobson, 2005; Donaldson, 2000). As well as
build skills of pedagogy of teachers, one of the most
important problems is the pedagogy of teachers (Sult
and Mills, 2006; Artman, 2010; Gandhi, 2005).
ACKNOWLEDGEMENTS
Special thanks to Dr. Dewi Kusuma Wardani for her
help and cooperation during my research. I am
especially grateful for SMAN 2 Surakarta has granted
permission to conduct research. Finally, I am
indebted to my parents, my lovely brothers for their
continuous support and encouragement for my
pursuit.
7,26
13,71
8,47
7,66
6,85
16,53
11,69
10,08
82,26
0 20406080100
Content
Process
Competency
Edu. & Edu Pers.
Facil. & Infras.
Manage.
Financ.
Asses.
Tot
Percentage achieved score school self
-evaluation
Percent.
91.67
85
87.5
79.17
83.33
78.47
79.86
77.08
0 20406080100
Con ten t
Process
Competency
Edu. & Ed u Pers.
Facil. & Infras.
Manage.
Financ.
Asses.
The Implementation of Ei ght National
Standards of Education
Av erage
The Implementation of Curriculum: A Case Study
99

REFERENCES
Arredondo, D. E & Rucinski, T. T. 1998. Principal
perceptions and beliefs about integrated curriculum use.
Journal of Educational Administration, 36 (3): 286 –
298.
Artman, M., Frisicaro-Pawlowski, E. and Monge, R. 2010.
Not just one shot: extending the dialogue about
information literacy in composition classes”,
Composition Studies, 38(2): 93-109.
Bussmaker, M., Trokanas, N., dan Franjo. 2017. An
Ontological Approach to Chemical Engineering
Curriculum Development. Computers and Chemical
Engineering: 1-21
Cassidy, T. 2000. Social background, achievement
motivation, optimism and health: a longitudinal study.
Counseling Psychology Quarterly, 13: (4) 399-412
Diana, N. 2009. Pengaruh Kepemimpinan, Lingkungan
Kerja dan Motivasi Kerja Terhadap Kepuasan Kerja
Guru. Jurnal Pendidikan dan Kebudayaan, 15(4): 684-
705.
Dominggus, E. & Papilaya. 2014. Analisis Mutu Proses
Pembelajaran pada Jenjang Sekolah Dasar dan
Menengah di Kabupaten Seram Bagian Barat. Jurnal
Penelitian Kebijakan Pendidikan. 7(3): 325-338.
Donaldson, K.A. 2000. Library research success: designing
an online tutorial to teach information literacy skills to
first-year students, The Internet and Higher Education,
2(4):237-251.
Drucker, P. F. 2011. Management: Tasks, Responsibilities,
Practices. New York: Routledge.
Fattah, N. 2002. Ekonomi dan Pembiayaan Pendidikan.
Bandung: Remaja Rosdakarya.
Gandhi, S. 2005. Faculty-librarian collaboration to assess
the effectiveness of a five-session library instruction
model. Community and Junior College Libraries,
12(4): 15-48
Hardesty, L. 1995, “Faculty culture and bibliographic
instruction: an exploratory analysis, Library Trends,
44(2): 339-367.
Indardjo. 2014. Telaah Profil Profesionalitas Guru
Indonesia. Jurnal Data dan Statistik Pendidikan. 2(1):
70-80.
Ingley, D. E. C. 2016. Higher education curriculum for
sustainability Course contents analyses of purchasing
and supply management programme of polytechnics in
Ghana. International Journal of Sustainability in
Higher Education, 17 (2): 269 – 280.
Laxman, K. 2013. Infusing inquiry-based learning skills in
curriculum implementation. International Journal for
Lesson and Learning Studies, 2 (1): 41 – 55.
MacMath, S., Wallace, J. & Chi, X. 2009. Curriculum
Integration: Opportunities to Maximize Assessment as,
of, and for Learning. Journal of education, 44 (3): 451-
466
Madus, G. E., & Kellaghan, T. 2012. Curriculum
evaluation and assessment in Jackson, P. M. (Edit,
1992). Handbook of research on curriculum. New
York: McMillan Publishing Company.
Mackey, T.P. and Jacobson, T.E. 2005. Information
literacy: a collaborative endeavor. College Teaching
,
53 (4): 140-144.
Miles, M. B., & Huberman, A. M. 1994. Qualitative data
analysis: An expanded sourcebook (2nd ed.). Thousand
Oaks, CA: Sage
Miller, I. R. 2010. Turning the tables: a faculty-centered
approach to integrating information literacy. Reference
Services Review, 38 (4): 647-662.
Moss, J. & Harvie, K. 2015. Cross-Curriculum Design:
Enacting. Inclusive Pedagogy and Curriculum.
Inclusive Pedagogy across the Curriculum, (7): 259 –
279.
Mulyasa, E. 2014. Pengembangan dan Implementasi
Kurikulum 2013: Perubahan dan Pengembangan
Kurikulum 2013 Merupakan Persoalan Penting dan
Genting. Bandung: Remaja Rosdakarya.
Poerwati, L. E. & Amri, S. 2013. Panduan Memahami
Kurikulum 2013. Jakarta: Prestasi Pustaka.
Preuss, L. 2007. Buying into our future: sustainability
initiatives in local government procurement. Business
Strategy and the Environment, 16 (1): 354-365.
Robins, S.P. & Coulter, M. 2009. Management, Tenth
Edition. London: Pearson Education ltd.
Rosdiana, D. 2013. Pengaruh Kompetensi Guru Dan
Komitmen Mengajar Terhadap Efektivitas Proses
Pembelajaran Serta Implikasinya Pada Hasil Belajar
Siswa Dalam Mata Pelajaran Ekonomi. Jurnal
Penelitian Pendidikan. 13(2): 202-209.
Sanjaya, W. 2006. Strategi Pembelajaran: Berorientasi
Standar Proses Pendidikan. Jakarta: Kencana.
Sekaran, U & Bougie, R. 2013. Research Methods for
Business: A skill-Building Approach Sixth Edition.
West Sussex: John Willey & Sons Ltd.
Sult, L. and Mills, V. 2006. A blended method for
integrating information literacy instruction into English
composition classes, Reference Services Review, 34(3):
368-388.
Triwiyanto, T. 2013. Standar Nasional Pendidikan sebagai
Indikator Mutu Layanan Manajemen Sekolah. Jurnal
Ilmu Pendidikan, 19(2): 161-171.
Walker, H. & Brammer, S. 2009. Sustainable procurement
in the UK public sector. Supply Chain Management: An
International Journal, 14(2): 127-138.
ICEEE 2017 - 2nd International Conference on Economic Education and Entrepreneurship
100
