Does Fiscal Decentralization Affect Education Inequality?
Ady Soejoto, Dhiah Fitrayati, Muhammad Abdul Ghofur, and Lucky Rachmawati
Universitas Negeri Surabaya, Surabaya, Indonesia
Keywords: Fiscal decentralization, education inequality.
Abstract: There are no regency or city in East Java Province that have the developed and grew rapidly area category.
Based on the analysis of such data, need for more attention to fiscal decentralization and inequality of
education to see the success of economic development, not just look at the economic growth. The aim of
this study is to analyze the effect of fiscal decentralization on education inequality among regency or city in
East Java Province. Data analysis techniques used panel analysis method. The result showed that fiscal
decentralization has negatively and significant effect on education inequality.
1 INTRODUCTION
Decentralization is the transfer of authority of the
government by the central government to the
autonomous regions to regulate and administer
government affairs in the system of the Unitary State
of the Republic of Indonesia (Article 1 paragraph (7)
of Law Number 32 Year 2004). Fiscal
decentralization is fundamental to the regional
autonomy system in the financial aspect. Where
fiscal decentralization is a central government's
financial transfers to sub-national governments
(Boex and Martinez-Vazquez, 2001). Fiscal
decentralization between the central government and
regional governments is done by transferring the
balance funds.
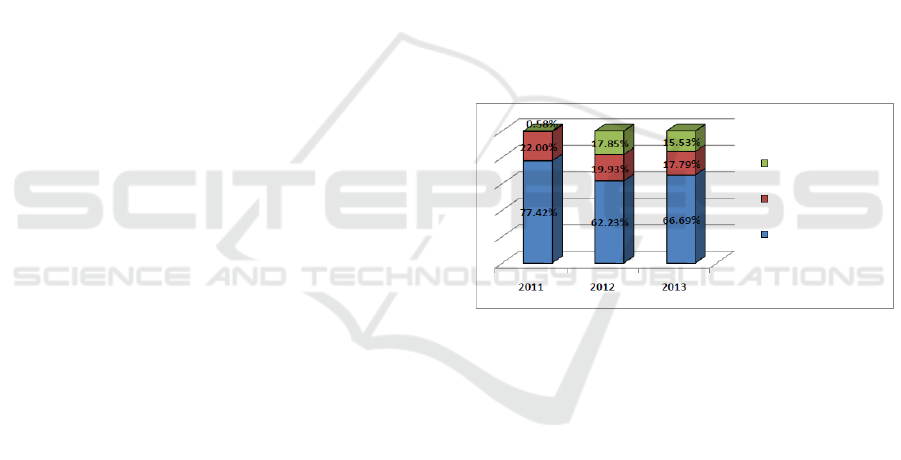
Based on data from the Revenue Service Office
of Finance and Regional Assets of East Java
Province (2013 on East Java Provincial Government,
2014), from year to year locally original revenue
became the largest contributor of revenue in East
Java Province. In 2011, locally original revenue of
East Java Province amounted to 11.49 trillion
rupiahs, increasing in 2012 by 15.4 trillion rupiah
and increasing again in the year 2013 amounted to
17.39 trillion rupiah. Similarly, the number of
Balanced Funds received, indicates an increase in
the number, but the percentage of total income
actually shows a decline. Such conditions indicate
that the ability of the Government of East Java
Province to explore its potential is very good. In
addition, it also shows the decreasing level of
dependency of East Java Provincial Government on
transfers from the Central Government to finance
their expenditure, in other words the level of
provincial independence is quite high.
Figure 1: Composition of Revenue Realization East
Java Provincial Government
Source: Revenue Service Office of Finance and Regional Assets
of East Java Province, 2013
From an economic perspective, Waluyo (2007) says
that fiscal decentralization will have an impact on
reducing income inequality between regions if the
role of local government is optimal. So the condition
of income inequality that occurred in East Java
Province which tends to increase can be resolved.
Meanwhile, in terms of non-economic, fiscal
decentralization should be able to improve the
quality of human resources area (human capital).
Soejoto et.al. (2016) suggested that education gini
index trend in East Java Education in 2011-2014
was increased. Thus illustrated on figure 2,
Other legitimate
Regional income
Balanced funds
Locally original
Revenue
30
Soejoto, A., Fitrayati, D., Ghofur, M. and Rachmawati, L.
Does Fiscal Decentralization Affect Education Inequality?.
In Proceedings of the 2nd International Conference on Economic Education and Entrepreneurship (ICEEE 2017), pages 30-35
ISBN: 978-989-758-308-7
Copyright © 2017 by SCITEPRESS – Science and Technology Publications, Lda. All rights reserved

Figure 2: Education Gini Index of East Java
Province, 2011-2014
Source: Soejoto et.al. (2016)
Pattern of regional development in East Java
Province mapped to 5 classification, among others:
1) Developed and grew rapidly (developed) area; 2)
Advanced but depressed area (stagnant); 3) Potential
areas may still be developing or (developing); 4)
Relatively lagging (underdeveloped) area; and 5)
Very underdeveloped area. The classification of the
regional development pattern was obtained by
developing the concept of Klassen Typology. The
results of the data analysis show that there are no
city/regency that are classified as developed and
grew rapidly (Soejoto et. al., 2016). The regional
development pattern of each city/regency in East
Java Province is described in Table 1.
Table 1: The Regional Development Pattern of Each
City/Regency in East Java
No.
Classificatio
n
City/Region
1.
Developed
and grew
rapidly
(developed)
area
2.
Advanced
but
depressed
area
(stagnant)
Tulungagung regency,
Kediri regency,
Banyuwangi regency,
Pasuruan regency,
Sidoarjo regency,
Mojokerto regency,
Ngawi regency,
Bojonegoro regency,
Tuban regency,
Lamongan regency,
Gresik regency,
Sumenep regency,
Surabaya City
Table 1. Cont.
3.
Potential
areas may
still be
developing
or
(developing)
Pacitan regency,
Ponorogo regency, Blitar
regency, Malang
regency, Jember regency,
Jombang regency,
Nganjuk regency, Blitar
City, Malang City,
Probolinggo City,
Madiun City, Batu City
4.
Relatively
lagging
(underdevelo
ped) area
Trenggalek regency,
Lumajang regency,
Bondowoso regency,
Situbondo regency,
Probolinggo regency,
Magetan regency,
Sampang regency,
Pamekasan regency,
Kediri City, Pasuruan
City, Mojokerto regency
5.
Very
underdevelo
ped area
Madiun regency,
Bangkalan regency
Source: Soejoto et.al. (2016)
There are no city/regency in East Java Province
that have categories of developed and grew rapidly
(developed) area, this means that although they have
economic growth or the balance funds larger than
other city/region, still have problems of income
inequality or inequality of education. There is still a
city/regency that is categorized as a very
underdeveloped area, which means that the regency
has low economic growth and low balance funds,
while the income inequality and education inequality
is high value. In fact, the balance funds aims to state
regional revenues. Thus it is necessary to pay more
attention to fiscal decentralization and educational
inequality to see the success of economic
development, not just economic growth.
The balance funds aims to increase local fiscal
capacity, reduce fiscal gap between central and
regional as well as inter-regional, improve the
quality of public services in the regency, and
increase attention to development in disadvantaged
areas, outermost and leading.
Revenue-sharing is allocated to regencies based
on State Budget of Admissions and Expenditures,
revenues to fund local needs for decentralization.
The general allocation fund is allocated to minimize
fiscal imbalances among regencies in funding
governmental affairs under regional authority. The
special allocation funds are allocated to assist
regencies in funding programs/activities that are
Does Fiscal Decentralization Affect Education Inequality?
31

under regional authority and a national priority
(Minister of Finance, 2013).
Potential resources owned by each city/regency
in East Java Province vary. Thus, the ability of each
city/regency to produce goods and services as a
source of income is also different. The economic
growth generated by the city/regency economy also
varies. Thus, the amount of balance funds received
each city/regency is expected to support the
city/regency that can still generate low income or
low economic growth. In the long term, the balance
funds are expected to make the community welfare.
The welfare of the people is not only measured by
the increase in city/regency income or economic
growth, but also other socio-economic indicators
such as equity of income and education.
Equity of education can be supported by
government through education investment in
education expenditure function. Based on Article 31
Paragraph 4 of the 1945 Constitution of the 4th
Amendment, the state at least 20 percent of the State
Budget of Admissions and Expenditures as well as
from the Regional Budget of Admissions and
Expenditures prioritize the education budget to meet
the needs of the implementation of national
education.
Doriza et.al. (2012) suggested that the special
allocation funds for education, the special allocation
funds non education, and locally original revenue
had significant impact in reducing education access
disparity along with the wealth and regional
characteristics. Nonetheless efforts need to be done
to optimize the equalization of education access
including strengthening the provincial government
role in resources allocation and distribution of basic
education services. It means that fiscal
decentralization has negatively effect on education
inequality.
Akai et.al. (2007) suggested that financial
decentralization has effect on education. But, the
effect of financial decentralization is not clear in the
primary level. The financial decentralization is
effective in the secondary level. The paper analyses
the effect of financial decentralization by focusing
on the difference of levels of education, primary and
secondary educations.
Ahmad (2016) suggested that “different sources
of fiscal decentralization have distinct effects on
education expenditure and quality. While
subnational governments that are financed through
own-tax revenues are more likely to increase the
funds allocated to education, they also seem less
concerned with maintaining teaching quality. The
study provides evidence that decentralized structures
cater better to local social needs. Fiscal
decentralization is, therefore, an important policy
instrument for achieving social goals”.
Bakti and Kodoatie (2012) had a different
opinion, they suggested that fiscal decentralization
did not have significant influence to women
education access in Special Region of Yogyakarta.
The balance funds that are transfers of funds
from the central government to the regencies are
sourced from the State Budget of Admissions and
Expenditures, not only concerning the potential
aspect of resources of each regency in generating
revenue, but also paying attention to the direction of
national priorities. This means that the use of the
balance funds is not only intended to meet the needs
of the city/regency in running its economy, but also
to support national priorities allocated in special
allocation funds. This national priority, during the
era of President Jokowi's administration is contained
in the Economic Policy Package.
Besides influenced by national priorities, the
amount of the received funds is also influenced by
regional needs as stated in the regional development
Work Plan. According to regional development Plan
of East Java Province 2016 (East Java Provincial
Government, 2015), it is mentioned that the priority
and direction of spatial development policy of East
Java Province in 2014-2019 is directed at
consolidation of urban National Centre of Activities
as metropolitan in East Java Province, Activities of
Territory, and increasing the linkage of the main
production pockets in East Java Province with the
processing and marketing centre as the core of
agropolitan system development as well as
stabilizing the development of strategic area by
dividing the strategic role of regional development.
The focus is on areas that functionally can contribute
to economic growth for the strategic regency and the
surrounding area.
The aim of this study is to analyze the effect of
fiscal decentralization on education inequality
among regency or city in East Java Province.
2 METHODS
This type of research is an explanatory research
using quantitative method used to test and analyze
the effect of fiscal decentralization on education
inequality between city/regency in East Java
Province. Data analysis techniques used panel
analysis method.
Fiscal decentralization is a balance of funds
consisting of revenue-sharing funds derived from
ICEEE 2017 - 2nd International Conference on Economic Education and Entrepreneurship
32
taxes and natural resources, general allocation funds
and special allocation funds each city/regency in
East Java Province.
Inequality of education is a problem of inequality
of education in an area by using gini index education
indicators. Gini index of education is measured by
using population based on education graduate in
city/regency of East Java Province. The index of
education has a value ranging from 0 (indicating
perfect equity) and 1 (indicates inequality perfect).
The calculation of educational index directly using
the following formula (Thomas, et al, 2000).
Gini index of education:
Where:
: The educational index is based on
the distribution of school attainment
: Average length of schooling from
population
and : the proportion of the population with
a definite level of school attainment
and : years of schooling at different levels
of educational attainment
: The number of categories of school
attainment in the data
The criteria of inequality used in the Education Gini
Index follow Todaro (2010) as follows: very high
inequality area (0.71 and above); high inequality
area (0,5-0,70); moderate inequality area (0.36-
0.49); low inequality area (0.21-0.35); very low
inequality areas (Less than 0.20).
2.1 Econometric Model
The effect of fiscal decentralization on education
inequality is investigated by employing the
following model:
fiscal
r,t
= b
0
+ b
1
eduine
r,t
+ e
1r,t
Where fiscalr,t is fiscal decentralization of
city/regency r at time t; eduiner, t is the education
gini index of city/regency r at time t; b0 is the
constanta; b1 is the regression coefficient of
education gini index variables; and e1r,t is the error
term.
3 RESULTS AND DISCUSSION
This study was conducted to examine whether there
is any effect of fiscal decentralization on education
inequality. The proof is done using panel analysis
method. The result of data analysis of 38
cities/regencies in East Java Province is shown in
Table 2.
Table 2: Results of the Data
Dependent Variable:
EDUINE?
Method: Pooled EGLS (Cross-section random effects)
Sample: 2008 2014 observations: 7 Cross-sections: 38
Total pool (balanced) observations: 266
Swamy and Arora estimator of component variances
White cross-section standard errors & covariance (d.f. corrected)
Variable
Coefficient
Std.
Error
t-
Statistic
Prob.
C
0.3299
0.0269
12.2498
0.0000
FISCAL?
-2.850E-11
0.0000
-2.4927
0.0133
Random Effects (Cross)
_1--C
-0.0091
_14--C
0.0110
_27--C
0.1915
_2--C
0.0211
_15--C
-0.0862
_28--C
0.0776
_3--C
-0.0400
_16--C
-0.0347
_29--C
0.1326
_4--C
-0.0348
_17--C
-0.0285
_30--C
-0.0958
_5--C
-0.0145
_18--C
-0.0087
_31--C
-0.0895
_6--C
-0.0135
_19--C
0.0028
_32--C
-0.0840
_7--C
0.0222
_20--C
-0.0183
_33--C
-0.0309
_8--C
0.0288
_21--C
0.0389
_34--C
-0.0599
_9--C
0.0776
_22--C
0.0360
_35--C
-0.1019
_10--C
0.0250
_23--C
0.0258
_36--C
-0.1136
_11--C
0.0701
_24--C
0.0127
_37--C
-0.0717
_12--C
0.0884
_25--C
-0.0482
_38--C
-0.0617
_13--C
0.0555
_26--C
0.1279
_27--C
0.1915
Effects Specification
S.
Rho
Cross-section random
0.068086
0.9491
Idiosyncratic random
0.01577
0.0509
Weighted Statistics
R-squared
0.084705
Mean dependent var
0.0268
Adjusted R-squared
0.081238
S.D. dependent var
0.0165
S.E. of regression
0.015842
Sum squared resid
0.0663
F-statistic
24.43151
Durbin-Watson stat
1.4013
Does Fiscal Decentralization Affect Education Inequality?
33

Table 2. Cont.
Prob(F-statistic)
0.000001
Unweighted Statistics
R-squared
-0.047166
Mean
dependent var
0.3069
Sum squared resid
1.34395
Durbin-Watson
stat
0.0691
Based on the results of the data in Table 2, the
calculated p value (t statistics) of 0.0013 is less than
the critical p value, the null hypothesis is rejected. It
can be concluded that the hypothesis related to the
effect of fiscal decentralization on education
inequality raised in this study is acceptable. Fiscal
decentralization negatively and significantly
affecting education inequality.
The fiscal decentralization regression coefficient
is negative and 0.0285. It can be interpreted that as
fiscal decentralization increases by one billion,
predicted education inequality will decrease by
0.0285, while other independent variables are
assumed to be constant. Similarly, when fiscal
decentralization decreases by one billion, it is
predicted that educational inequality will increase by
0.0285, while other independent variables are
assumed to be constant.
Table 3: Constants of Each City/Region
No.
City/Region
Constants
Category
1
Madiun City
0.2162
Low
2
Mojokerto City
0.2280
Low
3
Kediri City
0.2341
Low
4
Blitar City
0.2404
Low
5
Sidoarjo regency
0.2436
Low
6
Malang City
0.2459
Low
7
Surabaya City
0.2581
Low
8
Batu City
0.2682
Low
9
Pasuruan City
0.2699
Low
10
Gresik City
0.2817
Low
11
Trenggalek regency
0.2899
Low
12
Tulungagung
regency
0.2950
Low
13
Mojokerto regency
0.2951
Low
14
Probolinggo City
0.2990
Low
15
Jombang regency
0.3014
Low
16
Magetan regency
0.3116
Low
17
Blitar regency
0.3154
Low
18
Kediri regency
0.3163
Low
19
Pacitan regency
0.3208
Low
20
Nganjuk regency
0.3212
Low
21
Madiun regency
0.3327
Low
22
Pasuruan regency
0.3409
Low
23
Lamongan regency
0.3425
Low
24
Ponorogo regency
0.3510
Low
25
Malang regency
0.3521
Low
Table 3. Cont.
26
Banyuwangi regency
0.3549
Medium
27
Tuban regency
0.3557
Medium
28
Lumajang regency
0.3586
Medium
29
Bojonegoro regency
0.3658
Medium
30
Ngawi regency
0.3687
Medium
31
Probolinggo regency
0.3854
Medium
32
Bondowoso regency
0.4000
Medium
33
Pamekasan regency
0.4075
Medium
34
Jember regency
0.4075
Medium
35
Situbondo regency
0.4183
Medium
36
Bangkalan regency
0.4578
Medium
37
Sumenep regency
0.4625
Medium
38
Sampang regency
0.5214
High
Table 3 describe the constants of each
city/regency from the lowest to the highest. The
constant value of each city/regency obtained from
the data analysis using the panel analysis method
can be used to determine which city/regency have
the potential to create high educational inequality
compared to other cities/regencies, if the fiscal
decentralization variable is considered constant.
Data analysis on the effect of fiscal
decentralization on education inequality was
conducted in 38 cities/ regencies in East Java
Province from 2008 to 2014. It was found that fiscal
decentralization negatively and significantly
affecting education inequality.
The negatively effect of fiscal decentralization
on education inequality, suggesting that an increase
in fiscal decentralization will decrease education
inequality. An additional fiscal decentralization of 1
billion would reduce education inequality by 0.0285.
This study is consistent with Doriza et.al (2012),
Akai et.al. (2007) and Ahmad (2016) that fiscal
decentralization has effect on education. Contrary to
the study of Bakti and Kodoatie (2012).
The findings of the study, as well as revealing
that the city/regency government in East Java
Province still care about education. The negatively
effect of fiscal decentralization on education
inequality, also implies that there is a share of fiscal
decentralization revenues used for expenditure of
educational functions. The greater of fiscal
decentralization received can create lower education
inequality.
In addition to know the effect of fiscal
decentralization on education inequality. Based on
the results of data analysis can also be known which
cities/regencies that have the potential to create a
high education inequality than other cities/regencies,
if the variable of fiscal decentralization is considered
ICEEE 2017 - 2nd International Conference on Economic Education and Entrepreneurship
34

constant. It is based on the constant value of each
city or regency.
Based on the analysis of the constant value of
each city/region, it was found that Sampang
Regency has the highest potential to create education
inequality with a constant value of 0.5214. While
Madiun City has the lowest potential in creating
educational inequality with a constant value of
0.2162.
The value of the constant can be used by the
government to determine which regency should get
more fiscal decentralization fund. Sampang Regency
should get more attention, given its potential in
creating education inequality. It also required
assistance in the use of funds, not only related to the
amount of fiscal decentralization. Assistance of the
use of funds related to the allocation of funds,
whether the actual funds for the expenditure of
education functions used according to function and
whether the amount of funds allocated for
expenditure of education function already reflects
the mandate of Article 31 Paragraph 4 of the 1945
Constitution of the 4th Amendment.
4 CONCLUSIONS
Fiscal decentralization negatively and significantly
affecting education inequality. The findings of the
study, as well as revealing that the city/regency
government in East Java Province still care about
education. The greater of fiscal decentralization
received can create lower education inequality.
Required assistance in the use of funds, not only
related to the amount of fiscal decentralization.
Assistance of the use of funds related to the
allocation of funds, whether the actual funds for the
expenditure of education functions used according to
function and whether the amount of funds allocated
for expenditure of education function already
reflects the mandate of Article 31 Paragraph 4 of the
1945 Constitution of the 4th Amendment.
REFERENCES
Ahmad, Iftikhar. 2016. Assessing the Effects of Fiscal
Decentralization on the Education Sector: A Cross-
Country Analysis. The Lahore Journal of Economics
21 : 2 (Winter 2016): pp. 53–96.
Akai, Nobuo; Sakata, Masayo; and Tanaka, Ryuichi. 2007.
Fiscal Decentralization and Educational
Performance. Presented at the Institute of Business
and Economic Research University of California,
Berkeley, Conference Paper No. C07-001.
Bakti, Galih Pramilu and Kodoatie, Johanna Maria. 2012.
Analysis of Fiscal Decentralization Impact on Ratio of
Woman Literasi and Ratio of Woman School
Participation In Regency/City of Special Region of
Yogyakarta Province. Diponegoro Journal of
Economics, Volume 1, No. 1, 2012, pages 1-7.
Boex, Jameson and Martinez-Vazquez, Jorge. 2001.
Budgeting and Fiscal Management in Transition
Economics. Journal of Public Budgeting, Accounting
and Financial Management, 13 (3): pages 353-396.
Doriza, Shinta, Purwanto, Deniey A., and Maulida Ernita.
2012. Fiscal Decentralization Impacts on Primary
Education Access Disparities in Indonesia. Indonesian
Economic and Development Journal, Vol. 13 No. 1,
July 2012: pages 31-46, ISSN 1411-5212.
East Java Provincial Government. 2015. Attachment of
East Java Governor Regulation No.40 of 2015 on
Regional Development Work Plan of East Java Year
2016. East Java Provincial Government, East Java.
........... 2014. Middle Term Development Plan for The East
Java Province 2014 – 2019. East Java Provincial
Government, East Java.
Minister of Finance. 2013. State Budget of Admissions and
Expenditures, 2013. Minister of Finance through
www.kemenkeu.go.id.
Soejoto, Ady; Fitrayati, Dhiah; Rachmawati, Lucky; dan
Sholikah, Ni’matus. 2016. Typology of Regional
Economic Development Pattern. International Journal
of Applied Business and Economic Research
(IJABER). Vol.14 No.13, July December 2016 ISSN:
0972-7302., Page 9493-9505.
Todaro, Michael dan Stephen C Smith. Economic
Development: Eleventh Edition. 2011. Jakarta:
Erlangga Publisher.
Thomas, Vinod, Yan, Wang, Xibo, Fan. 2000.
“Measuring Education Inequality: Gini Coefficients of
Education”. Policy Research Working Paper, World
Bank Institute.
Waluyo. 2007. Public Management. Concept, Application
& Implementation In Implementation of Regional
Autonomy. Bandung: Mandar Maju Publisher.
Does Fiscal Decentralization Affect Education Inequality?
35
