
A Clustering based Prediction Scheme for High Utility Itemsets
Piyush Lakhawat, Mayank Mishra and Arun Somani
Department of Electrical and Computer Engineering, Iowa State University, Ames, Iowa, 50011 U.S.A.
Keywords:
High Utility Itemset Mining, Clustering, Itemset Prediction.
Abstract:
We strongly believe that the current Utility Itemset Mining (UIM) problem model can be extended with a
key modeling capability of predicting future itemsets based on prior knowledge of clusters in the dataset.
Information in transactions fairly representative of a cluster type is more a characteristic of the cluster type
than the the entire data. Subjecting such transactions to the common threshold in the UIM problem leads to
information loss. We identify that an implicit use of the cluster structure of data in the UIM problem model
will address this limitation. We achieve this by introducing a new clustering based utility in the definition of
the UIM problem model and modifying the definitions of absolute utilities based on it. This enhances the UIM
model by including a predictive aspect to it, thereby enabling the cluster specific patterns to emerge while still
mining the inter-cluster patterns. By performing experiments on two real data sets we are able to verify that
our proposed predictive UIM problem model extracts more useful information than the current UIM model
with high accuracy.
1 INTRODUCTION AND
MOTIVATION
Itemset mining is an important problem in data min-
ing. The key objective in itemset mining is to identify
the frequently occurring patterns of interest in a col-
lection of data objects. Itemset mining is among the
areas of data mining which have received high inter-
est in the last decade (Liao et al., 2012). There are
two primary reasons for these developments. First,
there is a primary need to extract highly repetitive
patterns from data in many data mining applications.
Second, data mining problems from various domains
can be easily modelled as an itemset mining prob-
lem. As a result, various application areas like mar-
ket basket analysis (Ngai et al., 2009), bioinformatics
(Alves et al., 2009; Naulaerts et al., 2015), website
click stream analysis (Ahmed et al., 2009; Li et al.,
2008) etc. have witnessed significant use of itemset
mining techniques.
The first model (Agrawal et al., 1994) of item-
set mining problem was based on identifying patterns
solely on their occurrence frequency. However, a
subsequent model emerged (Chan et al., 2003; Liu
et al., 2005; Tseng et al., 2010; Tseng et al., 2015)
in which utility values were assigned to the data ele-
ments based on their relative importance in the anal-
ysis. The pattern identification criterion in this new
model is a combination of occurrence frequency and
utility value. In this work, we enhance the effective-
ness of the Utility Itemset Mining model by adding
a prediction aspect to it. Having reasonably accu-
rate knowledge of possible future itemsets is of im-
mense value in all applications of Utility Itemset Min-
ing where data is scarce or dynamic in nature and
where discovery of knowledge sooner and with lesser
amount of data adds much more value to them.The
key intuition for this work arises from the existence
and knowledge of clusters present in the data. In this
work, we show that prior knowledge of the clusters
present in the data has high potential to guide the fu-
ture itemsets discovery.
Building on this idea we propose a prediction
scheme for high utility itemsets which captures fre-
quency, utility and cluster structure information to
predict the possible future itemsets with high accu-
racy. Experiments shows that we are able predict
a good number of future itemsets with high accu-
racy over the baseline scheme. While Utility Item-
set Mining is not a machine learning problem, but if
it were then our contribution would be analogous to
the Bayesian version of this problem with the cluster
structure acting as the Prior.
Before going into mathematical details of the
scheme, we first illustrate the key idea of our work
with a small example along with how our contribution
adds to the existing itemset mining framework. Item-
set mining originated as a formal problem called as
Lakhawat P., Mishra M. and Somani A.
A Clustering based Prediction Scheme for High Utility Itemsets.
DOI: 10.5220/0006590001230134
In Proceedings of the 9th International Joint Conference on Knowledge Discovery, Knowledge Engineering and Knowledge Management (KDIR 2017), pages 123-134
ISBN: 978-989-758-271-4
Copyright
c
2017 by SCITEPRESS – Science and Technology Publications, Lda. All rights reserved
Frequent Itemset Mining (FIM) from the market bas-
ket analysis domain (Agrawal et al., 1994). In FIM,
data objects are called transactions. Each transaction
contains a set of items along with a transaction ID.
Set of items in a transaction are a subset of global set
of item types. An itemset is defined as a set of one or
more item types. The goal of FIM is to find all item-
sets which are present in more than a fixed number
(say Φ) of transactions.
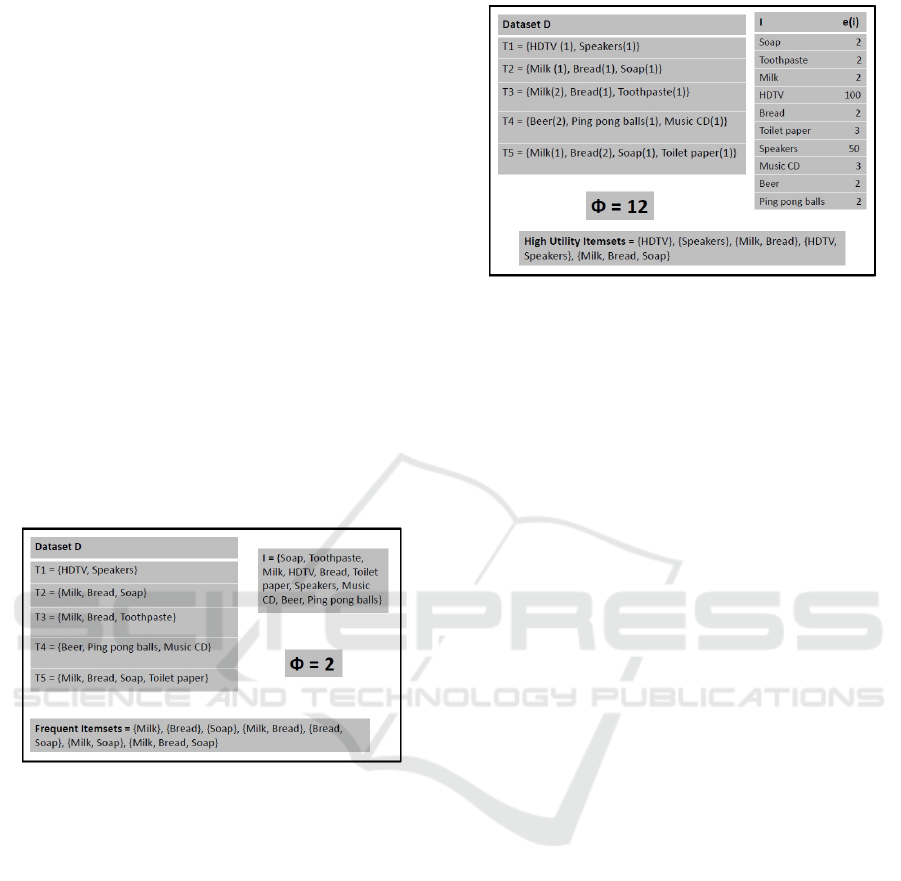
For illustration, consider a small example of FIM
is presented in Figure 1. Dataset D represents a set of
transactions from a retail store. Set I represents vari-
ous item types. The set of Frequent Itemsets contains
all itemsets which are present in two or more (as Φ =
2) transactions in the dataset D. In real world scenar-
ios when the threshold values (Φ) are large, a frequent
itemset of type (A, B) leads to an example associa-
tion rule of type A → B. The practical implication of
such an association rule depends on the application
domain. In market basket analysis it can imply a cus-
tomer buying item A is likely to buy item B as well,
so A and B should be advertised together.
Figure 1: Frequent Itemset Mining.
FIM problem lacks the ability model the relative
importance of various item types. For example in Fig-
ure 1, above a HDTV and a pack of soap have the
same unit of importance. While in reality the profit
yield of a unit sale of a HDTV is expected to be much
more than that of soap. For a frequency threshold
of two, the HDTV and Speakers could not make it
to the list of frequent itemsets. Another limitation
of FIM is the inability to model the occurrence fre-
quency of items in a particular transaction. For exam-
ple, it is possible that in transaction T2 from Figure
1 the customer bought one pack of bread, while in
transaction T3 customer bought two packs of bread.
The FIM problem model is unable to differentiate be-
tween these. To overcome these limitations Utility
Itemset Mining (UIM) emerged as an evolved version
of FIM.
The UIM version of the problem from Figure 1 is
presented in Figure 2. In Figure 2, next to items in the
Figure 2: Utility Itemset Mining.
transactions, the parenthesis contain occurrence fre-
quency for the item in that particular transaction. The
right side of Figure 2 lists various item types. e(i) rep-
resents the relative importance of each item type i. In
this case they can be interpreted as the profit associ-
ated with the unit sale of that item. The profit asso-
ciated with an itemset (referred to as absolute utility
of the itemset) is the calculated as the sum of profit
made by that itemset in all transactions it occurs in.
For example, the itemset (milk, Bread) occurs in T2
(profit made = 1 x Milk + 1 x Bread = 4), T3 (profit
made = 2 x Milk + 1 x Bread = 6) and T5 (profit made
= 1 x Milk + 2 x Bread = 6). Therefore the absolute
utility of itemset (Milk, Bread) will be 4 + 6 + 6 = 16.
The threshold (Φ) for UIM is a combination criterion
of frequency and utility/importance. For the problem
in Figure 2, the set of High Utility Itemsets contain all
itemsets with absolute utility more than 12 (Φ).
We strongly believe that the UIM problem model
can be further extended to add a prediction aspect to
it. Let us consider the example in Figure 2. Suppose
we have reasonable confidence that the customer for
transaction T4 is a college student. Then the informa-
tion present in T4 is more representative of a customer
class of college students than the entire customer pop-
ulation. Leveraging this knowledge can help us pre-
dict a latent behavior of college students if present in
the data. While ignoring this knowledge leads to in-
formation loss due to generalization. This motivated
us to investigate ways for leveraging the knowledge
of clusters present in data in current UIM model.
1.1 Motivation for a Prediction Enabled
UIM Model
Datasets which can be modeled as transactional data
have frequently occurring (repeating) patterns of in-
terest in them. This is the key information which
itemset mining techniques strive to extract from these
datasets. For example, in retail transactions datasets
this information means items which are frequently
bought together by customers. However, on the same
transactional datasets clustering analysis is performed
to study the cluster structure of these datasets. For
retail transactions data sets this is the basis of the
customer segmentation analysis (Ngai et al., 2009),
where similar sets of transactions are clustered to-
gether to identify and study various customer types
present in the data.
Clustering of transactional type datasets is per-
formed in various biomedical applications as well.
Gene expression data is one such example data type
which is analyzed using both itemset mining (Alves
et al., 2009; Naulaerts et al., 2015) and clustering
techniques (Andreopoulos et al., 2009). This implies
that itemset mining and clustering study different as-
pects of the same data set. While itemset mining ab-
stracts the dataset in form of itemsets, clustering ab-
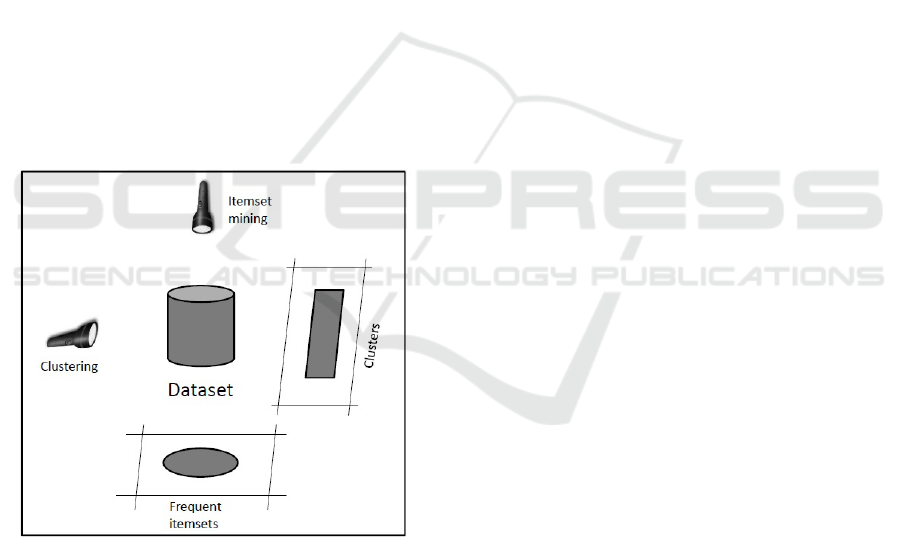
stracts it in form of clusters of transactions. Fig-
ure 3 presents an illustration of the above idea. If
we imagine the dataset to be a solid cylinder, then a
top/plan view (corresponding to itemset mining) will
show a circle (correspondingly itemsets). While a
side/elevation view (corresponding to clustering) will
show a rectangle (correspondingly clusters).
Figure 3: Illustration of different abstractions of dataset.
Performing clustering or itemset mining analysis
while ignoring the other creates a handicap as we
do not use all available information fully. Recent
transactional data clustering techniques are starting to
adapt to this fact. For example, a recent transactional
clustering algorithm proposed in (Yan et al., 2010) in-
troduces the idea of weighted coverage density. Cov-
erage density is a metric of cluster quality which is
used to guide clustering algorithms. Recognizing the
fact that frequently occurring patterns are a key char-
acteristic of transactional data, the authors in (Yan
et al., 2010) assign weights to items in the coverage
density function based on their occurrence frequency.
This leads to clusters which are more practically use-
ful. There are two issues if we consider the current
UIM problem model and the clustering problem:
1. If we divide the entire set of transactions into clus-
ters and perform itemset mining in each cluster
separately, we might miss an inter-cluster pattern.
2. If we perform itemset mining in the whole dataset
disregarding clustering, a pattern highly specific
to a cluster might be missed due to no support
from any other cluster.
This directs to us that we need to somehow implicitly
use knowledge the cluster structure while performing
itemset mining.
1.2 Need to implicitly use the Cluster
Structure
An implicit use of cluster structure of data in item-
set mining can potentially address these issues. The
knowledge of cluster structure can help identify trans-
actions which are highly representative of a cluster
type. The cluster types usually represent some real
world entity (for example type of customer). The in-
formation in these special transactions is more char-
acteristic of their cluster type than the entire data.
Therefore subjecting these transactions to the com-
mon threshold in the UIM problem is not appropriate.
To overcome this problem, we conclude that some
extra importance must be provided to these special
transactions. We do this by introducing a new cluster-
ing based utility in the definition of the UIM problem
model. The modified UIM problem model enables
the cluster specific patterns to emerge while still min-
ing the inter-cluster patterns. In essence, we develop
a mechanism to enhance the importance (utility) of
certain transactions which translates into inflation in
utility of certain itemsets. Those itemsets which are
enough inflated to cross the threshold will constitute
the predictions. This modification in the model can
integrate into all UIM techniques as it does not affect
the itemset mining part of the techniques.
Revisiting the example in Figure 2, the new pre-
dictive UIM model gives extra importance/utility to
the items in transaction T4 by identifying it as a spe-
cial transaction (representative of a college student).
Let us assume that the Music CD bought by this col-
lege student is of a current hit album. Then the pat-
tern of this Music CD bought along with typical col-
lege student items is likely to repeat. This will lead
to eventual discovery of this Music CD as high util-
ity item. The predictive UIM model will facilitate a

sooner (using less data) discovery of such items.
In rest of the paper, we first discuss the key works
done on the itemset mining problem. Then we for-
mally describe the itemset mining problem followed
by the definition of our new clustering based utility to
extend the UIM model. We then have a discussion on
the use clustering algorithm followed by the experi-
ments on to real data sets before we conclude.
2 RELATED WORK
The problem of itemset mining was first introduced
by Agrawal et al in (Agrawal et al., 1994) as fre-
quent itemset mining in context of market basket anal-
ysis. They introduced the idea of a downward clo-
sure property for generating the potential (candidate)
frequent itemsets of size k using the already discov-
ered frequent itemsets of size k-1. This is also pop-
ularly known as the apriori technique. This helped
to substantially reduce the search space for the fre-
quent itemsets. Building up on this idea many sub-
sequent works extended it by introducing sampling
techniques (Toivonen et al., 1996), dynamic itemset
counting (Brin et al., 1997), parallel implementations
(Agrawal and Shafer, 1996) etc.
A limitation of ”apriori” logic based techniques is
that sometimes they can generate a large number of
candidate itemsets. Since each candidate itemset re-
quires a scan over the entire dataset it also slows the
mining process significantly. A popular technique to
overcome this issue has been proposed in (Han et al.,
2000) called FP-Growth. It performs itemset min-
ing by generating a tree structure rather than candi-
date generation. There are also techniques proposed
which mine the dataset in vertical format (that is list
items with sets of transactions) rather than the tra-
ditional horizontal format (list of transactions with
items). One such work is propose by Zaki in (Zaki,
2000).
Frequent itemset mining lacked important mod-
eling capabilities like relative importance of various
items (called utility) and the frequency of an item in
a particular transaction, leading to the emergence of
utility itemset mining in (Chan et al., 2003; Liu et al.,
2005; Tseng et al., 2010; Tseng et al., 2015) among
others, where itemsets are mined on the basis of utility
support in the dataset rather than frequency support.
This makes the problem model more realistic and of
higher practical value.
The downward closure property for candidate
generation does not apply directly for utility mining.
This led to the idea of a transaction weighted utility,
which enabled the apriori type candidate generation
again. This was the basis of the initial work done in
utility mining with subsequent techniques proposed
on various strategies for pruning the search space.
The problem of candidate set explosion is also
present in these works due to the use of ”apriori”
logic. To counter this (Tseng et al., 2010) proposes
a tree based model called UP-Growth for Utility min-
ing which traverses the dataset only twice.
Recently in (Tseng et al., 2015) authors proposed
Utility mining algorithms which use a closed set rep-
resentation for itemsets which is very concise and yet
shows competing performance.
3 ITEMSET MINING PROBLEM
MODEL
In this section we formally define the itemset min-
ing problem. We first define the problem of Fre-
quent itemset mining (FIM) followed by Utility item-
set mining (UIM).
I = {a
1
, a
2
, .. . , a
M
} = Set of distinct item types (1)
D = {T
1
, T
2
, . . . , T
N
} = Transaction dataset (2)
where each T
i
= {x
1
, x
2
, . . .}, x
k
∈ I
itemset(X) of size k = {x
1
, x
2
, . . . , x
k
} (3)
SC(X) = |{T
i
such that X ∈ T
i
∧ T
i
∈ D}| (4)
Frequent itemsets = {X such that SC(X) ≥ Φ} (5)
As mentioned earlier, FIM lacks two key modelling
capabilities. It cannot model difference in relative im-
portance of various item types and the frequency of an
item type in a transaction. UIM overcomes these lim-
itations. UIM problem builds up on the FIM problem
with additional information of external and internal
utilities for items. External utility is a measure of unit
importance of an item type. This is a transaction inde-
pendent utility. Internal utility is a transaction specific
utility. This is typically the frequency or some mea-
sure of quantity of an item in the transaction.
eu(a
i
) = external utility of item type a
i
(6)
iu(a
i
, T
j
) = internal utility of a
i
in T
j
(7)
The absolute utility of an item in a transaction is de-
fined as the product of its internal and external utility.
au(a
i
, T
j
) = eu(a
i
) ∗ iu(a
i
, T
j
) (8)
Absolute utility of an itemset in a transaction is the
sum of absolute utilities of its constituent items.
au(X, T
j
) =
∑
x
i
∈X
au(x
i
, T
j
) (9)

Absolute utility of a transaction (also called transac-
tion utility) is the sum of absolute utilities of all its
constituent items.
TU(T
j
) =
∑
x
i
∈T
j
au(x
i
, T
j
) (10)
Absolute utility of an itemset in the dataset D is the
sum of absolute of that itemset in all transactions that
it occurs in.
au(X, D) =
∑
X∈T
j
∧T
j
∈D
au(X, T
j
) (11)
The set of HUI is the collection of all itemsets which
have absolute utility more than or equal to in the
dataset D.
set of HUI = {X s.t. au(X, D) ≥ Φ} (12)
The following three concepts are used in the solu-
tion techniques of UIM to achieve a downward clo-
sure property for efficient candidate generation simi-
lar to the FIM problem: Transaction weighted utility
(TWU) of itemset X in dataset D is the sum of trans-
action utilities of transactions in which the itemset X
occurs.
TWU(X, D) =
∑
X∈T
j
∧T
j
∈D
TU(T
j
) (13)
Set of high transaction weighted utility itemsets
(HTWUI) is a collection of all itemsets which have
transaction weighted utility more than or equal to Φ
in the dataset D.
Set of HTWUI = {X s.t. TWU(X) ≥ Φ} (14)
TWDC property ((Tseng et al., 2015; Liu et al.,
2005)):”The transaction-weighted downward closure
property states that for any itemset X that is not a
HTWUI, all its supersets are low utility itemsets.”
The goal of UIM is to find the set of all high utility
itemsets for a given Φ. Here threshold Φ is a combi-
nation criterion of utility and frequency rather than a
solely frequency based one in FIM. Figure 2 shows a
small example illustrating UIM. The iu (internal util-
ity) values for all items are written in parenthesis next
to it in the example.
4 A NOVEL CLUSTER BASED
UTILITY TO ENHANCE THE
UIM MODEL
We discussed in the first section that the goal is to
extend the current UIM problem model to add pre-
diction capability to it by implicitly using the cluster
structure of data in itemset mining. Certain transac-
tions are more representative of a cluster type over
others. The information in these special transactions
is more characteristic of their cluster type than the en-
tire data. Therefore we do not wish to subject these
transactions to the common threshold in the UIM
problem. To overcome this problem, we develop a
mechanism to attach extra utility to these transactions.
We do this by introducing a new clustering based util-
ity in the definition of the UIM problem model. This
addition translates into predicting capability of the
UIM model.
We define this new utility by calling it cluster util-
ity of a transaction (and the items in it). This is a
transaction specific utility for items and is same for
all items in a transaction. We introduce following two
new concepts in the UIM model before we define the
cluster utility.
C as the set of all given clusters. Each cluster is
defined as: C
j
= {T
1
, T
2
, . . .}. Cluster C
j
is a subset of
transactions from D.
We also introduce an affinity metric which repre-
sents the degree of similarity between a cluster C
j
and
a transaction T
i
.
a f f inity(T
i
,C
j
) = similarity b/wT
i
and C
j
(15)
These additions to the UIM problem model as-
sume that a fairly accurate cluster structure is given
and an appropriate affinity metric is provided. The
accuracy here defines an attribute that a cluster struc-
ture which portrays the characteristics (repetitive pat-
terns) of interest in the dataset. By appropriateness of
the affinity metric we mean a metric which captures
the type of similarity (based on constituent items) be-
tween a cluster and a transaction that is of interest
in the analysis. These assumptions are fairly rea-
sonable as there is a large body of work directed to-
wards of categorical (transactional) clustering. These
clustering techniques define subsets of transactions as
clusters in the same way as we define them in our
predictive UIM problem model. Use of some ver-
sion of a similarity metric is common for these tech-
niques (Huang, 1998; Guha et al., 1999; Chen and
Liu, 2005). The affinity metrics used in them can be
used in our extended UIM problem model by inter-
preting a transaction as single element cluster.
cu(a, T
i
) = 1 + k ∗ max{a f f inity(T
i
,C
j
)∀C
j
∈ C}
(16)
In equation 16, k is a tunable parameter and de-
cides how aggressively the cluster information is used
in the predictive UIM. Note that the cluster utility is
same for all items in a transaction. The rationale be-
hind this definition is to decide the cluster utility of a

transaction based on the cluster which is most similar
to it.
We integrate this new internal utility in the calcu-
lation of the absolute utilities. The new definition of
absolute utility of an item a in a transaction T
i
is given
by the following:
au(a, T
i
) = eu(a) ∗ iu(a, T
i
) ∗ cu(a, T
i
) (17)
This implicitly changes the definitions of
au(X, T
i
), TU(T
i
), TWU(X, D), Set of HTWUI,
au(X, D) and the set of HUI. All techniques for UIM
use the absolute utilities as the building blocks to
search for high utility itemsets (Chan et al., 2003; Liu
et al., 2005; Tseng et al., 2010; Tseng et al., 2015),
so this enhanced predictive UIM problem model will
integrate into all of them.
4.1 Impacts of the Enhanced Predictive
UIM Problem Model
The following are the impacts of making the above
updates to the current UIM model.
1. Assuming that the affinity function to have range
[0, 1]. The cluster utility of any item will fall in
range [1, 1+k]. Cluster utility closer to 1 will im-
ply their respective transaction to be almost non-
representative of any given cluster type. Higher
values will imply more similarity of their respec-
tive transaction with some given cluster.
2. Since the new definition of absolute utility of an
item in a transaction is the product of cluster util-
ity, internal utility and external utility, all absolute
utilities will either increase or remain same in the
new predictive model.
3. For the same threshold Φ, the predictve model
will always find equal or more number of HUI
than the current model. Also the set of HUI found
by the current model will always a subset of the
HUI found by the predictive model.
4. Higher values of parameter k will aggressively
use the cluster information and therefore produce
more number of HUI. This is recommended when
additional emphasis on cluster specific patterns is
required.
5. The additional (predicted) itemsets found should
be interpreted in the following two ways.
• When more data arrives later, the additional
itemsets found by the model at a previous time
are likely to be found in the list of HUI of the
current model at that time. The interpretation
of this is that a certain pattern(s) are present in
particular cluster(s), but with the given amount
of data they do not have enough utility support
to appear in the list of HUI of the current UIM
model. However, with the numbers accumu-
lating with time they will soon show up in the
list of HUI in the future. The predictive UIM
model recognizes them and helps them getting
discovered sooner (with fewer data).
• If the data is static (or no new data will be
available at a later point in time), the additional
HUI found in the predictive model are the ones
which missed out in the list of HUI of current
model due to being specific to only one (or very
few) cluster(s) present among many and hence
could not gather enough numbers to cross the
threshold. However such additional HUI can
have application specific importance. For ex-
ample, a purchase pattern for a specific cus-
tomer type can be used to create targeted ad-
vertisements for those customers.
6. Making this addition modifies the definition of
various absolute utilities. However, the use of ab-
solute utilities to find the set of HUI remains the
same. Therefore this new model has to ability to
be able to be integrated into all UIM techniques.
7. Each cluster in the cluster structure of the data
usually represents some real world entity. This
has the following implications.
• Once a satisfactory cluster structure is obtained
it can be reused for same type of data. This is
because the purpose of cluster structure is only
to identify if a particular transaction is fairly
representative of a cluster type. This means that
the computational expense of clustering need
not be repeated every time.
• The entire dataset might not be needed to ob-
tain an accurate cluster structure. If the size
of the dataset is much bigger compared to the
cluster structure present in it, then a randomly
sampled fraction of dataset is sufficient to cap-
ture the cluster structure.
8. The predictive model always finds equal or more
HUI than the current model, it can potentially ex-
tract the complete set of HUI based on the cur-
rent model while using fewer data. It can also find
additional useful HUIs which the current model
missed. This translates into earlier access to ac-
tionable information and access to additional use-
ful information.

5 CHOICE OF CLUSTERING
TECHNIQUE
Since the proposed predictive UIM problem model
assumes the knowledge of an accurate cluster struc-
ture and an appropriate similarity metric as discussed
in the previous section, it is important to choose a suit-
able clustering technique. There is a large body of
work directed towards clustering of categorical (trans-
actional) data. The clustering techniques return the
clusters in form of sets of transactions with similar
transactions in each set. A majority of these tech-
niques (Huang, 1998; Guha et al., 1999; Chen and
Liu, 2005) employ some similarity metric between
the clusters to guide the clustering process using divi-
sive, agglomerative or repartitioning algorithms. The
same affinity metrics can be used in the enhanced
UIM model by interpreting a transaction as single ele-
ment cluster. The choice of clustering technique used
can be subjective based on the preferences and re-
quirements of the application domain.
Review suggests that certain categorical (trans-
actional) clustering algorithms perform clustering on
the basis of frequently occurring patterns in the trans-
actions. Such schemes may be applicable when the
external utility information is not very important.
However in most real world applications, various item
types have different relative importance in the anal-
ysis. This is the reason for emergence of UIM as
an evolved version of FIM. A better suited cluster-
ing technique for use in this enhanced UIM problem
model should be based on high utility patterns in the
data rather than high frequency ones. We have devel-
oped a clustering technique which successfully cap-
tures the high utility patterns in the data (Lakhawat
et al., 2016). This clustering technique, though not
a contribution of the current work, is chosen here
due to its strong applicability. An overview of it is
provided in the Appendix at the end of the paper.
In the next section we perform experiments on two
real datasets to evaluate results of the predictive UIM
problem model.
6 EXPERIMENTS ON REAL
DATASETS
We perform an analysis of the results from the predic-
tive UIM problem model proposed here. We use two
real datasets called BMSWebView1 (obtained from
(BMSWebView1, 2016)) and Retail dataset (provided
by (Brijs et al., 1999) and obtained from (Retail-
Dataset, 2016)). BMSWebView1 is a real life dataset
of website clickstream data with 59,601 transactions
in it. Retail dataset contains 88,163 anonymized
transactions from a Belgian retail store. We randomly
generated the external utilities (between 1-50) for var-
ious item types in both the datasets by using a uniform
random number generator. It is common to gener-
ate utility values when evaluating algorithms for UIM
(Tseng et al., 2015). To obtain the cluster structure
to be used for the predictive UIM problem model,
we use the utility based categorical clustering algo-
rithm discussed earlier and in the Appendix. For find-
ing the high utility itemsets (HUIs) we implemented a
popular UIM technique called the two-phase method
(Liu et al., 2005). It essentially finds all the potential
HUI using the transaction weighted downward clo-
sure property we discussed in an earlier section and
then scans the dataset to determine the actual HUIs.
6.1 Experimental Design
We created the following experimental design to com-
pare the effectiveness of our predictive UIM problem
model with the current UIM problem model:
1. We create the following 4 versions of both the data
sets:
• Containing first 25% of the data.
• Containing first 50% of the data.
• Containing first 75% of the data.
• Containing the complete data.
We interpret the complete dataset as all the infor-
mation which future holds. The purpose of this
step is to create scenario where as more data ar-
rives with time it leads to more itemsets being dis-
covered.
2. For each of these datasets we find the set of
HUI using the current UIM model. For the retail
dataset we use Φ = 50,000 and for the BMSWe-
bView1 data set we use Φ = 20,000. The choice
of these threshold values is based on discovering
a manageable number of HUI. Higher values of Φ
lead to fewer HUI and vice versa. This step estab-
lishes the checkpoints for the itemsets discovered
by the current UIM model for each version of both
the datasets.
3. We generate two cluster structures for both the
Retail dataset and the BMSWEbView1 dataset by
using 1% and 5% of uniformly randomly sampled
data using our clustering algorithm as described
before. This step results in a total of 4 cluster
structures which will be used to model the pre-
dictive UIM problem for each version of the two
datasets. The purpose of selecting two different
fractions of datasets in clustering is to observe
their effect in the discovery of itemsets.
4. Next we assign the cluster utility to each transac-
tion and their constituent items based on the cho-
sen cluster structure. We do this assignment in a
conservative, plain or aggressive manner based on
the following criterion:
conservative k = {
0 if affinity(T
i
,C
j
)<0.25
1 otherwise
(18)
moderate k = 1 (19)
aggressive k = {
1 if affinity(T
i
,C
j
)<0.5
2 otherwise
(20)
5. After assigning the cluster utility we calculate the
new values for all absolute utilities. We then find
out the set of HUI for each of the above cases
based on our predictive UIM problem model (for
their respective values) and compare them with
the ones found when using the current UIM prob-
lem model on the same version of dataset. The
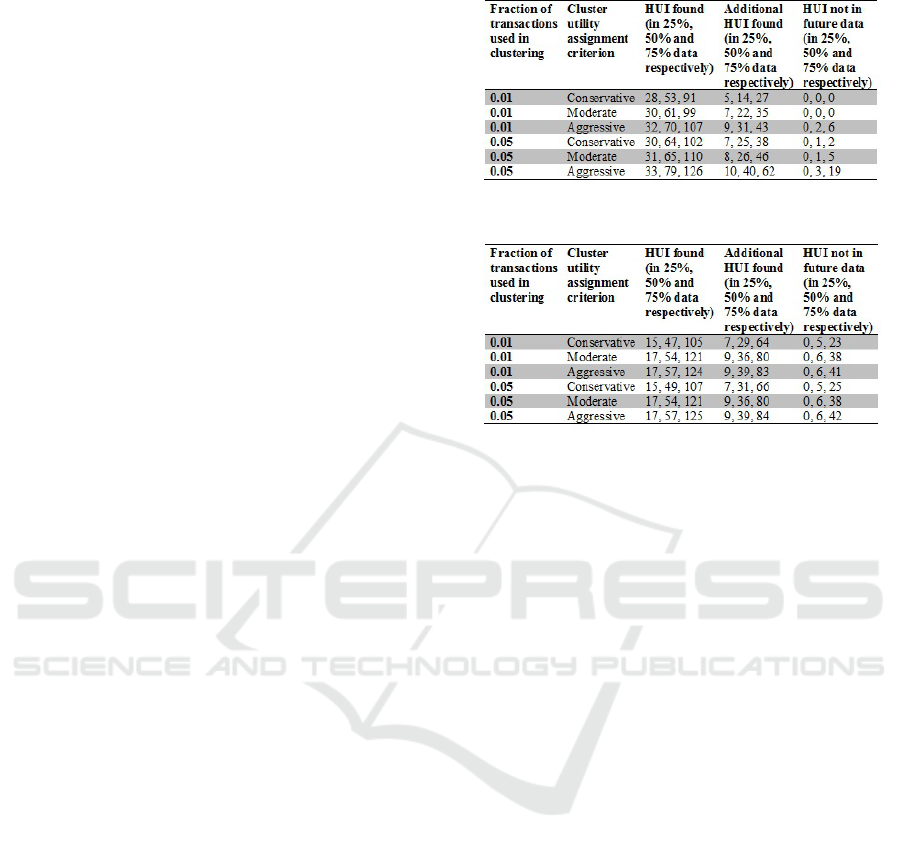
key information pieces of interest are:
• HUI Found: This is the number of HUI found
by the predictive UIM model for each version
of both datasets for the two cluster structures.
This will always be equal to or more than the
number HUI found using the current UIM prob-
lem model.
• Additional HUI Found: This is the additional
number of HUIs found by the predictive UIM
problem model over the current UIM problem
model. This is the most important information
of interest. This represents additional itemsets
the new model was able to extract using the
knowledge of cluster structure of the dataset.
• HUI not in Future Data: This is the num-
ber of HUI found by the predictive UIM prob-
lem model which are not present in the list of
HUI for the current UIM model when using
the complete dataset. The HUI in this category
represent patterns which are very cluster spe-
cific and could not find enough support from
the complete data set to cross the threshold .
While these itemsets cannot be called high util-
ity itemsets (HUI) in the conventional defini-
tion, they do have high utility with respect to
their cluster type and they might be very close
to crossing the threshold for the current UIM
problem model as well. This attribute of these
itemset makes a useful set of information.
These results from the above experiment are pre-
sented in Table 1 and Table 2.
Table 1: Experiment results: Retail dataset.
Table 2: Experiment results: BMSWebView1 dataset.
6.2 Key Inferences from the
Experimental Results
The following inferences are drawn from the obtained
results.
1. Increasing the fraction of transactions used in
clustering results in increase of number of HUI
found and additional HUI found. This is ex-
pected, as with more transactions being used in
clustering the cluster structure found is expected
to be closer to the true cluster structure of the
dataset. This results in more transactions find-
ing higher affinity values with their respective
clusters. Higher affinities imply higher cluster
based utilities, which further implies higher abso-
lute utilities for itemsets. Higher absolute utilities
mean more itemsets are likely to cross the thresh-
old Φ.
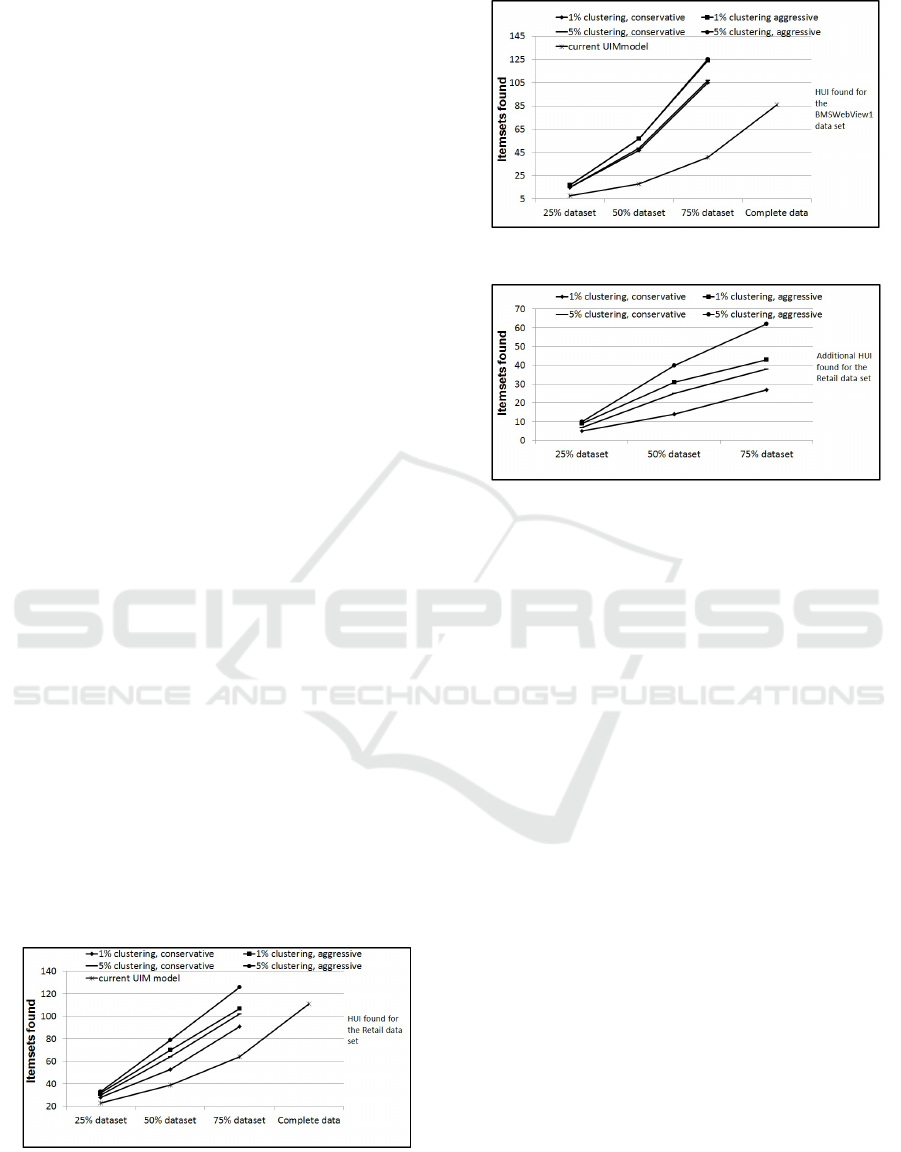
Figures 4 to 7 show the graphical illustrations.
The Y-axis shows the HUI found in Figure 4 and
Figure 5. Additional HUI found are shown on the
Y-axis in Figure 6 and 7. Four different predictive
UIM problem models are shown in these figures
based on two cluster structures and two cluster
utility assignment criterion. The X-axis for these
figures shows the dataset version used. Figure 4
and Figure 5 also shows the HUI found when us-
ing the current UIM problem model.
2. Varying the cluster utility criterion from conserva-
tive to moderate to aggressive results in increase
in the number of HUI found and additional HUI
found. This is expected, as this stepped variation
results in increase of cluster utility for the transac-
tions. Increase in cluster utility results in increase
of absolute utility for itemsets at each step. In-
crease in absolute utility for itemsets means more
itemsets are likely to cross the threshold . A graph-
ical illustration is shown in Figure 4. There are
few HUI found (for the predictive model) which
are not present in the list of HUI for the complete
data (when using the current model) for cases
of aggressive cluster utility assignment and espe-
cially when using 75% of data. This should in-
terpreted in the correct perspective. Aggressive
cluster utility assignment should be used when
the analysis is especially focused on discovering
all possible cluster specific patterns along with
the global patterns. As the current UIM problem
model completely disregards the cluster structure,
comparison with it in this case becomes less rel-
evant. Furthermore, when we use the 75% ver-
sion of the data with the predictive UIM problem
model, the complete data set is inadequate to ver-
ify the validity of the additional HUI discovered
and more data might be needed to do so.
3. The predictive UIM problem model extracts sig-
nificantly more (30% to 50% more for most cases
in our experiments when being conservative or
moderate in cluster utility assignment) actionable
information (HUI) from the data compared to the
current UIM problem model. While most of addi-
tional HUI found by the new model are found by
the current model when additional data is avail-
able, few which are not found, are also useful
itemsets. These itemsets represent patterns which
are specific to cluster types and were not discov-
ered by the current model due to the information
loss problem discussed in Section 1. Overall the
predictive UIM model leverages the knowledge
of the cluster structure while mining for itemsets
based on utility and frequency for improved infor-
mation extraction.
Figure 4: HUI found for the Retail dataset.
Figure 5: HUI found for the BMSWebView1 dataset.
Figure 6: Additinal HUI found for the Retail dataset.
6.3 A Note on Prediction Accuracy
Since we propose this new UIM model as a predictive
one, we need to address the accuracy of this predic-
tion with respect to a baseline. Since the current UIM
model does not do any prediction, it cannot be con-
sidered a baseline. As in our model we are inflating
the utility of certain transactions (and hence itemsets),
we need to establish that the decision to do it to cho-
sen transactions is better than doing sp uniformly to
all transactions. In other words, how much the ac-
curacy suffers if we were to inflate the utility of ev-
ery transaction in the data. We performed an Itemset
search by doing this (inflation by a factor of 3) and
discovered that the accuracy suffers heavily. Specifi-
cally accuracy here means how many of the predicted
itemsets (Addition HUI found) are indeed found to
be present in the future data. The inflation by factor
of 3 is a baseline for our aggressive cluster utility as-
signment. For the Retail dataset accuracy dropped to
50.2% (from 96.2%) and 24.9% (from 84.9%) when
working on 50% and 75% data respectively. While
the for the BMSWebView1 dataset it dropped to a
44.7% (from 89.5%) and 19.6% (from 66.4%) when
working on 50% and 75% data respectively. The per-
formance of our predictive model is significantly bet-
ter (refer Table 1 and Table 2) than these.
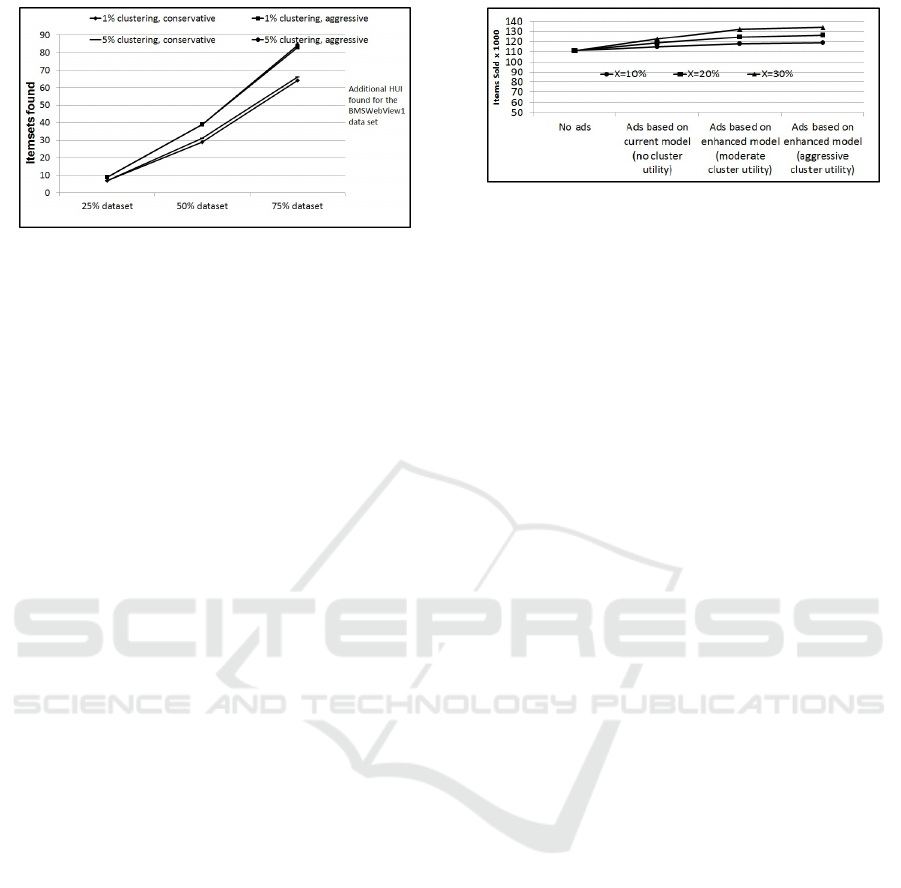
Figure 7: Additional HUI found for the BMSWebView1
dataset.
7 EXAMPLE PRACTICAL
IMPACT OF THE ENHANCED
PREDICTIVE UIM PROBLEM
MODEL
Data is used to guide forecasting, planning and de-
cision making in almost all science and business ap-
plications. Availability of actionable information is
time critical for various reasons ranging from gener-
ating more profit for businesses or early release of a
drug. Faster processing of the data is one of the ways
to achieve actionable information sooner. However
when availability of data is the bottleneck (which is
the case for many applications in present times), it is
most important to extract as much actionable informa-
tion from the data as possible. With all the data avail-
able as well it is always preferred to extract as much
useful information from it as possible. We perform an
illustrative experiment to demonstrate that the benefit
of the predictive UIM problem model.
For illustration, let us assume that for a retail store
with no advertising 1000 of items in each HUI are
sold every month. With correct advertising assume
a X % increase in the sales. By correct advertising
we mean advertising based on discovered HUI from
the data. Therefore the sales achieved by the store in
a month will be based on their choice UIM problem
model used in the analysis. For this analysis we use
50% of the Retail dataset with Φ = 50000 and 10% of
the transactions for clustering. The results are shown
in Figure 8.
8 CONCLUSION AND FUTURE
WORK
We establish that the current Utility Itemset Mining
(UIM) problem model can be extended by adding a
key modeling capability of prediction by capturing
Figure 8: Example impact of UIM model used.
cluster specific patterns in the dataset. All transac-
tions possess information in them regarding the de-
gree to which they belong to a cluster of similar ob-
jects from the entire data. If a transaction is fairly rep-
resentation of cluster type then the information in it is
more characteristic of their cluster type than the entire
data. Therefore ignoring this knowledge and subject-
ing these transactions to the common threshold in the
UIM problem leads to information loss.
We identify that an implicit use of cluster struc-
ture of data in the UIM problem model will address
the above limitation. We do this by introducing a
new clustering based utility in the definition of the
UIM problem model and modifying the definitions
of absolute utilities based on it. This modified pre-
dictive UIM problem model enables the cluster spe-
cific patterns to emerge while still mining the inter-
cluster patterns and can integrate into all UIM tech-
niques. Through performing experiments on two real
data sets we are able to verify that our proposed pre-
dictive UIM problem model extracts more useful in-
formation than the current UIM model. This enhance-
ment in the UIM problem model leads to improved
information extractions by facilitating a sooner (us-
ing less data) discovery of HUI and also discovery of
cluster specific useful patterns.
For the future work, we plan to study the impact of
our new model specific to various applications types
in further detail. We also are developing a thorough
information theoretic analysis of our model in con-
junction with various clustering and UIM techniques.
ACKNOWLEDGEMENTS
The research reported in this paper is funded in part
by Philip and Virginia Sproul Professorship Endow-
ment at Iowa State University. The research compu-
tation is supported by the HPC@ISU equipment at
Iowa State University, some of which has been pur-
chased through funding provided by NSF under MRI
grant number CNS 1229081 and CRI grant number
1205413. Any opinions, findings, and conclusions
or recommendations expressed in this material are

those of the author(s) and do not necessarily reflect
the views of the funding agencies.
REFERENCES
Agrawal, R. and Shafer, J. C. (1996). Parallel mining of
association rules. IEEE Transactions on Knowledge
& Data Engineering, (6):962–969.
Agrawal, R., Srikant, R., et al. (1994). Fast algorithms for
mining association rules. In Proc. 20th int. conf. very
large data bases, VLDB, volume 1215, pages 487–
499.
Ahmed, C. F., Tanbeer, S. K., Jeong, B.-S., and Lee, Y.-
K. (2009). Efficient tree structures for high util-
ity pattern mining in incremental databases. Knowl-
edge and Data Engineering, IEEE Transactions on,
21(12):1708–1721.
Alves, R., Rodriguez-Baena, D. S., and Aguilar-Ruiz, J. S.
(2009). Gene association analysis: a survey of
frequent pattern mining from gene expression data.
Briefings in Bioinformatics, page bbp042.
Andreopoulos, B., An, A., Wang, X., and Schroeder, M.
(2009). A roadmap of clustering algorithms: finding a
match for a biomedical application. Briefings in Bioin-
formatics, 10(3):297–314.
BMSWebView1 (2016). Smpf: An open-source
data mining library, accessed: 2016-06-14.
http://www.philippe-fournier-viger.com/spmf/index.
php?link=datasets.php.
Brijs, T., Swinnen, G., Vanhoof, K., and Wets, G. (1999).
Using association rules for product assortment deci-
sions: A case study. In Knowledge Discovery and
Data Mining, pages 254–260.
Brin, S., Motwani, R., Ullman, J. D., and Tsur, S. (1997).
Dynamic itemset counting and implication rules for
market basket data. In ACM SIGMOD Record, vol-
ume 26, pages 255–264. ACM.
Chan, R. C., Yang, Q., and Shen, Y.-D. (2003). Mining
high utility itemsets. In Data Mining, 2003. ICDM
2003. Third IEEE International Conference on, pages
19–26. IEEE.
Chen, K. and Liu, L. (2005). The” best k” for entropy-based
categorical data clustering.
Guha, S., Rastogi, R., and Shim, K. (1999). Rock: A robust
clustering algorithm for categorical attributes. In Data
Engineering, 1999. Proceedings., 15th International
Conference on, pages 512–521. IEEE.
Han, J., Pei, J., and Yin, Y. (2000). Mining frequent pat-
terns without candidate generation. In ACM Sigmod
Record, volume 29, pages 1–12. ACM.
Huang, Z. (1998). Extensions to the k-means algorithm for
clustering large data sets with categorical values. Data
mining and knowledge discovery, 2(3):283–304.
Lakhawat, P., Mishra, M., and Somani, A. K. (2016). A
novel clustering algorithm to capture utility informa-
tion in transactional data. In KDIR, pages 456–462.
Li, H.-F., Huang, H.-Y., Chen, Y.-C., Liu, Y.-J., and Lee, S.-
Y. (2008). Fast and memory efficient mining of high
utility itemsets in data streams. In Data Mining, 2008.
ICDM’08. Eighth IEEE International Conference on,
pages 881–886. IEEE.
Liao, S.-H., Chu, P.-H., and Hsiao, P.-Y. (2012). Data
mining techniques and applications–a decade review
from 2000 to 2011. Expert Systems with Applications,
39(12):11303–11311.
Liu, Y., Liao, W.-k., and Choudhary, A. (2005). A fast high
utility itemsets mining algorithm. In Proceedings of
the 1st international workshop on Utility-based data
mining, pages 90–99. ACM.
Naulaerts, S., Meysman, P., Bittremieux, W., Vu, T. N.,
Berghe, W. V., Goethals, B., and Laukens, K. (2015).
A primer to frequent itemset mining for bioinformat-
ics. Briefings in bioinformatics, 16(2):216–231.
Ngai, E. W., Xiu, L., and Chau, D. C. (2009). Application of
data mining techniques in customer relationship man-
agement: A literature review and classification. Ex-
pert systems with applications, 36(2):2592–2602.
RetailDataset (2016). Frequent itemset mining
dataset repository, accessed: 2016-06-14.
http://fimi.ua.ac.be/data/.
Toivonen, H. et al. (1996). Sampling large databases for
association rules. In VLDB, volume 96, pages 134–
145.
Tseng, V. S., Wu, C.-W., Fournier-Viger, P., and Yu, P. S.
(2015). Efficient algorithms for mining the concise
and lossless representation of high utility itemsets.
Knowledge and Data Engineering, IEEE Transactions
on, 27(3):726–739.
Tseng, V. S., Wu, C.-W., Shie, B.-E., and Yu, P. S. (2010).
Up-growth: an efficient algorithm for high utility
itemset mining. In Proceedings of the 16th ACM
SIGKDD international conference on Knowledge dis-
covery and data mining, pages 253–262. ACM.
Yan, H., Chen, K., Liu, L., and Yi, Z. (2010). Scale: a
scalable framework for efficiently clustering transac-
tional data. Data mining and knowledge Discovery,
20(1):1–27.
Zaki, M. J. (2000). Scalable algorithms for association min-
ing. Knowledge and Data Engineering, IEEE Trans-
actions on, 12(3):372–390.
APPENDIX
C is the set of all given clusters. A cluster C
k
∈ C is
essentially a subset of transactions from D.
C
k
= {T
1
, T
2
. . . T
k
|T
i
∈ D} (21)
I
C
k
= {a
i
|a
i
∈ T
j
∧ T
j
∈ C
k
} = item types in C
k
(22)
Cluster utility (CU), relative utility (ru) of a category
type in a cluster and the a f f inity between clusters
have the following definitions:
CU(C
k
) =
∑
T
j
∈C
k
TU(T
j
) = Cluster utility of C
k
(23)

Input: C ;
while max
a f f
≥ min
a f f
do
for C
i
,C
j
∈ C do
if affinity(C
i
,C
j
) > max
a f f
then
max
a f f
= affinity(C
i
,C
j
);
C
m1
= C
i
;
C
m2
= C
j
;
merge(C
m1
,C
m2
);
update relevant affinities;
for C
t
∈ C do
if
CU(C
t
)
max(CU(C
k
)∀C
k
∈C)
≤ min
uty
then
delete C
t
;
return C;
Algorithm 1: Clustering algorithm for categorical
data with utility information.
CU is an overall measure of importance of a cluster,
since it is the sum of utilities of all transactions in it.
∀a
i
∈ I
C
k
, ru(a
i
,C
k
) =
∑
a
i
∈I
C
k
∧T
j
∈C
k
au(a
i
, T
j
)
CU(C
k
)
(24)
ru is the relative importance (since utility is a unit
of importance) given to a
i
among all I
C
k
in C
k
.
For clusters C
i
and C
j
:
a f f inity(C
i
,C
j
) =
∑
a∈I
C
k
∧a∈I
C
j
min(ru(a,C
i
), ru(a,C
j
))
(25)
It is the sum of shared utility of common category
types among two clusters. min
a f f
and min
uty
are tun-
able parameters of the algorithm. min
a f f
decides the
termination criterion of the clustering and min
uty
de-
cides the final selection criterion for the clusters.
