
Predictive Model based on Sentiment Analysis for Peruvian SMEs in
the Sustainable Tourist Sector
Gianpierre Zapata
1
, Javier Murga
1
, Carlos Raymundo
1
,
Jose Alvarez
2
and Francisco Dominguez
3
1
Escuela de Ingeniería de Sistemas y Computación, Universidad Peruana
de Ciencias Aplicadas (UPC), Lima, Lima, Perú
2
Departamento de Informática, Universidad Carlos III, Getafe, Madrid, Spain
3
Facultad de Informática, Universidad Rey Juan Carlos, Mostoles, Madrid, Spain
Keywords: Sentiment Analysis, Big Data, Cloud Computing, Travel Management Process, Tourism Sector.
Abstract: In the sustainable tourist sector today, there is a wide margin of loss in small and medium-sized enterprise
(SMEs) because of a poor control in logistical expenses. In other words, acquired goods are note being sold,
a scenario which is very common in tourism SMEs. These SMEs buy a number of travel packages to big
companies and because of the lack of demand of said packages, they expire and they become an expense, not
the investment it was meant to be. To solve this problem, we propose a Predictive model based on sentiment
analysis of a social networks that will help the sales decision making. Once the data of the social network is
analyzed, we also propose a prediction model of tourist destinations, using this information as data source it
will be able to predict the tourist interest. In addition, a case study was applied to a real Peruvian tourist
enterprise showing their data before and after using the proposed model in order to validate the feasibility of
proposed model.
1 INTRODUCTION
In recent years tourism has become a powerful
transformative force that has had a decisive influence
on the lives of thousands of people. This is because it
is one of the main employment generation sectors in
the world (Scowsill, D., 2017) being the sector that
presented a growth of 3.1% in 2016, it contributes a
9.8% to the Gross Domestic Product (GDP)
worldwide. That is why the United Nations (UN;
2015) declares the year 2017 as the International Year
of Sustainable Tourism for Development, seeking to
encourage a change in policies, practices of tourism-
related businesses and to evaluate consumer behavior
in order to promote a more sustainable tourism sector.
One of the limitations of the current tourism
model is associated with the progressive growth of
productivity in the international market, facing
important challenges that emerge from the need to re-
establish its comparative advantages over other
competing destinations / countries. Faced with this
need, the search for new innovative solutions,
understood as new products, products, processes, new
marketing techniques or organizational improvement
to minimize costs and to differentiate the product of
the offered service and, ultimately, target all these
strategies to increased productivity of the system is
underway. In several tourism subsectors there is a
rapid process induction to new innovation
technologies that are changing the bases of
production and market structure. Without deviating,
the tourism sector seeks to evaluate consumer
behavior in order to be able to make decisions, so it
has taken an increased interest to exploit the countless
amount of data generated by the social networks,
where users shed their unbiased opinions of any
subject (Thomas H. Davenport, 2013).
However there are websites that try to cover the
chain value by providing services based on an
information catalog and supported by previous
opinions and experiences as seen on TripAdvisor,
Booking, HotelsCombined, Agoba, Kayak, among
others. But these platforms cannot measure the
interests of consumers and in a market where inter-
national competition is growing, a tourism forecasting
model must be able to deal with the development of
competitive advantages which will allow a better
performance to select a tourist destination.
Zapata G., Murga J., Raymundo C., Alvarez J. and Dominguez F.
Predictive Model based on Sentiment Analysis for Peruvian SMEs in the Sustainable Tourist Sector.
DOI: 10.5220/0006583302320240
In Proceedings of the 9th International Joint Conference on Knowledge Discovery, Knowledge Engineering and Knowledge Management (KMIS 2017), pages 232-240
ISBN: 978-989-758-273-8
Copyright
c
2017 by SCITEPRESS – Science and Technology Publications, Lda. All rights reserved
In this sense, we propose a tourist interest
prediction model based on the sentiment analysis of
social networks and their results. This research is
divided into the section that describes the research
that are the basis for the proposed model, modeling,
implementation results, and conclusions.
2 BACKGROUND
2.1 Sentiment Analysis
Sentiment analysis refers to the use of word
processing and analysis tools to quantify the
sentiment expressed in words. This analysis helps
discover trends and reflect the real world in social
networks (Kiran Garimella et al., 2016). It also helps
predict different topics, in this case the tourist traffic
and time series of social networks.
In order to carry out this analysis, one can proceed
in different ways, within which one is making the
analysis based on a lexicon another being the
ontological analysis (Ali Marstawi et al., 2017). In the
first type of analysis, the classification is based on the
present words and the number of occurrences, taking
into consideration the semantic orientation of the
words, which must be added to a dictionary
classifying and rating them in negative and positive,
according to their intensity level (Anna Jurek et al.,
2015). In the ontological analysis a model is
generated by classifies the feelings based on concepts
(Pratik Thakor et al., 2015).
It is clear that the sentiment analysis is a discipline
that is generating interest in the scientific community,
resources have been produced such as Word2vec
(Dongwen Zhang et al., 2015), WordNet Affect,
SentiWord Net, among others (R. Linares et al.,
2015), which allows the generation of new research
cases and then a predictive analysis to examine in this
case the tweets and be able to analyze the origin
location, if it is classified in a positive or negative
way, among others established parameters (Eric
Baucom et al., 2013).
Thus, observing case studies is revealed that this
sentiment analysis allows us to make a prediction on
a specific topic as the case of the stock market
analysis, where values can be predicted according to
consumer trends (John Kordonis et al., 2016). This
allows us to affirm that this analysis is scalable to
diverse scenarios like the tourism sector.
2.2 Prediction Model
A predictive model is a way of observing the data that
one has, classifying it and then after an analysis, being
able to predict, based on the chosen parameters, a
future result. To do this, the data has to be
parameterized according to certain features chosen
according to the characteristics to be predicted. In
order to succeed, we must have the precise number of
variables, if insufficient variables are specified, the
model produces partial estimates, if there is an excess
of variables the model produces low accuracy
estimates. These variables will be defined according
to the chosen field, in this case study will be related
to tourism.
Figure 1: Technological Model.

The consulted research, shows a relation between
social networks and the information they store, which
gives us the ability to predict events, such as
presidential elections, tourism expectation or sales of
products. In addition, in a case study it was possible
to demonstrate how the power of social interactions
in the form of an advertising campaign and the tweets
generated by it can be analyzed to predict to a certain
extent the results of a future presidential campaign
(Andranik Tumasjan, et al. 2010).
Therefore, we can say that the expectation has
been seen as a point of reference that consumers use
to determine the satisfaction or assessment for the
performance of products or services (Chunyang
Wang et al., 2016), but it is contrasted with how the
expectation is related to the result of a number of
factors generated in the particular case of a film
shown in cinemas (Yang Liu et al., 2007). These
statements generate a motivation about tourism,
which can be classified into two forces that describes
how individuals are motivated to make a decision, in
this case a trip and how they are attracted to a
particular destination by its qualities. On this subject,
the image that each individual has of the destination
is closely related to the motivation he has to travel to
that particular place (Chunyang Wang et al., 2016).
3 PROPOSED MODEL
3.1 Analysis of the Model
According to the research that was carried out for the
development of the model and based on previous
researches that presents scenarios where the use of the
internal processes of the tourism sector can be used as
sources of information that allows the analysis of the
characteristics and behaviors of consumers (Carlos
Raymundo et al., 2017), a need was found in the
tourism sector. Thus the reason a user interest pre-
diction model is proposed. Under this approach, we
asked the following question: What are users looking
for? This can be answered by enhancing its decision-
making management and in the future to predict
tendencies according to the interests of the users.
Consequently, a model for predicting the tourist
interest is proposed as it helps to significantly
increase the decision making capacity. The main idea
of the proposal is to develop a model that has
technological aspects as well as to improve the
process of travel management by adding a new
channel to existing activities. It should be mentioned
that the prediction model is part of the technological
mode. Taking in consideration that in order to
develop it first one must know the business and after
making the process improvements, propose a
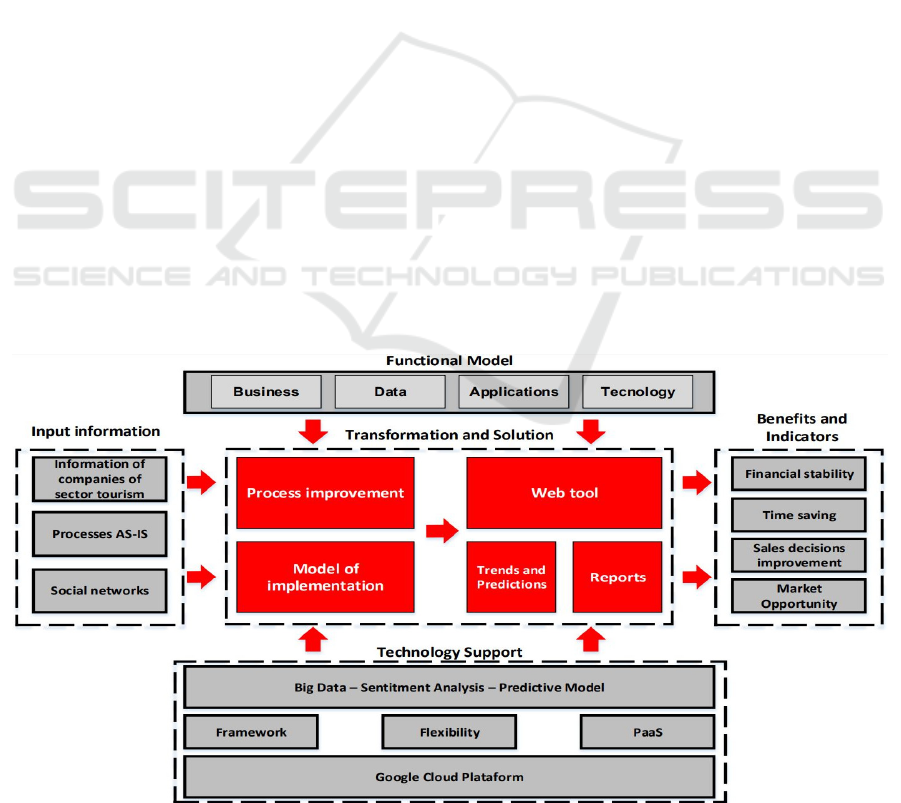
technological solution that meets the need. The model
presents 5 components: information input, functional
model, transformation and solution, technological
support and lastly benefits and indicators (See Figure
1). With each one being able to retrieve the necessary
information from the sector and recognize the needs
of the business, to later define the company's pro-
cesses and identify opportunities for improvement.
Based on this analysis, it is possible to define an
implementation model, one that can identify benefits
and business indicators. Finally, to improve processes
and automate them through a technological solution
that allows analyzing the information of social
networks´ history and it’s in real time and processes
to generate new business opportunities.
3.2 Components
3.2.1 Input Information
Although companies in the tourism sector have limited
capacity in their resources, as well as its processes,
each has its own complexity and information
extraction mechanisms (be it quantitative or
qualitative). For this reason, some of the types of
information needed to have a general framework with
respect to tourism companies are shown, including
information on the current situation of companies in
the tourism sector that allow the identification and
processes As-Is, in addition to looking for a way to
solve the problems that arise in the sector. Therefore,
an external investigation was carried out in order to
understand the following question: What is the most
commonly used information search channel? A survey
was carried out with a sample of 300 users distributed
in 4 well-defined groups and organized by age ranges,
from 17 to 24 years, from 25 to 40 years, from 41 to 60
years and 60 from more. The group with the highest
percentage as shown in Table 1 is the one that includes
ages from 25 to 40 years with 40%. Taking into
account that 55% are male and 45% female.
The search channel type resulting of the surveys
is demonstrated in a ranking Table 1.
Table 1: Search channels ranking.
Search cannel type %
Social Networks (Facebook, twitter, youtube,
among others).
46%
Travel and Tourism Companies 29%
Friend recommendation 16%
Newspapers and magazine 7%
Other 2%
Being the main interest of this study to investigate
the trends of travel and interest of users, the 46% of
the interviewed assess their travelling options with
social networks as a search channel. As a result,
companies in the sector can use social networks as a
new way for collecting information and making
decisions based on the needs and trends of the user.
3.2.2 Functional Model
Each company in the tourism sector is different and
has a complexity of its own according to its structure,
but all of them have shared aspects. That is why the
best practices can be gathered to model their
processes, data, applications and networks. The
functional model presented is segmented to have the
ideal processes in terms of travel management, taking
into account the addition of a new information search
channel. Thus, in the event that at the moment of
releasing information from the tourism sector the
company does not have the defined processes, the
functional model can be supported to fill that gap with
a structured and defined process for them, in addition
to contemplating all the data and documents to
determine the improvement of the processes of the
company. With regard to networks and applications,
it is the reflection of how to model these aspects that
will be modeled in the next stage.
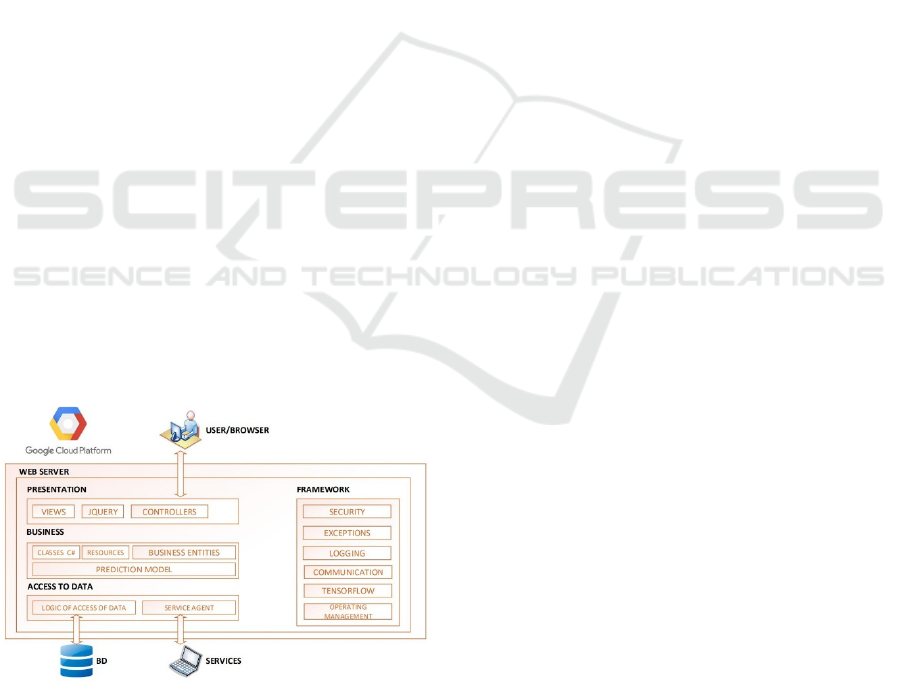
3.2.3 Technological Support
The technological model is determined by several
levels as is grouped by applications and deployment
or networks. In turn, these are classified by
Application Servers, Database, Operating Systems
and Cloud Services (See Figure 2).
Figure 2: Deployment model.
The levels shown in this Technological Support
component are detailed from the bottom to the top,
since part of the need for a solution to be available in
the required time and at the same time that the costs
associated with the solution are adequate to the
situation in which the company in the sector is due to
its limited purchasing power. The levels of the
component are as follows:
Google Cloud Platform: Due to the situation that
companies in the tourism sector are found, it is
proposed the use of Cloud Computing services as a
lower level of infrastructure. Within the cloud-
oriented services there are types, which are: Software
as Services (SaaS), Platform as Services (PaaS) and
Infrastructure as Service (IaaS). For this reason, the
PaaS was chosen because of the need for a platform
to work on the development of the solution.
Likewise, we performed an analysis among the
other cloud service providers where we found well-
known companies as Azure, AWS, IBM SoftLayer
and Google. Among the aforementioned, Google
Cloud Plataform (GCP) it’s starting to have a greater
impact on the market as it has cheaper tariffs and the
ability to compete with the other suppliers. In this
sense, for this contribution, this provider is taken and
services called Cloud DataStore API and Machine
Learning Engine.
Framework, Flexibility and PaaS: For the
development of the system we use the ASP.Net MVC
4 framework, which provides a suitable development
environment for the application, since we can clearly
separate the data loads and use of them to be
displayed in the application. The flexibility is found
in the cloud platform, as it is scalable in nature, it
adapts the ingestion of data loads, either little or if
need be, massive amounts of data. The ability to
perform this task was of vital importance to be able to
build the system, since it adapts to variable data loads.
Within the cloud services we choose PaaS, since the
model covers the entire development cycle from
planning to implementation and testing. It was also
used because it reduces the costs of maintenance,
having a constant monitoring tool and the greater
availability of service use.
The application was developed based on these
three concepts, the framework gives us the ease to
develop and maintain; PaaS is in the integration of
database services, sentiment analysis and continuous
deployment and the flexibility is found in the
platform capacity to deal with variable amounts of
data.
Big Data - Sentiment Analysis: To know the interest
of the user in the places expressed in the Tweets it
was decided to carry out a sentiment analysis, which
was carried out through the Google Prediction API.
For the training of the model a package of 379
examples was used for the classification in four

categories, good, regular, tedious and bad. With this
information we can know in detail the user's feeling.
Data extraction and analysis was performed
following the steps of the following illustration (See
Figure 3).
Figure 3: Load and analysis pseudo-code.
The terms used in the pseudocode for extracting
data from Twitter and the subsequent sentiment
analysis are as follows. A Tweeter query object is
initialized, to which the search parameters are
assigned. In the case of the project, a list of HashTags
related to travel and tourism was used, as the program
has a period of periodic execution, the extraction of
tweets was limited from the previous day to the
present day, and finally, to determine the place from
where the tweet was launched, a flag was used to
collect only tweets containing geo-location. Once
collected, the list is sent to the Google Prediction API
where the sentiment analysis is performed and returns
the tweet's rating as a response.
Prediction Model: To create the prediction model, a
neural network of the Deep Feed-Forward type was
used to predict the tourist interest. The neural
network, takes the input data in the first layer and
after being classified by the hidden layers of the
network, returns the result that was defined according
to the model. This model was trained with data from
the sentiment analysis to have a more accurate
prediction. Taking into consideration that for the
development the wide and deep models were joined,
this gives the neural network a high capacity of
abstraction (See Figure 4). In the proposed model,
horizontal characteristics are taken as day or country,
in addition to using cross features to give the model
more certainty. Within the vertical characteristics
were taken the entry columns. These models are
linked to the data output of the linear regression of the
DNN * (Deep Neural Network). This union gives us
speed and accuracy of calculation, with which we
could predict the tourist interest.
Figure 4: Neural network pseudocode.
3.2.4 Transformation and Solution
This component will take as input the processes As-
Is improved and adapted to what is collected from the
functional model. At this point, To-Be processes are
defined which are recognized as the final processes.
It should also be taken into account that these
processes have process improvements by adding the
proposed new channel, an implementation model to
be developed in the company and the web tool that
supports it.
3.2.5 Benefits and Indicators
Then the section of Transformation and Solution,
should have results that make the tourism company
more efficient, so we detail the following benefits and
indicators of success:
Financial Stability: This indicator will allow the
company to control its expenses, besides allowing to
negotiate discounts with supplier companies by
having a clear idea of the consumers need.
Time Saving: This indicator will reduce the sales
decision making and creation of tourism packages
time, because it will allow to visualize the need of the
consumer in the system.
Sales Decisions Improvement: This benefit allows
the company to visualize forecasting analysis of the
user interest so that decisions can be made in a shorter
time without depending on the companies that control
the market.
Market Opportunity: This benefit is the most
important, because having a new information search
channel will give the company means to compete
against large companies by having real-time
information on the consumer’s needs.
4 VALIDATION
To validate the presented prediction model, we will
use a case study to show that the proposal
successfully solves the needs of tourism companies.
Var Query = new TweetQuery();
Query.HashTags = listHashTags();
Query.Since = Yesterday();
Query.Until = Today();
Query.HasGeotag = True;
ListTweets = SearchTwitter(Query);
Foreach Tweet in ListTweets{
TweetSent = Predict(Tweet);
}
InputColumn = CSV_Column (activity, day, place,
country);
WideColumn = [crossed (activity, place), day, country]
DeepColumn = [activity, day, place, country]
DNNLinearCombinedClassifier(WideColumn,
DeepColumn )
It can be said that it is validated as a part of the model
in order to ensure its correct functioning in the case
study. The components involved will be
transformation and solution for the practical
validation through the case study. In addition, it is
mentioned that for confidentiality purposes the real
company of the sector will be represented as OT
S.A.C.
4.1 OT S.A.C.
OT S.A.C is a small company dedicated to the sell
and distribution of tourist packages, a business that
has 10 employees and a monthly turnover of
approximately $ 29,447.85. It is located in the district
of Santiago de Surco, in the city of Lima, Peru. Its
main suppliers are the wholesale companies in the
sector, which give a list of packages for sale and
distribution. In turn, this company sells custom
packages according to customer's requirement.
This company, since its beginnings, according to
the national regulations regarding the package
distributors, was favored by the client portfolio that
already had because of related businesses. But as new
competing companies appeared in the sector with
same products, it led to a price contest that gave a
sudden growth of companies in this area.
Under this circumstance, the company owners and
managers focused on the vision of using new
technologies and trends to keep the company's sales
afloat. That is why it is proposed to this company to
implement a prediction model in collaboration with
it’s the workers, as well as the direct managers of the
company.
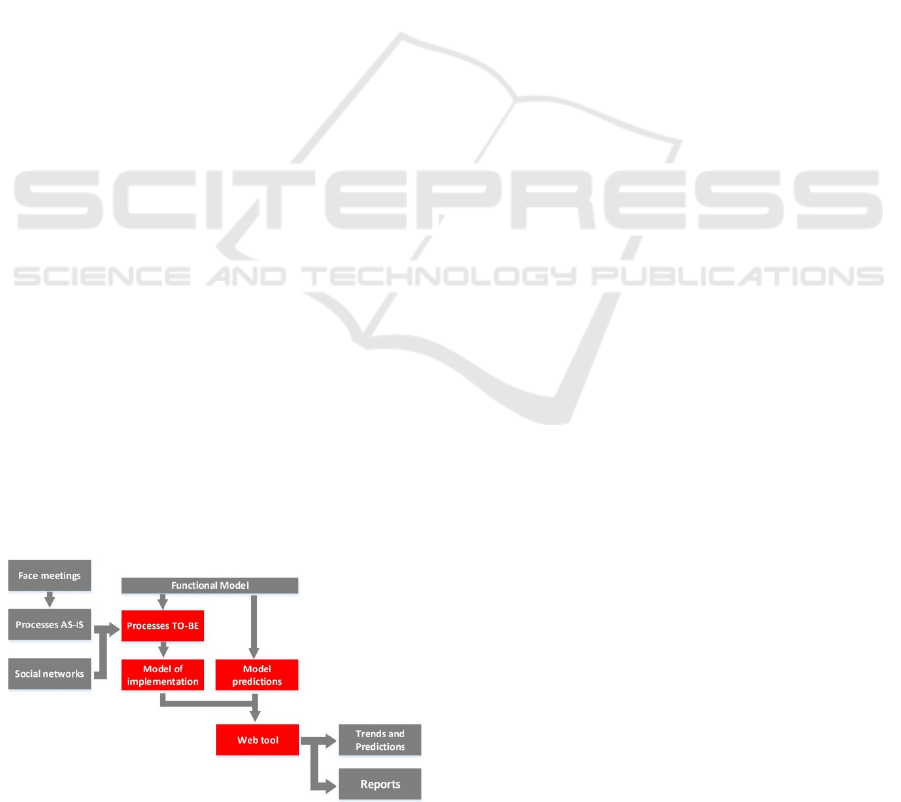
4.2 Implementation
The schematic to implement the proposed model can
be visualized in Figure 5, which details the necessary
steps that the company OT S.A.C has to implement
for this proposal, the graph is read from top left to the
bottom right of the graph.
Figure 5: Technological model implementation.
Face Meetings: The implementation was made
through weekly meetings with the owners and
workers involved, during this period were explained
the company processes. OT S.A.C has the following
processes:
- Travel Management
- Sales
- Logistics
- Accounting
- IT Management
- Legal
Processes As-Is: When carrying out an information
survey, it was noted that the company OT SAC did
not have well-defined processes, so it was not
possible to design an As-Is, but it was based on all the
functions performed by each worker to recognize
their activities and then the processes they performed.
In the process of developing processes As-Is, we
detect a dependency in wholesalers companies that
control the market, so that a new information
collection channel is presented where companies can
make decisions based on the needs of users and trends
shown on social networks.
To-Be Processes: With the identified processes, a
detailed work was done to be able to define which key
processes the company should carry out to have an
optimal performance, without any voids that can
affect it. Reason why it was based on the functional
model to reference the components and thus be able
to contrast their information gaps.
In this particular case, we identify the following
wrongdoings inside the Travel Management process.
- The process does not have proper
documentation or any additional information
other than the mayor market controlling
companies.
- The input information they have is outdated,
as is based on the historical record of other
companies.
- The user requirements response time is
limited to the response that can be provided
by another company that has the information.
These are the main findings compared to the
Functional Model. To solve these problems we
introduced a new information search channel within
the process supported by an application developed for
the company. In this way the company can make real-
time decisions according to the user's tendencies and
the predictions that tool generates.
Implementation Model: It is the graphic representa-
tion of the phases that the company must carry out in
order to implement the proposed model. Taking into
account that training is planned in the company to
perform a correct management of the organizational
change and prepare the workers to use the new tools
and technologies in this sector.
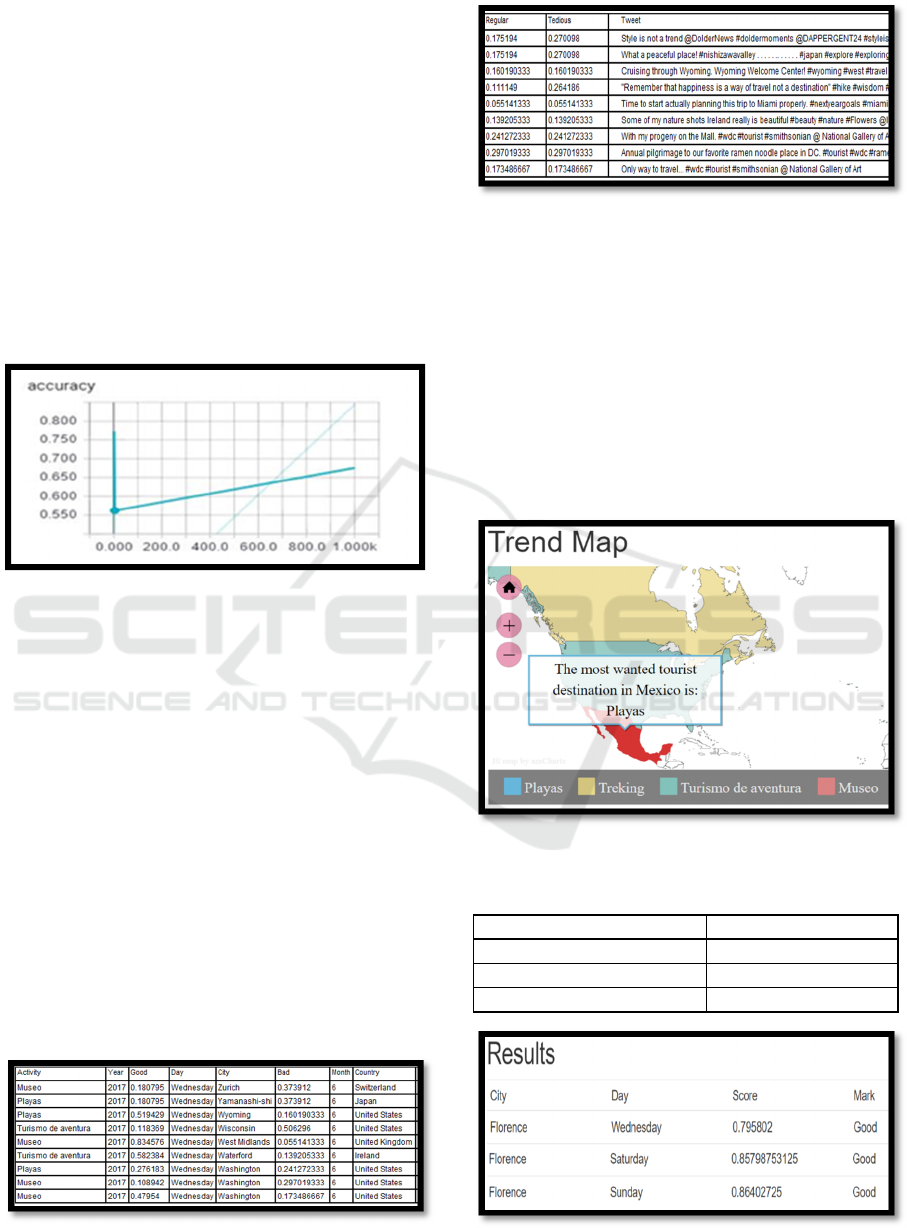
Predictive Model: Taking into account the benefits of
implementing a sentiment analysis along with a
predictive model, the solution was implemented in
the company OT S.A.C. To implement the model, the
training was carried out with test data from the
sentiment analysis. Figure 6, shows the learning
process of the neural network through each iteration.
Once a job is sent to train the neural network with the
model, it makes use of the neurons to be able to infer
the results. The progressive increase of accuracy in
each step of the training phase, demonstrates the
learning capacity of the network.
Figure 6: Accuracy graph.
Web Tool: To develop the prediction model for the
company OT SAC, a web tool was devised in order
to research and collect information from a social
network, in this case twitter. This information will
analyze the users' comments and identify their
preferences, tastes and mood, etc. This will provide
rating information of a city, country and travel
package, as well as to generate input data to
subsequently predict travel destinations with a greater
acceptance range.
For this part, we used the concepts of Sentiment
Analysis presented in section 3.2.3; which allowed us
to analyze the tweet of users worldwide. This helped
us to create a database with the following fields ID,
Activity (Museum, Beach, Trekking, Adventure
Tourism), Country, City (Place), Year, Day, Month,
Range (Good, Bad , Regular, Tedious) and finally the
tweet itself to analyze. (See Figure 7a and 7b).
Figure 7a: Database of analyzed tweets. Part 1.
Figure 7b: Database of analyzed tweets. Part 2.
With these results and using the prediction model
integrated into the web tool, it is possible to predict
the trend and activities the users will have in different
parts of the world (see Figure 8). In addition, we can
identify which days are highest rated among users to
plan a trip (see Figure 9). Taking it into account, a
metric to analyze this information was constructed,
dividing it into three categories as described in the
following lines, good, average and bad, as seen in
Table 2. Furthermore it grants the user a view of the
raked packages from other users. (See Figure 10).
Figure 8: User tendency map.
Table 2: Ranking metrics by city, country or package.
Metric Category
[0- 0.25] Bad
[0.251- 0.75] Regular
[0.751- 1] Good
Figure 9: Rating reports by city.
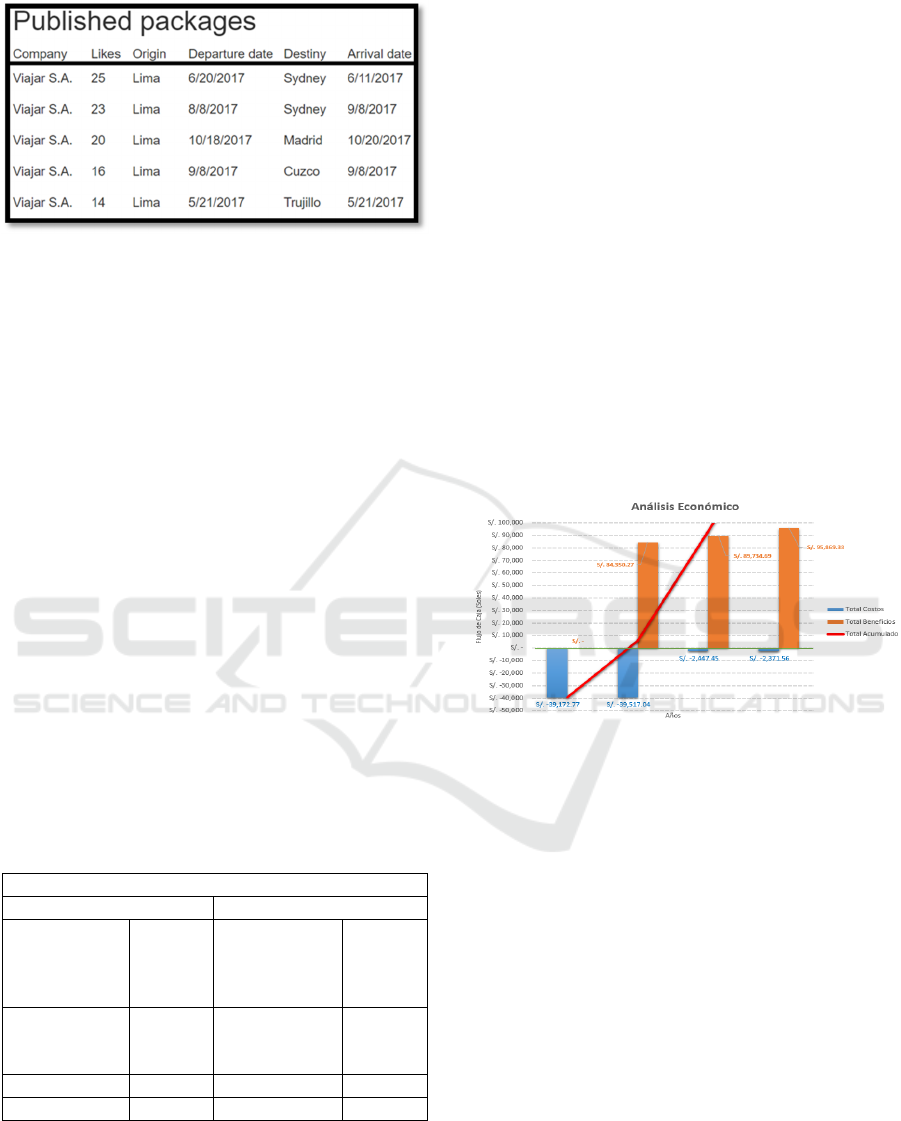
Figure 10: User trends map showing activities by country.
4.3 Results
Once implementation of the technological model in
OT SAC was completed, it can be observed that the
benefits and indicators in the processes using the new
trends and technologies assure a greater quantity of
sales. It is also considered that using tools of massive
data analysis, in accordance to International Data
Corporation (IDC) (Carlos Raymundo et al., 2017),
progressively increase sales by a 12% margin. In
order to test this assertion, an analysis of the loss
indicator due to logistical expenditures was made, in
Fig. 15. It presents all the logistical movements that
are considered expenses. The 57% of the total annual
expense and costs are due to two mayor causes. The
first cause is the difference in purchase prices,
amounting to 17.6% of the total. The other reason is
the unnecessary purchases taking a 39.9% of this
total. After the implementation of the technological
model and thanks to the support provided by the
prediction model, the company OT S.A.C was able to
reduce their logistical expenses as explained in Table
3. Considering a 40% threshold.
Table 3: Loss caused by logistical expenses.
Loss caused by logistical expenses ($)
Before After
Annual
expenses
cause by price
difference.
4824.24
Annual
expenses
cause by price
difference.
3600
Annual loss
cause by
purchases.
11,104.3
Annual loss
cause by
purchases.
7773.01
Loss %
57%
Loss %
27%
Indicator
Critic
Indicator
Positive
Upon a closer inspection of the results, the
following can be said:
- Before the implementation of the technologi-
cal model, the company had a large margin of
loss in the purchase and separation of
packages. The reason for this behavior can be
explained because the company did not have a
clear reference on the need of its customers.
Now with the model, not only can company
recognize the customers’ need, it can also
negotiate with its suppliers new rates that will
generate a higher gross sales income.
- The feasibility study (see Fig. 11), shows the
investment and recovery periods projected
after the model implementation. It shows a $
24,212.92 investment over 12 month. It
includes both the workforce cost for the
implementation and cloud services costs.
Culminating that period the only cost would be
the cloud services. At this time frame the
company will have an estimated profit of $
25,953.93 due to insured sales. These last
values are made possible by having an
investment return of approximately 11
months, with a ROI of 114%, being totally
profitable for a company in the tourism sector.
Figure 11: Feasibility study.
- We arrive at the conclusion that the joint
implementation of a technological and
predictive model will bring benefits to the
tourism sector as it generates new market
opportunities.
5 CONTINUITY
In future proposals new instances of the business
model could be applied and be escalated across the
company, not only generating new sales business
channels, allowing us to make more accurate
decisions, but it could also be used in other
administrative process, reducing their cost.
In addition, it opens a myriad of possibilities for
related and unrelated fields where the analysis of
massive social network data could reduce the
operating costs and increase the company's revenue.

6 CONCLUSION
To answer the problem of controlling the logistical
expenses based on a technological model through a
reengineering, process improvement, the use of
Cloud Computing and Big Data is needed to support
a company in the tourism sector and to obtain both
financial and operational stability.
It was demonstrated that the use of technologies
such as Cloud Computing and Big Data oriented in a
free software guideline is reliable for companies in
the tourism sector, since the cost of these services are
adequate to the purchasing capacity of small and
medium enterprises.
Finally, it was demonstrated that a control vision
provides utilities for an industry in an indirect way,
reducing the losses in logistical expenses, saving time
creating packages and money as a result.
REFERENCES
Scowsill, D., 2017. Global Economic Impact & Issues
2017. Economic impact research. World Travel &
Tourism Council. Retrieved June 9, 2017 from
https://www.wttc.org/-/media/files/reports/economic-
impact-research/2017-documents/global-economic-
impact-and-issues-2017.pdf
UN, 70/193, General Assembly, 70th Sess, Supp No 81, UN
Doc A/RES/70/193 (2015).
Thomas H. Davenport. 2013. At the Big Data Crossroads:
turning towards a smarter travel experience.
Kiran Garimella, Gianmarco De Francisci Morales,
Aristides Gionis, and Michael Mathioudakis. 2016.
Quantifying Controversy in Social Media. In
Proceedings of the Ninth ACM International
Conference on Web Search and Data Mining (WSDM
'16). ACM, New York, NY, USA, 33-42. DOI:
https://doi.org/10.1145/2835776.2835792
Ali Marstawi, Nurfadhlina Mohd Sharef, Teh Noranis
Mohd Aris, and Aida Mustapha. 2017. Ontology-based
Aspect Extraction for an Improved Sentiment Analysis
in Summarization of Product Reviews. In Proceedings
of the 8th International Conference on Computer
Modeling and Simulation (ICCMS '17). ACM, New
York, NY, USA, 100-104. DOI: https://doi.org/
10.1145/3036331.3036362
Anna Jurek, Maurice Mulvenna, Yaxin Bi, Improved
lexicon-based sentiment analysis for social media
analytics, Security Informatics, Volume 4, 2015, ISSN
2190-8532, http://dx.doi.org/10.1186/s13388-015-
0024-x
Pratik Thakor, Sreela Sasi, Ontology-based Sentiment
Analysis Process for Social Media Content, Procedia
Computer Science, Volume 53, 2015, Pages 199-207,
ISSN 1877-0509, http://dx.doi.org/10.1016/j.procs.
2015.07.295
Dongwen Zhang, Hua Xu, Zengcai Su, Yunfeng Xu,
Chinese comments sentiment classification based on
word2vec and SVM, Expert Systems with Applications,
Volume 42, Issue 4, 2015, Pages 1857-1863, ISSN
0957-4174, http://dx.doi.org/10.1016/j.eswa.2014.09.
011
R. Linares, J. Herrera, A. Cuadros and L. Alfaro,
"Prediction of tourist traffic to Peru by using sentiment
analysis in Twitter social network," 2015 Latin
American Computing Conference (CLEI), Arequipa,
2015, pp. 1-7. DOI=https://doi.org/10.1109/CLEI.
2015.7360051
Eric Baucom, Azade Sanjari, Xiaozhong Liu, and Miao
Chen. 2013. Mirroring the real world in social media:
twitter, geolocation, and sentiment analysis. In
Proceedings of the 2013 international workshop on
Mining unstructured big data using natural language
processing (UnstructureNLP '13). ACM, New York, NY,
USA, 61-68. DOI=http://dx.doi.org/10.1145/2513549.
2513559
John Kordonis, Symeon Symeonidis, and Avi Arampatzis.
2016. Stock Price Forecasting via Sentiment Analysis
on Twitter. In Proceedings of the 20th Pan-Hellenic
Conference on Informatics (PCI '16). ACM, New York,
NY, USA, Article 36, 6 pages. DOI=https://doi.org/
10.1145/3003733.3003787
Andranik Tumasjan, et al. 2010. Predicting Elections with
Twitter: What 140 Characters Reveal about Political
Sentiment. In Proceedings of the Fourth International
AAAI Conference on Weblogs and Social Media.
(Washington, DC, USA, May 23-26, 2010).
Chunyang Wang, Hailin Qu, Maxwell K. Hsu, Toward an
integrated model of tourist expectation formation and
gender difference, Tourism Management, Volume 54,
2016, Pages 58-71, ISSN 0261-5177, http://dx.doi.org/
10.1016/j.tourman.2015.10.009
Yang Liu, Xiangji Huang, Aijun An, and Xiaohui Yu. 2007.
ARSA: a sentiment-aware model for predicting sales
performance using blogs. In Proceedings of the 30th
annual international ACM SIGIR conference on
Research and development in information retrieval
(SIGIR '07). ACM, New York, NY, USA, 607-614. DOI=
https://doi.org/10.1145/1277741.1277845
Carlos Raymundo, Cesar Mérida, Richer Rios and Alfred
Kobayashi, 2017, Modelo arquitectónico de
información para una plataforma de Big Data para el
Sector Turístico. In Proceedings of the Décima Sexta
Conferencia Iberoamericana en Sistemas, Cibernética
e Informática (CISCI 2017), Orlando, Florida, EE.UU.
Anon. 2017. Big Data and Business Analytics Revenues
Forecast to Reach $150.8 Billion This Year, Led by
Banking and Manufacturing Investments, According to
IDC. (March 2017). Retrieved June 10, 2017 from
http://www.idc.com/getdoc.jsp?containerId=prUS4237
1417.
